Transcription
MSP services: worldwide forecast 2018–2023Managed service providerservices: worldwide forecast2018–2023Terry van Staden
MSP services: worldwide forecast 2018–20232Contents7. Executive summary8. Executive summary: MSPs’ revenue will grow at 12% CAGR between 2018and 2023, driven by IT and managed services, business applications andinfrastructure17. Our methodology: we use extensive primary research, along with vendorand macroeconomic insights to size and segment the market opportunityand outlook18. Definitions: IT and managed services [1]9. Forecast results19. Definitions: IT and managed services [2]10. MSPs will account for USD300 billion of business spending in 2023, whichis around 11% of the total ICT market20. Definitions: IT and managed services [3]11. IT and managed services, infrastructure and business applications accountfor over 75% of MSPs’ revenue and are expected to deliver strong growth21. Definitions: infrastructure [1]22. Definitions: infrastructure [2]12. MSPs’ core target market is businesses with around 10–250 employees,but addressing businesses of all sizes offers growth opportunities23. Definitions: infrastructure [3]13. IT and managed services: this category accounts for most of MSPs’revenue and 60% of this revenue comes from support and consultingservices25. Definitions: infrastructure [5]14. Infrastructure is one of the largest and fastest-growing components ofMSPs’ portfolios, driven by the growing demand for cloud server andnetworking services27. About the author and Analysys Mason15. Business applications revenue will increase at a CAGR of 18% between2018 and 2023, driven by basic SaaS such as email and productivitysuites29. Analysys Mason’s consulting and research are uniquely positioned16. Forecast methodology and definitions24. Definitions: infrastructure [4]26. Definitions: infrastructure [6]28. About the author30. Research from Analysys Mason31. About AMI-Partners
MSP services: worldwide forecast 2018–20233List of figuresFigure 1: Change in MSPs’ revenue by level 1 category, worldwide, 2018–2023Figure 14a: Definitions and key drivers for IT and managed servicesFigure 2: MSPs’ revenue by cloud and on-premises, worldwide, 2018–2023Figure 14b: Definitions and key drivers for IT and managed servicesFigure 3: MSPs’ revenue in 2018, and CAGR for revenue 2018–2023, bybusiness size, worldwideFigure 14c: Definitions and key drivers for IT and managed servicesFigure 4: Business spending on ICT services in 2018 and CAGR 2018–2023,by channel, worldwide, 2018–2023Figure 15a: Definitions and key drivers for infrastructureFigure 15b: Definitions and key drivers for infrastructureFigure 5: Total business spending on ICT services and MSPs’ share, worldwide,2018–2023Figure 15c: Definitions and key drivers for infrastructureFigure 6: MSPs’ revenue by level 1 category, worldwide, 2018–2023Figure 15e: Definitions and key drivers for infrastructureFigure 7: MSPs’ revenue in 2018 and CAGR 2018–2023, by level 1 category,worldwideFigure 15f: Definitions and key drivers for infrastructureFigure 8: MSPs’ revenue by business size, worldwide, 2018–2023Figure 9: MSPs’ revenue and CAGR by level 1 category and business size,worldwide, 2018–2023Figure 10: MSPs’ revenue from IT and managed services by aggregated level 3categories, worldwide, 2018–2023Figure 11: MSPs’ revenue from infrastructure, cloud and on-premises,worldwide, 2018–2023Figure 12: MSPs’ revenue from infrastructure services by level 3 category,worldwide, 2018–2023Figure 13: MSPs’ revenue from business applications by level 2 category,worldwide, 2018–2023Figure 15d: Definitions and key drivers for infrastructure
MSP services: worldwide forecast 2018–20234About this reportThis report provides forecasts for the worldwide managed serviceprovider (MSP) market and covers the key individual services andbusiness segments that represent the largest opportunity forMSPs.It highlights the rapid revenue growth that is expected in the MSPmarket between 2018 and 2023 as businesses increasingly moveto ‘as-a-service’ models. MSPs will be one of the fastest-growingroutes to market as more businesses seek MSP support to movetheir propositions to the cloud.This report quantifies the revenue opportunity for MSPs in nineICT categories and provides more-granular data on the categoriesthat are the most significant opportunities for MSPs(infrastructure, IT and managed services, and businessapplications).It is based on the following sources: Business applications Cyber security Infrastructure Devices and peripherals IT and managed services Platforms Collaboration Web services CommunicationsWHO SHOULD READ THIS REPORT MSPs that want to identify key areas for revenue growth, both in termsof business segments and individual services. the Analysys Mason ICT Global Model1 Service providers that are looking to enter the managed ICT servicesmarket. a survey of 950 MSPs in emerging Asia–Pacific Telecoms operators that are looking to enter the managed ICT servicesmarket. economic indicators, such as GDP and population growth vendor and supply-side indicators, such as pricing andfinancial reporting.1KEY ICT CATEGORIESFor more information, see Analysys Mason's SMB ICT channels and forecasts practice.
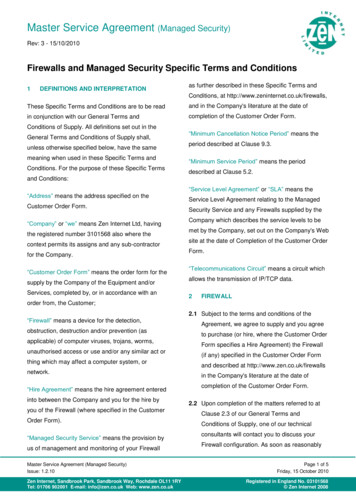
MSP services: worldwide forecast 2018–20235Analysys Mason’s ICT Global Model: metrics included in this report [1] 11 level 1 categories 130 level 3 categories 37 level 2 categories In this reportPCsLevel 3Feature ng and Peripheralsperipherals Printing iness intelligenceCRMEmailEnterprise contentOn-premises/ managementlicensedHRsoftwarePayrollTravel and expensesAccounting/financialBusiness intelligenceCRMEmailERPHRMarketing automationPayrollPoint of salesProductivityProject managementQuotes and invoicingTravel and expensesPC/device as a service (PCDaaS)VirtualisationNetworking softwarePoint of salesQuotes and invoicingServerNetworking servicesLine-of-business softwareProject managementIaaSNetworking hardwareERPProductivitySoftware as Line of businesssoftwarea serviceStorage softwareInfrastructureLevel 2MobilehardwareLevel 2Storage hardwareOn-premises/licensed softwareSoftware as a serviceEndpoint securityCyber securityBusiness applicationsDevices andperipheralsLevel 1Level 1Mobile securityNetwork securitySecurity hardwareSoftware as a serviceFC SANNASSAN switchesTape backupBackup and recovery (on-premises)Replication softwareLevel 3IP SANPC attached storageServer attached storageOther storage softwareStorage resource managementsoftwareIaaS storage simple developmentIaaS serverIaaS storage online backupRecovery as a service (RaaS)IaaS server colocationServerDesktop as a service (DaaS)Desktop virtualisationServer virtualisationStorage virtualisationLAN switchesRouters (wired)Wireless LANCloud VPNIP VPNWANNetworking softwarePoint-to-point VPNDatabase (on-premises)MiddlewareMobile application developmentOperating systemDatabase (SaaS)EncryptionSecure content managementWeb/messaging security (onWeb/messaging security (SaaS)premises)Mobile application management (onMobile application management (SaaS)premises)Mobile device management (MDM)Mobile device management (SaaS)Identity and access management (on- Identity and access managementpremises)(SaaS)Security information and eventSecurity information and eventmanagement (on-premises)managementIntrusion detection and preventionPoint-to-point VPN/firewallSecurity policy, vulnerability and event managementDedicated security appliance Unified threat management applianceIaaS securityAnalysys Mason’s ICT Global Model has more than 130 level 3 categories. This report provides level 1 category information foralmost all categories of services, and focuses on level 2 and level 3 information for the categories that are most important to MSPs– infrastructure, IT and managed services, and business applications.
MSP services: worldwide forecast 2018–20236Analysys Mason’s ICT Global Model: metrics included in this report [2]Level 1Level 2Product support servicesProfessional servicesIT and managed servicesRemote managed IT services market(RMITS)On-premises/licensed softwareSoftware as a serviceCollaborationUC servicesUC softwareFixed hardwareFixed servicesInternet accessCommunicationsMobile service plansUC hardwarePlatformsDigital marketing and advertisingPlatform as a serviceDigital marketing and advertisingSocialWeb servicesWeb hosting and developmentComputing supportSecurity supportStorage supportDevelopment and integrationProcess managementOther IT servicesNetworking (wired)PBX (TDM and/or IP-PBX)SecurityStorageCollaboration (on-premises)Collaboration – business workflowCollaboration – fileshareAudio conferencingVideo conferencingCommunications/unified messaging softwarePresence/enterprise instant messaging (EIM)Pure TDM-PBX/key systemsIP trunkingLocal/long-distance telephonyWired broadbandWireless broadbandFeature phone plan (voice, text)Smartphone plan (data, voice, text)Tablet plan (data)IP PBX/hybridIP phones/adaptorsPlatform as a service (PaaS)Display advertisingSearch engine marketingSocial media marketingWebsite developmentWebsite hosting/maintenanceLevel 3Networking supportSoftware supportIT consultingMobile device (MMS)Networking (wireless)PCServerHosted VoIPWeb conferencing
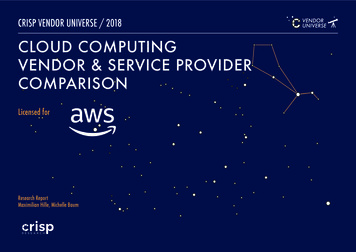
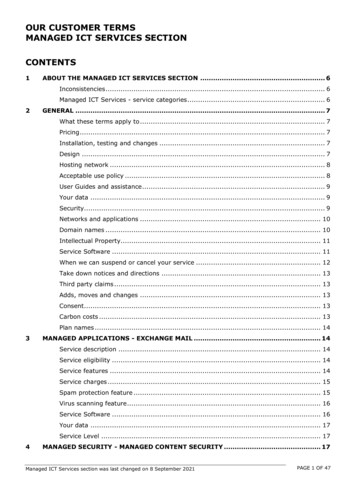
MSP services: worldwide forecast 2018–202311IT and managed services, infrastructure and business applications account for over75% of MSPs’ revenue and are expected to deliver strong growthWe expect revenue growth for MSPs in all the level 1 categoriesconsidered in this report. Most of the revenue, and revenuegrowth, will come from MSPs’ core categories of IT andmanaged services, infrastructure and business applications.Figure 7: MSPs’ revenue in 2018 and CAGR 2018–2023, bylevel 1 category, worldwideProportion of business spend, 201850%MSPs generally provide diverse portfolios to address a range ofclient requirements and to capitalise on the widespread growth inthe ICT market.45%Most of MSPs’ revenue comes from the core categories, but othercategories will offer significant growth opportunities. We expectMSPs to take a bigger role in communication services, asbusinesses seek providers of end-to-end ICT usiness applicationsCommunicationDevices and peripheralsIT and managed servicesWeb services20222023CollaborationCyber securityInfrastructurePlatformSource: Analysys er security2019Web services2018Devices and peripherals0Business applications200Infrastructure0%IT and managed servicesRevenue (USD billion)40028%25%15%Figure 6: MSPs’ revenue by level 1 category, worldwide, 2018–2023CAGR 2018-2023Source: Analysys Mason
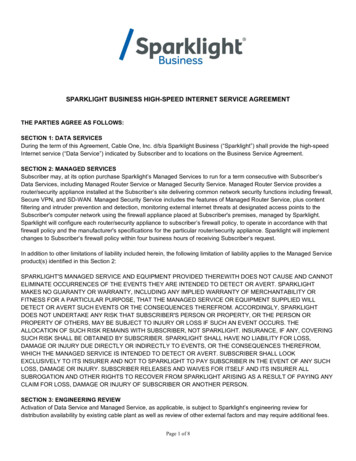
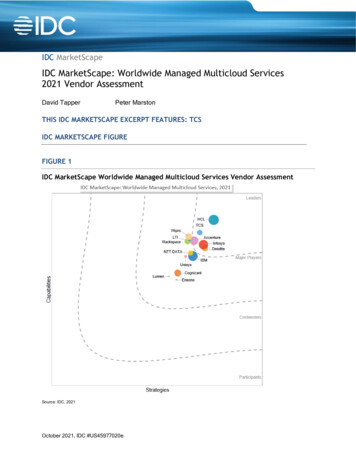
MSP services: worldwide forecast 2018–202312MSPs’ core target market is businesses with around 10–250 employees, butaddressing businesses of all sizes offers growth opportunitiesRevenue (USD billion)MSPs are often the most economical and effective means ofacquiring high-quality ICT systems and networks for manybusinesses. Businesses with 50–250 employees are likely tohave some form of in-house IT support, but not necessarily theexpertise or number of personnel needed to support a complexICT system or solutions from multiple vendors. Services such ashybrid cloud can be complex, driving businesses to request thesupport of MSPs. The next three slides provide a detailedbreakdown of the most important revenue categories.Figure 8: MSPs’ revenue by business size, worldwide, 2018–2023350300250200150100500Figure 9: MSPs’ revenue and CAGR by level 1 category andbusiness size, worldwide, 2018–2023CAGR14%9080CAGR13%70Revenue (USD billion)MSPs will continue to generate most of their revenue frombusinesses with around 10–250 employees because thesebusinesses tend to need complicated ICT services but do notnecessarily have the in-house expertise to support them.6050CAGR12%CAGR14%CAGR8%403020101000 023Source: Analysys Mason02018 2023 2018 2023 2018 2023 2018 2023 2018 20230-910-49Business applicationsCommunicationDevices and peripheralsIT and managed servicesWeb services50-249250-9991000 CollaborationCyber securityInfrastructurePlatformSource: Analysys Mason
MSP services: worldwide forecast 2018–2023ContentsExecutive summaryForecast resultsForecast methodology and definitionsAbout the author and Analysys Mason
MSP services: worldwide forecast 2018–2023About the authorTerry van Staden (Analyst, Research) is a member of Analysys Mason’s Operator business services and IoT research practice, focusing onoperator strategies for the enterprise market. He specialises in SME bundling strategies, primary research and is responsible for our enterprisesurvey work. Prior to joining Analysys Mason, Terry received his masters in economics under full scholarship in South Africa, where his researchpapers won – or were nominated for – several national awards. He is a member of the Golden Key International Honour Society and therecipient of the Gold Duke of Edinburgh's Award.28
MSP services: worldwide forecast 2018–202329Analysys Mason’s consulting and research are uniquely positionedAnalysys Mason’s consulting services and research portfolioConsultingWe deliver tangible benefits to clients across the telecomsindustry: communications and digital service providers, vendors,financial and strategic investors, private equity andinfrastructure funds, governments, regulators, broadcastersand service and content providersOur sector specialists understand the distinct local challengesfacing clients, in addition to the wider effects of global forces.We are future-focused and help clients understand the challengesand opportunities new technology brings.ResearchOur dedicated team of analysts track and forecast the differentservices accessed by consumers and enterprises.We offer detailed insight into the software, infrastructure andtechnology delivering those services.Clients benefit from regular and timely intelligence, and directaccess to analysts.
MSP services: worldwide forecast 2018–2023Research from Analysys Mason30
MSP services: worldwide forecast 2018–2023About AMI-PartnersAMI-Partners is a global ICTresearch and consulting firm thatfocuses on the small and mediumsized business (SMB) market. AMI-Partners was founded in 1996 and has over20 years of expertise in the SMB ICT market. Itwas acquired by Analysys Mason in July 2018. Its specialisms include: go-to-market opportunity assessment tracking buying behaviour customer segmentation channel partner ecosystem dynamics sales enablement. AMI-Partners has invested over USD50 million inprimary SMB research to date, thereby setting aglobal benchmark.31
MSP services: worldwide forecast 2018–2023PUBLISHED BY ANALYSYS MASON LIMITED IN MARCH 2019Bush House North West Wing Aldwych London WC2B 4PJ UKTel: 44 (0)20 7395 9000 Email: research@analysysmason.com www.analysysmason.com/research Registered in England and Wales No. 5177472 Analysys Mason Limited 2019. All rights reserved. No part of this publication may be reproduced, stored in a retrieval system or transmitted in any form or by any means – electronic,mechanical, photocopying, recording or otherwise – without the prior written permission of the publisher.Figures and projections contained in this report are based on publicly available information only and are produced by the Research Division of Analysys Mason Limited independently of anyclient-specific work within Analysys Mason Limited. The opinions expressed are those of the stated authors only.Analysys Mason Limited recognises that many terms appearing in this report are proprietary; all such trademarks are acknowledged and every effort has been made to indicate them by thenormal UK publishing practice of capitalisation. However, the presence of a term, in whatever form, does not affect its legal status as a trademark.Analysys Mason Limited maintains that all reasonable care and skill have been used in the compilation of this publication. However, Analysys Mason Limited shall not be under any liability forloss or damage (including consequential loss) whatsoever or howsoever arising as a result of the use of this publication by the customer, his servants, agents or any third party.
(infrastructure, IT and managed services, and business applications). It is based on the following sources: the Analysys Mason ICT Global Model1 a survey of 950 MSPs in emerging Asia-Pacific economic indicators, such as GDP and population growth vendor and supply-side indicators, such as pricing and financial reporting. 4 About this report