Transcription
Root Cause AnalysisDecember, 9th, 2008Ghinassi / WPIC / UPMC / Univ ofPittsburgh / 2009
Ghinassi / WPIC / UPMC / Univ ofPittsburgh / 2009
Root Cause Analysis IntroductionRoot Cause Analysis, according to The Joint Commission is a "process foridentifying the basic or causal factors that underlie variation in performance,including the occurrence or possible occurrence of a sentinel event.“Sentinel events include medication errors, patients' suicide, procedurecomplications, wrong site surgery, treatment delay, restraint death,elopement death, assault or rape, transfusion death, and infant abduction.Direct causes bring about the sentinel event without any other interveningevent.Most direct causes are physically proximate to the sentinel event.The effect of root causes on sentinel events are always through some directcause.Because of accreditation requirements and due to renewed interest inpatient safety, many hospitals and clinics are actively conducting RootCause Analyses.Ghinassi / WPIC / UPMC / Univ ofPittsburgh / 2009
Root Cause Analysis When a sentinel event occurs, most employees are focused on thedirect causes that have led to the event.For example, many will claim that the cause of medication error is afailure to check label against the patient's armband.But this is just the direct cause.To get to the real reasons, one should ask why did the clinician notcheck the label against the armband.The purpose of Root Cause analysis is to go beyond direct andsomewhat apparent causes and figure out the underlying reasonsfor the eventThe objective is to force one to think harder about the source of theproblem.It is possible that the label was not checked against the armbandbecause the label was missing.Furthermore it is also possible that the label was missing becausethe computer was not printing.Ghinassi / WPIC / UPMC / Univ ofPittsburgh / 2009
Root Cause Analysis Then, the root cause is computer malfunction and the direct cause isthe failure to check the label against the armband. Exhorting employees to check the armband against the label is awaste of time, if there is no label to check in the first place. A focus on direct causes may prevent the sentinel event for a while,but sooner or later the root cause will lead to a sentinel event. Inattention to root causes promotes palliative solutions that do notwork in the long run The value of root cause analysis lies in identifying the true,underlying causes. An investigation that dos not do this is at best a waste of time andresources, and at worst can exacerbate the problems it wasintended to fix. But how do we know if our speculation about the causes of an eventare correct?Ghinassi / WPIC / UPMC / Univ ofPittsburgh / 2009
Root Cause Analysis Root cause analysis techniquesSimplest technique out of all the RCA TechniquesFor every effect there is a causeThere is a fairly long chain of relationship between thecause and its effectAs we move along the chain these cause and effectbecome finer and finerJust like we dig a tree its roots become finer and finerThe finest cause if removed, the problem will not reappearThis is the essence or Root Cause Analysis.Ghinassi / WPIC / UPMC / Univ ofPittsburgh / 2009
Root Cause Analysis Root cause analysis (RCA) is a class of problemsolving methods aimed at identifying the root causes ofproblems or events The practice of RCA is predicated on the belief thatproblems are best solved by attempting to correct oreliminate root causes, as opposed to merely addressingthe immediately obvious symptoms By directing corrective measures at root causes, it ishoped that the likelihood of problem recurrence will beminimized However, it is recognized that complete prevention ofrecurrence by a single intervention is not always possible Thus, RCA is often considered to be an iterativeprocess, and is frequently viewed as a tool of continuousimprovement.Ghinassi / WPIC / UPMC / Univ ofPittsburgh / 2009
Root Cause Analysis RCA, initially is a reactive method ofproblem solving This means that the analysis is done afteran event has occurred By gaining expertise in RCA it becomes apro-active method This means that RCA is able to forecastthe possibility of an event even before itcould occur.Ghinassi / WPIC / UPMC / Univ ofPittsburgh / 2009
Root Cause Analysis Root cause analysis is not a single, sharplydefined methodology there are many different tools, processes, andphilosophies of RCA in existence However, most of these can be classed into five,very-broadly defined "schools" that are namedhere by their basic fields of process-basedfailure-basedand systems-based.Ghinassi / WPIC / UPMC / Univ ofPittsburgh / 2009
Root Cause Analysis Safety-based RCA descends from the fields of accidentanalysis and occupational safety and health. Production-based RCA has its origins in the field ofquality control for industrial manufacturing. Process-based RCA is basically a follow-on toproduction-based RCA, but with a scope that has beenexpanded to include business processes. Failure-based RCA is rooted in the practice of failureanalysis as employed in engineering and maintenance. Systems-based RCA has emerged as an amalgamationof the preceding schools, along with ideas taken fromfields such as change management, risk management,and systems analysis.Ghinassi / WPIC / UPMC / Univ ofPittsburgh / 2009
Root Cause Analysis General principles of root cause analysis Aiming performance improvement measures at rootcauses is more effective than merely treating thesymptoms of a problem. To be effective, RCA must be performed systematically,with conclusions and causes backed up by documentedevidence. There is usually more than one root cause for any givenproblem. To be effective the analysis must establish all knowncausal relationships between the root cause's) and thedefined problem.Ghinassi / WPIC / UPMC / Univ ofPittsburgh / 2009
Root Cause AnalysisGhinassi / WPIC / UPMC / Univ ofPittsburgh / 2009
Bayesian Network A Bayesian network (or a belief network) is aprobabilistic graphical model that represents aset of variables and their probabilisticindependencies For example, a Bayesian network couldrepresent the probabilistic relationships betweendiseases and symptoms Given symptoms, the network can be used tocompute the probabilities of the presence ofvarious diseases.Ghinassi / WPIC / UPMC / Univ ofPittsburgh / 2009
Bayesian Network Formally, Bayesian networks are directed acyclic graphs whosenodes represent variables, and whose missing edges encodeconditional independencies between the variables Nodes can represent any kind of variable, be it a measuredparameter, a latent variable or a hypothesis They are not restricted to representing random variables, whichrepresents another "Bayesian" aspect of a Bayesian network Efficient algorithms exist that perform inference and learning inBayesian networks Bayesian networks that model sequences of variables (such as, forexample, speech signals or protein sequences) are called dynamicBayesian networks Generalizations of Bayesian networks that can represent and solvedecision problems under uncertainty are called influence diagrams.Ghinassi / WPIC / UPMC / Univ ofPittsburgh / 2009
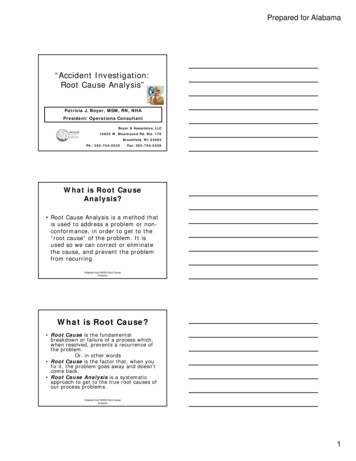
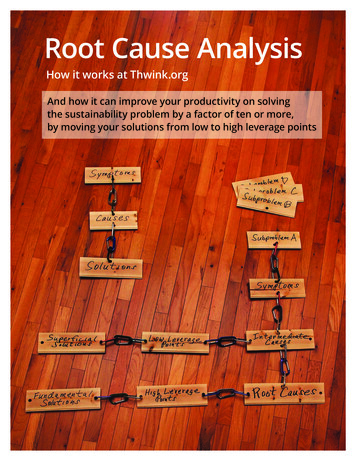
Bayesian Network Suppose that there are two events which couldcause grass to be wet: either the sprinkler is on or it's raining. Also, suppose that the rain has a direct effect onthe use of the sprinkler (namely that when itrains, the sprinkler is usually not turned on). Then the situation can be modeled with theadjacent Bayesian network. All three variables have two possible values T(for true) and F (for false).Ghinassi / WPIC / UPMC / Univ ofPittsburgh / 2009
Bayesian Network The model can answer questions like"What is the probability that it is raining,given the grass is wet?" by using theconditional probability formula andsumming over all nuisance variables Because a Bayesian network is acomplete model for the variables and theirrelationships, it can be used to answerprobabilistic queries about them.Ghinassi / WPIC / UPMC / Univ ofPittsburgh / 2009
Ghinassi / WPIC / UPMC / Univ ofPittsburgh / 2009
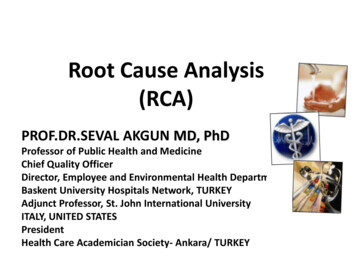
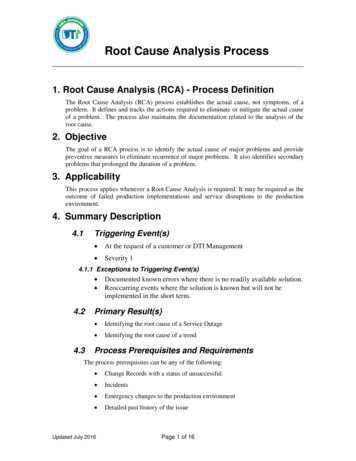
Bayesian Network Reverse PredictionsThe Bayesian network can also be used to calculate the probability of observing acause given an effect has occurredThis is the reverse of how most people think about causes and effectsMost people start with a cause and want to predict the probability of the effectBayesian probability models allow us to do the reverseOne can start with known sentinel events and ask about the prevalence of aparticular cause among themSince causes are not as rare as sentinel events, this procedure allows us to check onthe adequacy of the analysis without having to wait a long time for reoccurrence ofthe sentinel eventTo make matters easier, the Joint Commission on Accreditation of HealthcareOrganizations publishes prevalence of categories of causes among sentential eventsThese data can be used to examine the consistency of the Root Cause AnalysisLarge discrepancy between observed prevalence of causes among sentinel eventsand assumed prevalence of causes in the investigative team's model suggest errorsin assignments of probabilities as well as possible missed cause or constraint.Ghinassi / WPIC / UPMC / Univ ofPittsburgh / 2009
Root Cause AnalysisGhinassi / WPIC / UPMC / Univ ofPittsburgh / 2009
Root Cause Analysis DiscussionInvestigative teams often rely on their own intuitions for listing the root causes of asentinel eventThey rarely check the validity of their analysisBayesian networks can be applied to root cause analysis to test the validity and/orconsistency of the analysisReal analysis should be a careful examination of facts and not a cover for wishfulspeculationBy creating a Bayesian Network and estimating the probabilities of various events,one can scrutinize assumptions made in root cause analysisIn particular, one can check to see––––– if important root causes have been missedif the analysis is focused on root causes or direct causesif frequency of sentinel event corresponds to expectations and experienced ratesif prevalence of causes of sentinel events correspond to known ratesand if assumptions of dependence or independence are wrong.These are not exact ways of checking the accuracy of the analysis. But thesemethods allow us to check the intuition of investigative teams and help them thinkthrough the implication of their analysis.Ghinassi / WPIC / UPMC / Univ ofPittsburgh / 2009
Ghinassi / WPIC / UPMC / Univ ofPittsburgh / 2009
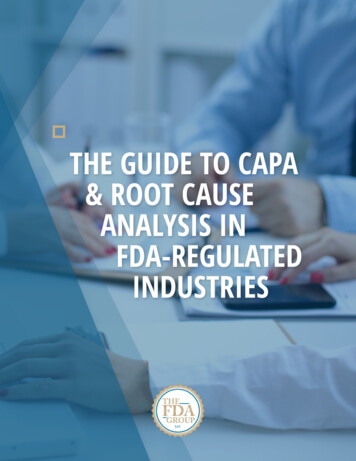
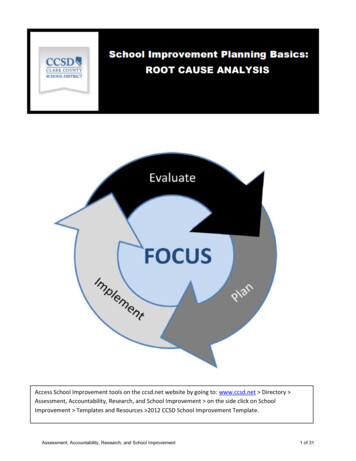
Root Cause Analysis General process for performing and documenting anRCA-based Corrective Action Notice that RCA forms the most critical part of successfulcorrective action It directs the corrective action at the root of the problem That is to say, it is effective solutions we seek, not rootcauses Root causes are secondary to the goal of prevention,and are only revealed after we decide which solutions toimplement.Ghinassi / WPIC / UPMC / Univ ofPittsburgh / 2009
Root Cause Analysis Define the problem. Gather data/evidence. Ask why and identify the causal relationships associatedwith the defined problem. Identify which causes if removed or changed will preventrecurrence. Identify effective solutions that prevent recurrence, arewithin your control, meet your goals and objectives anddo not cause other problems. Implement the recommendations. Observe the recommended solutions to ensureeffectiveness.Ghinassi / WPIC / UPMC / Univ ofPittsburgh / 2009
Root Cause Analysis 5 Whys- original root cause analysis process developed in 1958, whichprovides a fact-based approach to systematically rule out possiblecauses and identify the true causeMy car will not start. (the problem)Why? - The battery is dead. (first why)Why? - The alternator is not functioning. (second why)Why? - The alternator belt has broken. (third why)Why? - The alternator belt was well beyond its useful service life andhas never been replaced. (fourth why)Why? - I have not been maintaining my car according to therecommended service schedule. (fifth why, root cause)Ghinassi / WPIC / UPMC / Univ ofPittsburgh / 2009
Root Cause Analysis HistoryThe technique was originally developed by Sakichi Toyodalater used within Toyota Motor Corporation during the evolution oftheir manufacturing methodologiesIt is a critical component of problem solving training delivered as partof the induction into the Toyota Production SystemThe architect of the Toyota Production System, Taiichi Ohno,described the 5 whys method as ". the basis of Toyota's scientificapproach . by repeating why five times, the nature of the problemas well as its solution becomes clear.“The tool has seen widespread use beyond Toyota, and is now alsoused within Six Sigma.Ghinassi / WPIC / UPMC / Univ ofPittsburgh / 2009
Root Cause Analysis CriticismWhile the 5 Whys is a powerful tool for engineers or technically savvyindividuals to help get to the true causes of problems, it has been criticizedby Teruyuki Minoura, former managing director of global purchasing forToyota, as being too basic a tool to analyze root causes to the depth that isneeded to ensure that the causes are fixed. Reasons for this criticisminclude:– Tendency for investigators to stop at symptoms rather than going on to lowerlevel root causes– Inability to go beyond the investigator's current knowledge - can't find causes thatthey don't already know– Lack of support to help the investigator to ask the right "why" questions– Results aren't repeatable - different people using 5 Whys come up with differentcauses for the same problem– These can be significant problems when the method is applied through deductiononly– On-the-spot verification of the answer to the current "why" question, beforeproceeding to the next, is recommended as a good practice to avoid these issuesGhinassi / WPIC / UPMC / Univ ofPittsburgh / 2009
Root Cause Analysis Failure mode and effects analysis Also known asFMEA:– procedure for analysis of potential failure modeswithin a system for classification by severity ordetermination of the effect of failures on the system– It is widely used in manufacturing industries in variousphases of the product life cycle and is nowincreasingly finding use in the service industry– Failure causes are any errors or defects in process,design, or item, especially those that affect thecustomer, and can be potential or actual– Effects analysis refers to studying the consequencesof those failures.Ghinassi / WPIC / UPMC / Univ ofPittsburgh / 2009
Root Cause Analysis Step 1: SeverityStep 2: OccurrenceStep 3: DetectionRisk Priority Numbers– RPN S x O x DGhinassi / WPIC / UPMC / Univ ofPittsburgh / 2009
Root Cause Analysis LimitationsSince FMEA is effectively dependent on the members of the committee whichexamines product failures, it is limited by their experienceIf a failure mode cannot be identified, then external help is neededIf used as a top-down tool, FMEA may only identify major failure modes in a systemFault tree analysis (FTA) is better suited for "top-down" analysisWhen used as a "bottom-up" tool FMEA can augment or complement FTA andidentify many more causes and failure modes resulting in top-level symptomsIt is not able to discover complex failure modes involving multiple failures within asubsystem, or to report expected failure intervals of particular failure modes up to theupper level subsystem or systemAdditionally, the multiplication of the severity, occurrence and detection rankings mayresult in rank reversals, where a less serious failure mode receives a higher RPNthan a more serious failure modeThe reason for this is that the rankings are ordinal scale numbers, and multiplicationis not a valid operation on themThe ordinal rankings only say that one ranking is better or worse than another, butnot by how muchGhinassi / WPIC / UPMC / Univ ofPittsburgh / 2009
Root Cause Analysis Causal factor tree analysis - a technique based on displaying causalfactors in a tree-structure such that cause-effect dependencies areclearly identified– Another technique, where each event is enclosed in a rectangle. Aseries of Events are enclosed in rectangles with lines inter connectingthe rectangles. Events progress from Left to Right, just like in a text.Striking of a match Stick is an event. If there is possibility of theinterconnection the rectangles are connected with the dotted lines– The 'Cause' are identified for each event. In order to differentiate theCause with Events, Cause are enclosed in Ellipse– The 'Presence of inflammable Gases' can be a 'Cause'. Both 'Event'and 'Cause' put together may lead to the accident e.g. 'Explosion‘’– A structured root cause analysis system built around a problem solvingprocess with six embedded techniques to guide investigators beyondtheir current knowledge to the root causes of human performance andequipment failure related incidentsGhinassi / WPIC / UPMC / Univ ofPittsburgh / 2009
Root Cause Analysis Basic elements of root causeMaterials– Defective raw material– Wrong type for job– Lack of raw material Machine/Equipment–––– Incorrect tool selectionPoor maintenance or designPoor equipment or tool placementDefective equipment or toolEnvironment–––––Orderly workplaceJob design or layout of workSurfaces poorly maintainedPhysical demands of the taskForces of natureGhinassi / WPIC / UPMC / Univ ofPittsburgh / 2009
Root Cause Analysis Management–––––– No or poor management involvementInattention to taskTask hazards not guarded properlyOther (horseplay, inattention.)Stress demandsLack of ProcessMethods– No or poor procedures– Practices are not the same as written procedures– Poor communication Management system––––Training or education lackingPoor employee involvementPoor recognition of hazardPreviously identified hazards were not eliminatedGhinassi / WPIC / UPMC / Univ ofPittsburgh / 2009
Root Cause Analysis Summary of Proposed Method for Root Cause analysisSentinel events can be reduced if health care organization create ablame-free environment, conduct Root Cause Analysis and takeconcrete actions on the basis of the analysis. To conduct root causeanalysis we propose the following steps:– Before a sentinel event occurs, an investigative team is organized– The team should include a facilitator and a team leader– The facilitator's responsibility is to organize tasks, serve as staff to theteam, and conduct team meetings in an efficient and effective method– The facilitator should be trained in probability models– The leader's responsibility is to make sure that the investigation iscarried out thoroughly and to provide content expertise.Ghinassi / WPIC / UPMC / Univ ofPittsburgh / 2009
Root Cause Analysis When a sentinel event is reported, the employees closest to the incident areasked to record facts (not accusations) about the event, including:––––– what happenedwho was presentwhere did the event occurwhen did it occurand what was the time sequence of the events that preceded the sentinel event.The investigative team meets and brainstorms:– (1) potential causes for the incident– (2) key constraints that if they were in place would have prevented the incidentfrom occurring Two steps are taken to make sure the listing is comprehensive– First, the framing bias is reduced by asking for a list of causes with alternativeprompts– Thus, since constraints can be thought of reverse causes, the team should beasked to list both the constraints and causes– Furthermore, because the team is focused on conditions that led to the sentinelevent, they should be asked to examine also conditions that prevented sentinelevents in other occasions.Ghinassi / WPIC / UPMC / Univ ofPittsburgh / 2009
Root Cause Analysis The facilitator interviews the investigative team or uses existing datato assign a probability to each cause and a conditional probability foreach effect.The facilitator checks the accuracy of the causal model and asks theinvestigative team to revise their modelThe following steps allows one to check the accuracy or consistencyof the causal model:– The facilitator uses the model to predict the probability of the sentinelevent– If this probability is several magnitudes higher than historical pattern orinvestigative team's intuitions, the facilitator seeks additional constraintsthat would reduce the probability of the sentinel event– If the probability is lower than historical experience or the investigativeteam's intuitions, the team is asked to describe additional mechanismsand causes that may lead to the sentinel event.Ghinassi / WPIC / UPMC / Univ ofPittsburgh / 2009
Root Cause Analysis Predictions from Root CausesThe causal model behind the root cause analysis can be used topredict the probability of the sentinel event and this probability canthen be compared to the intuitions of the investigative teamThe probability of sentinel event can be calculated from each of thedirect causes and the probability of direct causes can be calculatedfrom their root causes.p (Sentinel event, Various causes) p (Sentinel event Direct causes) * p (Direct causes Direct rootcauses) * p (Root causes)To calculate, the probability of sentinel event, S, given a set ofdifferent unobserved (CU) and observed causes (Ci), we can usethe following formula:Ghinassi / WPIC / UPMC / Univ ofPittsburgh / 2009
Root Cause Analysis Obviously, estimates of probabilities from experts is subjective andtherefore may be unreliableBut if experts are provided with tools (calculators, paper, pencils),brief training in concept of conditional probabilities, availableobjective data (e.g. JCAHO's reports on prevalence of variouscauses)and if experts are allowed to discuss their different estimates, thenexperts' estimates are sufficiently accurate and reliable to provide auseful modelThese probabilities may not be accurate to the last digit, but canprovide for a test of consistencyGhinassi / WPIC / UPMC / Univ ofPittsburgh / 2009
Root Cause Analysis The facilitator uses the model to calculate the prevalence of thecauses among sentinel eventsThese data are checked against the investigative team's intuitionsas well as against observed rates published by the JCAHO.– The facilitator checks that claimed root causes areconditionally independent from the sentinel event– If a root cause is directly linked to the sentinel event, the investigativeteam is asked to redefine the direct cause to be specific to themechanism used by the root cause to affect the sentinel event– If few root causes have been specified, the investigative team is askedto think again through reasons why direct causes occur.– The facilitator checks the marginal probabilities against objective data– If the probabilities do not match, the facilitator should use the objectiveprobabilities whenever available.Ghinassi / WPIC / UPMC / Univ ofPittsburgh / 2009
Root Cause Analysis Document the findings A chart is organized showing all the nodesand arcs The root causes, direct causes andsentinel events are shown in the chart Arrows are drawn from root causes todirect causes and from direct causes tosentinel events.Ghinassi / WPIC / UPMC / Univ ofPittsburgh / 2009
Root Cause Analysis Question: How do you really classify a cause as a directcause as opposed to an indirect cause? Can there beinstances where an indirect cause can be an directcause as well depending how one interprets theanalysis? Answer: Here lies the art of the analysis. A direct causeshows a mechanism that affects the target event in closephysical proximity and with few steps, cigarettes are adirect cause of lung cancer because we see how smokeaffects the lung. An indirect cause is something thatdoes not have a physical link to the target event.Advertisement for cigarettes directed at children may beconsidered an indirect cause, as it affects the uptake ofsmoking but it does not affect the lung itself directly.Ghinassi / WPIC / UPMC / Univ ofPittsburgh / 2009
Root Cause Analysis Question: What would be a simple way toidentify the direct cause from the root cause? Answer: A direct cause often has a physical linkto the event of interest. An indirect cause doesnot. Direct causes can be established by askingquestions on what happened, when it happenedand where it happened. An indirect cause ismore likely to be a more systemic and removedfrom immediate events surrounding the adverseevent.Ghinassi / WPIC / UPMC / Univ ofPittsburgh / 2009
Root Cause Analysis Question: Is there a limit to how manyroot causes there can be? Answer: No and yes. There is notheoretical limit but experience with peopleshows that most people list at most 3-5causes for a phenomena.Ghinassi / WPIC / UPMC / Univ ofPittsburgh / 2009
Questions and DiscussionGhinassi / WPIC / UPMC / Univ ofPittsburgh / 2009
Root Cause Analysis Vincent, Charles. Patient Safety: Understanding and Responding to Adverse Events.New England Journal of Medicine. 348(11):1051-1056, March 13, 2003. 1051-1056,March 13, 2003. This article is an excellent overview of the field.Spath PL. Using failure mode and effects analysis to improve patient safety. AORN J.2003 Jul; 78(1): 16-37. Accession number: 00000703-200307000-00004. (Fromthe abstract) This article introduces the concept of failure mode and effects analysis(FMEA) or prospective risk analysis and its utility in evaluating system safety in order“to improve the safety of patient care activities.” “The steps of the FMEA process aredescribed and applied to a high-risk perioperative process.”Dunn D. Incident reports--correcting processes and reducing errors. AORN J. 2003Aug;78(2):212, 214-6, 219-20. Accession number: 00000703-20030800000006 (From the abstract) “This article describes systems approaches to assessingthe ways in which an organization operates and explains the types of failures thatcause errors. The steps that guide managers in adapting an incident reporting systemthat incorporates continuous quality improvement are identified.”Fischoff, B., Slovic, P. & Lichtenstein, S., (1978), "Fault Trees: Sensitivity ofEstimated Failure Probabilities to Problem Representation." Journal of ExperimentalPsychology: Human Perception and Performance, 4, pp 330 - 334. An article thatshows how expert mechanics are influenced by the fault tree for why a car will notstart up.Ghinassi / WPIC / UPMC / Univ ofPittsburgh / 2009
Root Cause Analysis Root cause analysis techniques Simplest technique out of all the RCA Techniques For every effect there is a . Root cause analysis is not a single, sharply defined methodology there are many different tools, processes, and philosophies of RCA in existence However, most of these can be classed into five,