Transcription
CARBFinal ReportQuantifying Methane Emissions from Natural GasResidential Customer Meters in CaliforniaARB Agreement Number: 15ISD023GTI Project No. 22049Principal InvestigatorMichael Adamo, ject ManagerKristine or,California Air Resources Board (CARB),California Environmental Protection AgencySacramento, CA 95814By,Gas Technology Institute1700 S. Mount Prospect Road,Des Plaines, IL 60018May, 2020
Final ReportQuantifying Methane Emissions from Residential Customer Meters in CaliforniaDisclaimerThe statements and conclusions in this Report are those of the contractor and not necessarily those ofthe California Air Resources Board. The mention of commercial products, their source, or their use inconnection with material reported herein is not to be construed as actual or implied endorsement ofsuch products.ii
Final ReportQuantifying Methane Emissions from Residential Customer Meters in CaliforniaAcknowledgementThe information gathered in this report could not have been completed without cooperation andsupport of several organizations within the state of California. Those companies include SouthernCalifornia Gas Company, Pacific Gas and Electric, and San Diego Gas and Electric.This Report was submitted in fulfillment of ARB Agreement Number 15ISD023 - Quantifying MethaneEmissions from Residential Customer Meters in California] under the sponsorship of the California AirResources Board. Work was completed as of 3/31/18.iii
Final ReportQuantifying Methane Emissions from Residential Customer Meters in CaliforniaLegal NoticeThis information was prepared by Gas Technology Institute (“GTI”) for the California Air Resources Board.Neither GTI, the members of GTI, the Sponsor(s), nor any person acting on behalf of any of them:a. Makes any warranty or representation, express or implied with respect to the accuracy, completeness,or usefulness of the information contained in this report, or that the use of any information, apparatus,method, or process disclosed in this report may not infringe privately-owned rights. Inasmuch as thisproject is experimental in nature, the technical information, results, or conclusions cannot be predicted.Conclusions and analysis of results by GTI represent GTI's opinion based on inferences frommeasurements and empirical relationships, which inferences and assumptions are not infallible, and withrespect to which competent specialists may differ.b. Assumes any liability with respect to the use of, or for any and all damages resulting from the use of,any information, apparatus, method, or process disclosed in this report; any other use of, or reliance on,this report by any third party is at the third party's sole risk.c. The results within this report relate only to the items tested.iv
Final ReportQuantifying Methane Emissions from Residential Customer Meters in CaliforniaTable of ContentsDisclaimer. iiAcknowledgement . iiiLegal Notice. ivTable of Contents . vTable of Figures . viiList of Tables . viiiAbstract . 1Executive Summary. 1Objective . 2Background . 3Measurements of Methane Emissions from Residential Meters- Methodology . 4Sampling Methodology Design . 4Leak Survey and Measurement Methodology . 6Hi-Flow Sampler from Bacharach Inc. . 7Los Gatos Research Ultraportable Greenhouse Gas Analyzer . 8Field Measurement Procedures. 9Summary of Field Tests . 11SoCal Field Tests. 11SDG&E Field Tests . 11PG&E Field Tests . 11Results . 12Analysis and Discussion. 12Coastal vs. Non-Coastal MSAs. 15Soap Leak Test. 19Leak Rates by Company . 21MSAs Component Analysis . 25Comparison to the 2009 OTD Study . 28Conclusions . 29Recommendations . 30Appendix A – GTI Data . 31GTI Field Data . 31v
Final ReportQuantifying Methane Emissions from Residential Customer Meters in CaliforniaList of Acronyms . 34Gas Volume Units. 35Gas Weight Units . 35English to Metric Units Conversions . 36Weight Units . 36Pressure units. 36References . 37vi
Final ReportQuantifying Methane Emissions from Residential Customer Meters in CaliforniaTable of FiguresFigure 1 – Typical Single-Family MSA. 4Figure 2 – CA Gas Utilities - Service Territories. 5Figure 3 – Sensit G2 Gold . 6Figure 4 – View of the Hi Flow Sampler device. 7Figure 5 – LGR-UGGA Methane Analyzer and Battery Pack . 8Figure 6 – The CGI used to identify the leak . 9Figure 7 – Example of Soap Bubbles on Leaking Valve . 10Figure 8 – Example of meter measurements with the Hi-Flow device and LGR-UGGA . 10Figure 9 – Leak Rate by Utility Company – Bubbles, No Bubbles, and Combined Data . 13Figure 10 – Histogram and Density Plot Overlay of Mean Leak Rate . 14Figure 11 – AOV Difference of Means in Mean Leak Rate (SCFM) Across Company “Family” . 15Figure 12 – Comparison of Leak Rate by Region. 16Figure 13 – Histogram and Density Plot Overlay of Difference in Means for Leak Rates. 18Figure 14 – Leak Rates for All Companies – Coastal vs. Non-Coastal . 19Figure 15 – Leak Rate for All Companies by Presence of Leak Test Bubbles . 20Figure 16 – Leak Rate by Company . 22Figure 17 – Leak Rate by Company – Bubbles vs. No Bubbles. 23Figure 18 – Leak Rate by Company – Bubbles vs. No Bubbles – Coastal vs. Non-Coastal . 24Figure 19 – Scatter Plot of Leak Rates by Company – Bubble vs. No Bubble . 25Figure 20 – Total Number of Installed Components and Number of Leaking Components . 26Figure 21 – Percent of Installed Components that Leaked . 27vii
Final ReportQuantifying Methane Emissions from Residential Customer Meters in CaliforniaList of TablesTable 1 – Percentage of Coastal MSA by Company . 6Table 2 – MSA Leaks by Utility Company . 11Table 3 – Bootstrap Analysis of Leak Data . 13Table 4 – Frequency of Leak Indication – Coastal vs. Non-Coastal . 16Table 5 –Mean Leak Rate – Coastal vs Non-Coastal MSAs . 17Table 6 – K-S Test of Difference of Means – Coastal vs. Non-Coastal Leaks . 18Table 7 – Contribution to Measured Emissions: Bubbles vs. No Bubbles . 21Table 8 – Residential Meter Survey Results and Emission Factors – OTD 2009 Study . 28Table 9 – Residential Meter Survey Results and Emission Factor - This study . 29Table 10 – GTI Field Data – Leak Rate Measurements . 31viii
Final ReportQuantifying Methane Emissions from Residential Meters in CaliforniaAbstractThis study examines methane emissions from natural gas residential customer meters within the state ofCalifornia (CA). Natural gas, which is comprised of mostly methane, leaks from various components of aresidential meter set assembly (MSA). The objective of the project was to evaluate and measure fugitivemethane emissions from residential MSAs across the state. The project determined the proportion of MSAswith leaks and identified the leaking component. The project also investigated differences in the frequency andsize of leaks on MSAs between coastal and non-coastal regions. This project is expected to provide additionalinformation to improve the accuracy of the reporting of total emissions for natural gas local distributioncompanies.Executive SummaryMethane emissions from natural gas pipelines continue to be a topic of interest to federal, state, and localorganizations. Accurately quantifying fugitive emissions from natural gas pipelines will assist in understandingtotal greenhouse gas (GHG) emissions to the atmosphere, and development of plans and regulations to reducethose emissions in the future. The main objective of this project was to quantify fugitive emissions from naturalgas residential meter set assemblies (MSAs) in California. A study completed in 2009 by Operations TechnologyDevelopment (OTD) looked at emissions from residential MSAs on a national level. Since that study wascompleted, new equipment has been developed that enables a more precise measurement of leak flow rates.To quantify fugitive methane emissions from residential MSAs, field visits with the three largest utilities withinthe state of California were conducted. Those companies are Southern California Gas Company (SoCal Gas),Pacific Gas and Electric (PG&E), and San Diego Gas and Electric (SDG&E). The target sample size of MSAs tosurvey was 500 randomly selected from the three utilities, as follows: 200 MSAs from each SoCal Gas and PG&E,plus another 100 MSAs from SDG&E. This study focused only on single family residential MSAs and did notcapture multifamily MSAs. Additionally, this study did not attempt to quantify vented emissions from MSAregulators. Those emissions are intentional and occur when the gas pressure exceeds a certain threshold.A combustible gas indicator (CGI) was used to identify leaks at each MSA. Only utility-owned components wereincluded in the MSA survey. This included components from the top of the service riser to the first fitting,usually a tee connection, beyond the outlet of the meter. All the various components that make up the MSAwere counted, and leak locations were recorded.This study defined a “leak indication” as a reading of greater than 100 parts per million (ppm) on the CGI. A“soap test” was performed on all leak indications. Utility companies classify a leak on MSAs based on theformation of a bubble using a soap test. A soap solution was sprayed onto all the MSA components with leakindications, and the presence of soap bubbles was recorded. The team quantified emissions from both leaksthat showed bubbles, as well as those that only showed indications greater than 100 ppm on the CGI, but didnot bubble.The only stratification of the sample set was to examine any difference in leak occurrence or severity on MSAsthat were in proximity to coastal waters. The hypothesis being that proximity to salt water may increase thelikelihood of atmospheric corrosion which could increase the likelihood or severity of leaks. To accomplish thistask, the sample population was split into coastal and non-coastal MSAs (inland). The team surveyed the1
Final ReportQuantifying Methane Emissions from Residential Meters in Californiarespective percentage of MSAs that each company had within the boundary of coastal areas as defined by theCalifornia Coastal Commission’s zoning. The data collected showed that there was not an increased number orseverity of leaks within the coastal versus non-coastal zones. Sixteen percent of the MSAs surveyed in thecoastal zone had leak indications with a mean leak rate of 3.68E-05 versus 35% in the non-coastal zone with amean leak rate of 9.18E-05.Component counts for each MSA were recorded within this study. Each leaking component was identified andrecorded. Components included: elbows, tees, caps, plugs, meters, regulators, bushings, flanges, couplings,unions, and valves. Plastic bushings were found to be nearly four times as likely to leak as any other fitting on anMSA. Of the 500 MSAs surveyed, 166 leak indications were found, or 33% of the sample size. Ninety-four of the166 leak indications were measured to determine the average leak rate. A bootstrap statistical analysis is anestimation of the sampling distribution using a random sampling method of themeasured leak rates. The entireleak measurement data were used to perform the analysis, with sample replacement. The bootstrapped meanleak rate was 8.65E-05 standard cubic feet per minute (SCFM) with 1.24E-04 SCFM 95% upper confidence limit(UCL) and 5.46E-05 SCFM 5% lower confidence limit (LCL).The fugitive methane emissions from residential MSAs within this project were compared to the results of the2009 OTD study. However, this is not a direct comparison; as the 2009 study was at the national level andincluded multifamily MSAs, some vented emissions, and did not utilize the same equipment and detectionthresholds as in this study. The emission factor developed in the 2009 study was 2.08 lb CH4/meter-year. Theemission factor for this study is 0.64 lb CH4/meter-year, which represents a considerable reduction.Consideration should be given into further studying emissions from multifamily MSAs as well as ventedemissions to provide a more direct comparison.ObjectiveThe objective of the project was to quantify fugitive methane emissions from natural gas residential customermeters in CA. The project focused on conducting field measurements to gain an improved understanding ofmethane emissions from residential customer meters. The project developed and validated a field method toplan, conduct, and analyze measurements of fugitive methane leaks at randomly selected sites from varioustypes of customer meters used in the CA gas distribution system.2
Final ReportQuantifying Methane Emissions from Residential Meters in CaliforniaBackgroundMethane emissions from residential MSAs is one of the major contributors of total methane emissions for LocalGas Distribution Companies (LDCs). Current emission factors for these sources are based on the 1996 GRI/EPAstudy1. Due to the growing concern over climate change and the reduction of GHG emissions, federal and stateorganizations and LDCs have recognized the need for updated and more accurate emission estimationmethodologies.A study2 in 2009 sponsored by Operations Technology Developed (OTD) measured leaks from residential,commercial and industrial customer meters from utility sites across the U.S. The OTD study surveyed 2,400residential MSAs (single and multi-family) nationwide to develop the EF.All the residential MSAs that were surveyed in the 2009 OTD study were diaphragm meters with a maximumflowrate usually below 300 standard cubic feet per hour (SCFH). For that study, a variety of different MSA typesand manufacturers were found. The most common type was the American AC250, but many othermanufacturers and models were included. Some reconditioned MSAs were also surveyed. No difference in leakrates was found from the reconditioned MSAs.In the previous study it should be noted that no residential MSAs were found with a leak from the meter body.The most common place for a leak to occur on residential MSAs was on the threaded connections on the riser.Leaks were also found on other threaded connections on the MSA.In addition to the 2009 study stated above, there have been several studies commissioned by OTD3 and theEnvironmental Defense Fund4 that have collected leak rate measurements in the field to improve methaneemission estimates for the distribution sector.Most of these studies have focused on the largest sources of emissions such as pipelines. GTI recentlycompleted a project for CARB that quantified fugitive methane emissions from natural gas distribution pipelinesin CA. While individual leaks from residential customer MSAs tend to be small in comparison to other sources,with so many MSAs located within CA, the overall quantity of emissions could be significant. A fieldmeasurement study is needed to quantify methane emissions from MSAs in CA.1 GRI/EPA. 1996. Methane Emissions from the Natural Gas Industry, Volume 9: Underground pipelines. GRI/EPA.2 Field Measurement Program to Improve Uncertainties for Key GHG Emission Factors for Distribution Sources, OTD-100002, November 20093 Farrag, Khalid, and Kristine Wiley. 2013. Improving Methane Emission Estimates for Natural Gas Distribution Companies,Phase II - PE Pipes. Des Plaines: Operations Technology Development.4 Brian K. Lamb, Steven L. Edburg, Thomas W. Ferrara, Touche Howard, Matthew R. Harrison, Charles E. Kolb, AmyTownsend-Small, Wesley Dyck, Antonio Possolo, James R. Whetstone. 2015. Direct Measurements Show DecreasingMethane Emissions from Natural Gas Local Distribution Systems in United States. ACS Publications.3
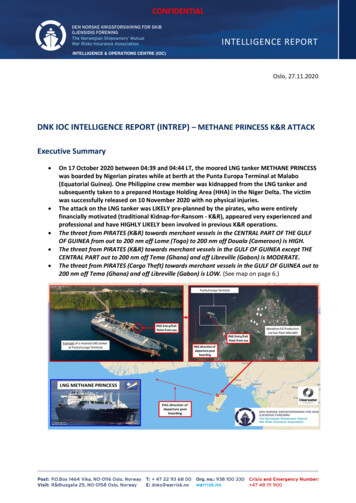
Final ReportQuantifying Methane Emissions from Residential Meters in CaliforniaMeasurements of Methane Emissions from Residential MetersMethodologySampling Methodology DesignGTI designed a sampling plan that would allow for random selection of MSAs that maximized the number ofsamples that could be collected within the scope of the project. Initially, the plan was to select a randomsample from all the residential customers of within SoCal Gas, PG&E, and SDG&E jurisdictions. After discussionwith CARB and the utilities at the outset of the project, it was decided that it was best to focus the efforts ononly single-family MSAs, as it would be challenging to account for the variations in the MSA for multifamily unitswithin the budget of the project. Figure 1 shows a sketch of the typical MSA found at single family residentialhomes.Figure 1 – Typical Single-Family MSA4
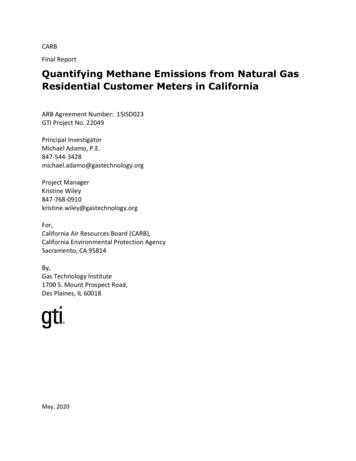
Final ReportQuantifying Methane Emissions from Residential Meters in CaliforniaThe target number of MSAs to include in the survey was 500 meters. GTI randomly surveyed 200 MSAs in SoCalGas territory, 200 MSAs in PG&E’s territory, and 100 MSAs in SDG&E’s territory. Figure 2 below shows thelocation of each company’s service territory.Figure 2 – CA Gas Utilities - Service TerritoriesGTI discussed the possibility of stratifying the sample set based on different parameters that may have animpact on the frequency or likelihood of occurrence of leaks. As such, we considered the possibility ofstratifying the sample set based on age of the meter, meter manufacturer, and proximity to coastal waters.While the data may exist on the age of a meter itself, it is not necessarily indicative or representative of anymaintenance that may have taken place on the meter set assembly. Over time, parts are changed out ormaintained for a variety of reasons. As a result, meter age was not included in the stratification. Metermanufacturers were not included in the stratification either, as the previous 2009 OTD Study did not indicate avariation in the leakage between manufacturers from the body of the meters themselves and in fact showed noleaks from the meter bodies. As a result, it was decided to only stratify the sample set based on proximity tocoastal waters. The hypothesis being that meter sets near salt water may be more prone to atmosphericcorrosion and have a potentially higher leak rate. To do so, each utility company provided GTI with the5
Final ReportQuantifying Methane Emissions from Residential Meters in Californiapercentage of meters that were located within the coastal boundary as defined by the California CoastalCommission’s zoning5. Table 1 below shows the percentage of MSAs located within the coastal zone by utility.Table 1 – Percentage of Coastal MSA by CompanyCompanyPercentage of Coastal MSAsTarget # of Coastal MSAsPG&ESoCal GasSDG&E21%2.39%11.14%421011Field data collection took place within the territory for each company. To maximize the number of MSAssurveyed, a zip code was randomly selected for each day of sampling. Within that zip code, an address wasrandomly selected as a starting point to begin the leak survey. The team then surveyed MSAs within proximity toeach starting point.Leak Survey and Measurement MethodologyTo conduct the leak survey, a CGI device, commonly used by gas utilities for leak detection, the Sensit G2 Gold(see Figure 3) was used. This device provides readings in parts per million. GTI surveyed the entire MSA forleaks (excluding vented emissions). For this project, the MSA was only surveyed on the components that wereowned by the utility company, which included all components from the top of the riser, to the first fittingbeyond the outlet of the meter. The remaining components that were considered “customer owned”,specifically those beyond the first fitting after the outlet of the meter, were not included in the survey.Additionally, it should also be noted that this study did not attempt to quantify or measure vented emissionsfrom regulators. Vented emissions happen irregularly and by design. As a result, the regulator vent was neverenclosed during the leak flow rate measurements. Leaks that existed at threaded connections or other locationson the regulator were captured.Figure 3 – Sensit G2 Gold5 California Coastal Commission, Retrieved: https://www.coastal.ca.gov/maps/czb/6
Final ReportQuantifying Methane Emissions from Residential Meters in CaliforniaGTI made component counts for each MSA. This information was collected to see what components were foundto be leaking. This information included: elbows, tees, caps, plugs, meters, regulators, bushings, flanges,couplings, unions, and valves.To conduct the leak flow rate measurements, GTI used a combination of the Hi-Flow Sampler and a cavity-basedmethane analyzer (Ultraportable Greenhouse Gas Analyzer, Los Gatos Research, San Jose, CA; LGR-UGGA). Eachof these devices and the method in which they were used are described below.Hi-Flow Sampler from Bacharach Inc.The Hi-Flow Sampler (Bacharach, Inc, New Kensington, PA) is a portable, intrinsically safe, battery-poweredinstrument designed to determine the natural gas (CH4) leak rate around various components such as pipefittings, valve packings, and compressor seals found in natural gas systems. The Hi Flow Sampler samples at ahigh flow rate to capture all of the gas leaking from the component being examined along with surrounding airand the gas leak rate is calculated using Equation 1. The instrument automatically compensates for differentspecific gravity values of air and natural gas to accurately calculate methane flow rate (Bacharach 2015). For thepurposes of this study, all of the samples collected were below the detection limits of the methane sensorwithin the device. The project team recorded the flow rate of the sample as measured by the Hi-Flow Sampler,but utilized the LGR-UGGA for the measurement of the methane concentration.Leak Flow x (Gas sample – Gas background) x 10–2where:Leak rate of gas leakage from source (scfm)Flow sample flow rate (scfm)Gas sample concentration of gas from leak source (%)Gas background background gas concentration (%)Figure 4 – View of the Hi Flow Sampler device7Eq. 1
Final ReportQuantifying Methane Emissions from Residential Meters in CaliforniaLos Gatos Research Ultraportable Greenhouse Gas AnalyzerThe recent concerns being raised about the ability of the Hi Flow sampler to properly measure CH4concentrations and the relatively high detection limit of the sampler has led GTI to pair sensitive analyzers withthe Hi-Flow sampler to more precisely determine the concentrations for leak flow rate determination. Theinstrument that GTI used in-line with the Hi Flow sampler to measure concentrations is the LGR-UGGA. The LGRUGGA is a high speed/high sensitivity instrument that uses off-axis integrated cavity output spectroscopy. Theinstrument is capable of parts-per-billion precision and across a wide range of concentrations (0 -100,000 ppm).The analyzer was checked using CH4 calibration gases between 15 ppm to 2.5% volume CH4 in the lab prior todeployment. The use of the LGR-UGGA will provide greater insight into the flow rates for very small leaks.For leaks that were below the concentration detection limit of the Hi Flow sampler, which in this study, was allof them, the concentrations from LGR-UGGA were used to calculate the flow rate with the following equation:Leak Flow x (Gas sample – Gas background) x 10–6where:Leak rate of gas leakage from source (scfm)Flow sample flow rate (scfm)Gas sample concentration of gas from leak source (ppm)Gas background
gas residential meter set assemblies (MSAs) in California. A study completed in 2009 by Operations Technology . (SoCal Gas), Pacific Gas and Electric (PG&E), and San Diego Gas and Electric (SDG&E). The target sample size of MSAs to survey was 500 randomly selected from the three utilities, as follows: 200 MSAs from each SoCal Gas and PG&E,