Transcription
An Interactive Qualifying Project ReportONCollege Program RankingsIQP-CEW-1502Submitted to the Faculty ofWORCESTER POLYTECHNICINSTITUTEIn Partial Fulfillment of the Requirement fortheDegree of Bachelor of SciencebySam AbradiChristopher NotaPenny OverTung TonUNDER THE GUIDANCE OFProfessor Craig E. WillsFriday 13th March, 2015
AbstractThis report analyzes current methods of ranking college programs, and compares them to the preferences of students, educators, employers, and otherindividuals. Ranking sources are located and classified by the ranking criteria used. A survey is conducted of the general population that determinesattitudes towards various ranking criteria. The paper concludes with a comparison between attitudes of survey respondents and the actual criteria usedby ranking sources.
Contents1 Introduction1.1 Problem Statement . . . . . .1.2 Motivation . . . . . . . . . . .1.2.1 College Rankings . . .1.2.2 Importance of Program1.2.3 Past Projects . . . . .1.3 Project Goals and Approach .1.3.1 Goals . . . . . . . . . .1.3.2 Ranking Categories . .1.3.3 Subject Areas . . . . .1.4 Road Map . . . . . . . . . . . . . . . . . . . . . . . . . .Rankings. . . . . . . . . . . . . . . . . . . . . . . . . . . . . . .8899111212121314142 Background162.1 Early College Rankings . . . . . . . . . . . . . . . . . . . . . . 162.2 Previous IQP Work . . . . . . . . . . . . . . . . . . . . . . . . 172.3 Summary . . . . . . . . . . . . . . . . . . . . . . . . . . . . . 173 Identifying Available Rankings3.1 Finding Ranking Sites . . . .3.2 Subject Areas . . . . . . . . .3.3 Results of Ranking Searches .3.4 Summary . . . . . . . . . . .4 Classifying Available Rankings4.1 Methodology . . . . . . . . . . . . . . .4.1.1 Ranking Categories . . . . . . . .4.1.2 Data Source . . . . . . . . . . . .4.1.3 College-wide vs. Program Specific1.1919192020.2424242526
164.174.1.4 Weights . . . . . . . . . . . .US News . . . . . . . . . . . . . . . .CollegeFactual . . . . . . . . . . . . .National Research Council RankingsShanghai Rankings . . . . . . . . . .QS . . . . . . . . . . . . . . . . . . .GraduatePrograms . . . . . . . . . .CollegeXpress . . . . . . . . . . . . .Business Insider . . . . . . . . . . . .Bloomberg Business Week . . . . . .Forbes . . . . . . . . . . . . . . . . .Payscale . . . . . . . . . . . . . . . .Best Value Schools . . . . . . . . . .Princeton Review . . . . . . . . . . .Animation Career Review . . . . . .Super Scholar . . . . . . . . . . . . .Summary . . . . . . . . . . . . . . .5 Examination of Available Rankings5.1 Weights by Ranking Site by Category . . . . . . . .5.2 Weights by Ranking Site by Data Source . . . . . .5.3 Weights by Category by Subject Area . . . . . . . .5.4 Weights by Category by Graduate/ Undergraduate5.5 Weights by College-Wide/Program-Specific Data . .5.6 Summary . . . . . . . . . . . . . . . . . . . . . . .6 Survey6.1 Motivation . . . . . . . . . . .6.2 Design . . . . . . . . . . . . .6.2.1 Goals . . . . . . . . . .6.2.2 Research Questions . .6.2.3 Distribution . . . . . .6.3 Survey Breakdown . . . . . .6.3.1 Academic Background6.3.2 Program Evaluation .6.3.3 Demographics . . . . .6.4 Results . . . . . . . . . . . . .6.4.1 Overall Results . . . 53.545454545555555656575757
6.56.4.2 Category Ratings Across Subject Areas6.4.3 Information Sources . . . . . . . . . .6.4.4 College-Wide vs. Program-Specific . .6.4.5 Academic Backgrounds . . . . . . . . .Summary . . . . . . . . . . . . . . . . . . . .7 Analysis and Comparisons7.1 Ranking Categories . . . . . . .7.1.1 Undergraduate . . . . .7.1.2 Graduate . . . . . . . .7.1.3 Overall . . . . . . . . . .7.2 Data Sources . . . . . . . . . .7.2.1 Undergraduate . . . . .7.2.2 Graduate . . . . . . . .7.2.3 Summary . . . . . . . .7.3 Program-Specific/College-Wide7.4 Comparison to Past Results . .7.5 Summary . . . . . . . . . . . .5862666769.7171717883848486878888898 Conclusions908.1 Future Work . . . . . . . . . . . . . . . . . . . . . . . . . . . . 908.2 Summary . . . . . . . . . . . . . . . . . . . . . . . . . . . . . 90A Full-Text of Survey96B Raw results from Survey1013
List of Figures1.1A screenshot of the Department of Education College Scorecard for a particular institution, as of February 2015 /higher-education/collegescore-card) . . . . . . . . . . . . . . . . . . . . . . . . . . . . . 105.15.25.35.45.5Metric weightings employed by each ranking site. . . . . . . .Data source employed by each ranking site. . . . . . . . . . . .Average Metric Weightings for Each Subject Area. . . . . . . .Categories vs Graduate, Undergraduate, and Both. . . . . . .College-Wide vs. Program-Specific weights for ranking sources.Results across combined undergraduate and graduate subjectareas. . . . . . . . . . . . . . . . . . . . . . . . . . . . . . . .6.2 Results across undergraduate subject areas. . . . . . . . . .6.3 Results across graduate subject areas. . . . . . . . . . . . . .6.4 Results across undergrad subject areas. . . . . . . . . . . . .6.5 Normalized results across undergrad subject areas. . . . . . .6.6 Results across grad subject areas. . . . . . . . . . . . . . . .6.7 Normalized results across grad subject areas. . . . . . . . . .6.8 Results across subject areas. . . . . . . . . . . . . . . . . . .6.9 Results across undergraduate subject areas by level of education achieved . . . . . . . . . . . . . . . . . . . . . . . . . .6.10 Results across graduate subject areas by level of educationachieved . . . . . . . . . . . . . . . . . . . . . . . . . . . . .48495051526.17.17.2.5859626364656667. 68. 69Comparison of undergraduate business rankings as they compare to the survey results . . . . . . . . . . . . . . . . . . . . . 72Comparison of undergraduate computer science rankings asthey compare to the survey results . . . . . . . . . . . . . . . 734
7.37.47.57.67.77.87.97.107.117.127.13Comparison of undergraduate Engineering rankings as theycompare to the survey results . . . . . . . . . . . . . . . . .Comparison of undergraduate Humanities and Arts rankingsas they compare to the survey results . . . . . . . . . . . . .Comparison of undergraduate Science rankings as they compare to the survey results . . . . . . . . . . . . . . . . . . . .Comparison of graduate Business rankings as they compare tothe survey results . . . . . . . . . . . . . . . . . . . . . . . .Comparison of graduate Computer Sciences rankings as theycompare to the survey results . . . . . . . . . . . . . . . . .Comparison of graduate Engineering rankings as they compareto the survey results . . . . . . . . . . . . . . . . . . . . . .Comparison of graduate Humanities and Arts rankings as theycompare to the survey results . . . . . . . . . . . . . . . . .Comparison of graduate Sciences rankings as they compare tothe survey results . . . . . . . . . . . . . . . . . . . . . . . .Comparison between ranking sites and survey results - Categories vs Graduate, Undergraduate, and Both. . . . . . . . .Weights of each data source used by undergraduate programranking sites. . . . . . . . . . . . . . . . . . . . . . . . . . .Weights of each data source used by graduate program rankingsites. . . . . . . . . . . . . . . . . . . . . . . . . . . . . . . .5. 75. 76. 77. 79. 80. 81. 82. 83. 84. 85. 86
List of Tables3.13.2List of sites with available methodologies. . . . . . . . . . . . . 22List of sites without available methodologies. . . . . . . . . . . 235.1Metric weightings employed by each ranking site as a percentage of total. . . . . . . . . . . . . . . . . . . . . . . . . . . . . ess ranking categories in order of priority. . . . . . . .Computer Science ranking categories in order of priority. . .Engineering ranking categories in order of priority. . . . . . .Humanities and Arts ranking categories in order of priority. .Science ranking categories in order of priority. . . . . . . . .Business ranking categories in order of priority. . . . . . . .Computer Science ranking categories in order of priority. . .Engineering ranking categories in order of priority. . . . . . .Humanities and Arts ranking categories in order of priority. .Science ranking categories in order of priority. . . . . . . . .Survey results for preferred undergraduate data sources. . .Survey results for preferred graduate data sources. . . . . . .Survey results for importance college-wide ranking factors. tionQuestion1.2.3.4.5.6.7.8.9.6.
B.10 Raw answers to Question 10 . . . . . . . . . . . . . . . . . . . 108B.11 Raw answers to Question 11 . . . . . . . . . . . . . . . . . . . 1087
Chapter 1IntroductionCollege rankings claimed the national spotlight upon the 2013 release of theDepartment of Education’s College Scorecard [3], which attempts to ratecolleges, giving prospective students and families a tool for college planning.They are far from the first and far from the only organization to rate colleges.College rankings have a long history in the Unites States. Presently there aremany college rankings, the most well-known being the U.S. News and WorldReport rankings (frequently shortened to US News) [17]. However, studentssearching for colleges and universities may be interested in more than justthe overall quality of an institution–they may be interested in the quality ofa particular program at that institution. There is therefore a demand for adifferent class of rankings: program rankings.1.1Problem StatementTo perform any analysis or draw any conclusions regarding the state of collegeprogram rankings, one must first identify the existing rankings. This is thefirst goal of our project: to catalog existing college program rankings andidentify the methodology they each use.The second goal is to determine whether or not the existing college program rankings are adequately meeting the needs of those using them as atool.8
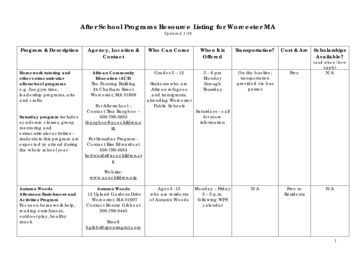
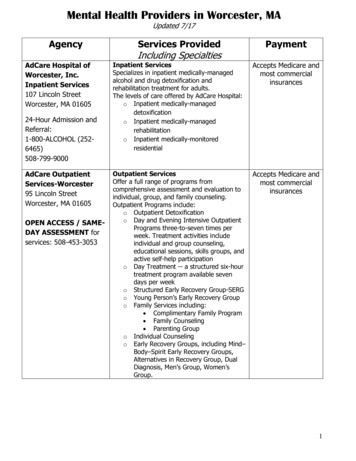
1.21.2.1MotivationCollege RankingsImpact of RankingsDoing a thorough examination of rankings could be considered to be onlyworthwhile if those rankings actually have some impact, on institutions oron the students decisions. A study on the impact of US News’ rankingsfound that a gain of just one position in the rankings increases the numberof applications that an institution receives [11]. What may be alarming isthe impact rankings can have on the policies of institutions. The WashingtonPost reports that some colleges have adjusted their admissions and financialpolicies in an effort to improve their positions in the rankings, and some haveeven gone so far as to intentionally misreport information [12].The modification of policies in order to improve an institution’s positionmay be seen as institutions being held accountable and responding to criticism, as suggested by President Obama [1], or it may be seen as a classicexample of the popularly cited Goodhart’s Law, originally formulated as “Assoon as the government attempts to regulate any particular set of financialassets, these become unreliable as indicators of economic trends,” or morepopularly as “When a measure becomes a target, it ceases to be a goodmeasure [13].”White House College RankingsIn 2013, the U.S. Department of Education unveiled the “College Scorecard,” described as a “planning tool to help students and their families makemore educated decisions about college” [2]. Led by the department’s CollegeAffordability and Transparency Center, the tool rates colleges on factors relating to their affordability and performance, including statistics such as netcost, graduation rate, loan default rate, and median borrowing [3]. Figure1.1 is a screenshot of the tool as of February 2015. The tool has already beenmet with criticism from academics and politicians [4], raising many questionsaround the question of “How should colleges and universities be evaluated?”and even “Should we attempt to rate colleges at all?”The College Scorecard is part of a larger scheme to stymie “soaring”college tuition prices, and hold Universities accountable for their performance[1]. In the US, the trend has been an ever-increasing number of college9
Figure 1.1: A screenshot of the10 Department of Education CollegeScorecard for a particular institution, as of February 2015 /higher-education/collegescore-card)
enrollments–the overall college enrollments rates have grown from 26 percentin 1980 to 41 percent 2012, and the increase was primarily driven by forprofit colleges [7]. However, growing even faster than college enrollment isthe price of college. College is around 11 times more expensive now thanit was 35 years ago [8]. When announcing the Scorecard President Obamasaid that higher education is “an economic imperative that every family inAmerica should be able to afford [1].” The tool ostensibly makes it easier forfamilies and students to analyze the costs and benefits of attending collegeor university.Criticisms of College RankingsThe Scorecard has also been met with heavy criticism from various sources.Academics have claimed that the Scorecard presents “misleading metrics,”presents only a “short-term perspective” on the cost/benefits of attendingan institution, and that it measures “too narrow of a definition of institutional performance [4].” Several Republican congressmen have also spokenout, voicing concerns about the effects of “regulation” on the market forcolleges, saying that it could “curtail the very innovation we hope to encourage,” and that it’s a “slippery slope, and one that ends with the privatesector inevitably giving up more of its freedom to innovate and take risks[1].” Directly relevant to this paper, however, is the criticism that Scorecard is biased towards institutions with a heavier focus on technical fields orprofession fields, creating an apples-to-oranges comparison.Criticisms of independent rankings have been even harsher in some ways.Rojstaczer argued that the US News rankings were “mostly about money,”and that they changed their formula every year for the purpose of sellingmore magazines [14].” It also has been argued that the rankings do notrate colleges “on the fundamental issues of how well colleges and universitieseducate their students and how well they prepare them to be successful aftercollege [15].”1.2.2Importance of Program RankingsThe College Scorecard program has again brought college ratings into thenational spotlight. A multitude of independent organizations present theirown ratings and rankings, attempting to evaluate universities on a variety offactors. One particular criticism stands out that applies to Scorecard as well11
as many of these rankings: They are frequently systematically biased towardscertain fields. Scorecard, with its focus on post-graduation salaries, is biasedtowards institutions with a focus on technical and professional fields, criticssay [9]. Aside from some calling this unfair, it can create further problemswhen deciding on an institution for a particular program. It may be that, forinstance, a Liberal Arts degree at an Engineering school with high averagepost-graduation success on Scorecard may be less profitable than a LiberalArts degree at a Liberal Arts school with low average post-graduation success.For this reason, while Scorecard is perhaps a good start, it appears thatthere is a need for ratings that evaluate on the program level, instead ofexamining the university as a whole. While Scorecard may be trustworthyon some level due to being an official government program, available ratingsand rankings for college programs are performed exclusively by independentorganizations, some who may be trustworthy and some who are not. Inaddition it may be that the rating factors needed for a quality assessmentof college programs are completely different from that of institutions as awhole. This presents a motivation for this paper: a thorough examinationof available program ratings, and a study into which factors are importantwhen evaluating programs.1.2.3Past ProjectsAn Interactive Qualifying Project team in 2014 examined various rankingsand rating sources for colleges and universities. Their results will be covered in more detail in Chapter 2, but among their principal findings was adiscrepancy between the factors that people considered important, and thefactors that were considered most prominently in rankings [10]. Their resultssuggest that in some sense, the rankings are not doing their job in delivering rankings that reflect what people value. One of the goals of this projecttherefore is to establish whether the same is true of program rankings.1.31.3.1Project Goals and ApproachGoalsIn the light of the motivations presented in Section 1.2, we present threemain goals, which also represent the three major sections of this paper:12
1. Examine, catalog, and classify factors used by existing college programrankings.In other words, determine which rankings exist and how they evaluate college programs, and quantify this information such that it canbe easily evaluate and compared. Then analyze this data, comparingrankings across program types, program level, and other axes.2. Determine the value of evaluation factors.While trying to measure the importance of factors directly is difficultor impossible, it is possible to conduct a survey in order to determinehow people value certain factors. This is exactly what we did in thisproject. It can again be analyzed across a number of axes.3. Compare the use of factors by program rankings to their perceived value.Finally, we compare 1 and 2, allowing us to determine how good of ajob program ranking sources are doing at evaluating programs alongthe factors that real students, employers, and educators consider important.1.3.2Ranking CategoriesContinuing off the work of the previous IQP team [10], we have designated sixranking primary categories that factors used in the evaluation of programsfall under. These are consistent with the factors presented by the 2014 IQPteam. These categories are: Academics - Factors related to the academic performance of program,such as academic reputation, student-faculty ratio, and graduationrate. Finance - Factors related to the affordability of a program, such ascost, financial aid, and loan size. Post-Graduation Success - Factors related the success of students aftergraduation, such as average starting salary, or acceptance rate intograduate school.13
Research - Factors related to the quality of the research performedwithin a program, or by the associated department’s faculty, such asnumber of citations, or research funding. Student Body - Factors related to the quality of the incoming studentbody, such admission rate, mean SAT/ACT scores, and diversity. Student Life - Factors related to the daily life of students in the program, such as athletics, ROTC size, and social scene.1.3.3Subject AreasIn order to simplify our examination, we grouped programs into broadersubject areas. While the subject areas selected are by no means meant torepresent the entirety of academic study, they were intended to provide areasonably diverse set of programs to compare between. The subject areasare: Business Computer Sciences Engineering Liberal Arts Science1.4Road Map In Chapter 2, we go into further detail regarding the history of collegerankings and discuss the current state of them. In Chapter 3, we begin by cataloging existing program rankings, andidentify the methodology they use. We determine which rankings wewill include in our analysis, and which ones to discard. In Chapter 4, we classify the methodologies used by college programrankings according to our Ranking Categories, the Data Source, andCollege-Wide vs. Program-Specific. We assign category weights foreach criteria.14
In Chapter 5, we go into detail in analyzing and comparing the methodology used by college program rankings. We compare across SubjectAreas, Graduate vs. Undergraduate, and other splits. In Chapter 6, we introduce a survey distributed to the public thatattempts to determine attitudes toward important characteristics ofcollege program rankings. In Chapter 7, we compare the results of the survey to our results onexisting college program rankings. We also compare our results theresults of the previous IQP study on college rankings. We finish in Chapter 8 with an overview of our major findings andrecommendations for future work.15
Chapter 2Background2.1Early College RankingsAccording to The Center for College Affordability, Where We Get Our BestMen contained the first numerical ranking of colleges [5]. In Where WeGet Our Best Men Alick Maclean attempted to examine the factors thatproduced great people, and produced an ordered list of universities rankedby the number of ”eminent men” they produced. So the first ever collegeranking actually arose from a broader look at the conditions that producedgreat people.Raymond Hughes broke away from the early trend of relying on the number of important graduates by conducting a survey of his fellow academicsregarding the reputation of different departments [6]. Hughes’ first survey,conducted in 1925, was only concerned with the graduate level, and onlypolled Hughes’ colleagues at Miami University in Ohio. Hughes made onemore contribution to the world of college rankings with his 1925 study; itwas concerned with ranking individual programs within universities.Nine years later, Hughes conducted a much larger version of his originalreputation study, which covered thirty more disciplines than the twenty ofthe original study [5]. In this study, he first requested lists of the top 100academics in each of the fields that he was surveying, and then sent out pollsto each of the academics in the lists provided, of which around half responded.Hughes in this case decided to only compile a list of college departments abovesome cutoff, with no order beyond this cutoff. Hughes made the observationthat the opinions of academics tend to lag years behind the quality of the16
actual institutions in question, as up and coming departments take time tomake reputations for themselves.According to College Rankings History, Criticism and Reform by LukeMyers and Jonathan Robe, between 1934 and 1959, reputation based rankings fell by the wayside, but between 1959 and 1966, five reputation-basedrankings were compiled [5]. The seminal reputation based survey of the period, the Assessment of Quality in Graduate Education, otherwise known asthe Cartter Report, was published in 1966 [5]. Cartter asked departmentheads, senior scholars, and junior schollars to fill out a ranking on a scale ofone to five, and was also concerned with departmental rankings rather thanrankings that rated schools overall.2.2Previous IQP WorkThis project builds off of prior work done by a past IQP that attemptedto analyze rankings that looked at entire colleges as a whole rather thanindividual departmental rankings [10]. The past IQP noted that all metricsused by various sources could be generalized into a small set of categoriessuch as success after graduation. The past IQP also looked at the distinctionbetween college rankings in the United States, and college rankings thatapplied world wide.The prior IQP looked at five US-only college ranking sites, and anotherfive world-wide ranking sites. They concluded that the different ranking sitesdiffered enough that a survey was required in order to determine what thoseusing the sites actually cared about, in order to see how it differed from howthe ranking sites determined college ranks. The previous IQP concludedthat the factors most desired in college ranking were Academics and PostGraduation Success.The results of their survey were used to develop recommendations forof what ranking site to use. The previous IQP suggested looking into themethodology of program rankings as a possible avenue for future work.2.3SummaryThere have been trends in college and department rankings since they wereinvented over 100 years ago. Since the early 1960s, the most common and17
popular type of survey has been the expert survey.This IQP arose from a 2014 IQP that looked at college rankings as awhole rather than looking at rankings for individual departments and howthey differ between departments. This project, while going more in depth onthe specifics, focused less on international rankings, which were given equalfocus in the previous IQP.18
Chapter 3Identifying Available Rankings3.1Finding Ranking SitesThis project took three major paths to find available ranking organizations.The web was searched for terms such as ”best colleges” and ”college rankings”, as well as more specific terms such as ”best computer science departments” and ”mechanical engineering department rankings”. The idea of thesearch terms being to capture a cross section of college ranking sites thatwould be found by college applicants. A collection of college departmentheads in the fields covered by this report were asked if they knew of anyrankings which were well regarded in their fields, which yielded nothing ofnote. A large book store nearby was also visited to see what print media wasavailable, and also yielded nothing of note, at least for department rankings.3.2Subject AreasIn order to find a reasonable cross section of program rankings, broad categories which covered most types of college program were developed. Computer Sciences, which was covered by Computer Science and Gaming (GameDesign), represents a new and very fast growing area. Engineering as acategory represents all traditional engineering disciplines; which were represented in this project by Electrical Engineering, Mechanical Engineering,and Robotics Engineering. Humanities and Arts represents all of the classicalhumanities disciplines and were represented in this study by History, Music,Psychology, and the general category ”Liberal Arts”. Business as an area19
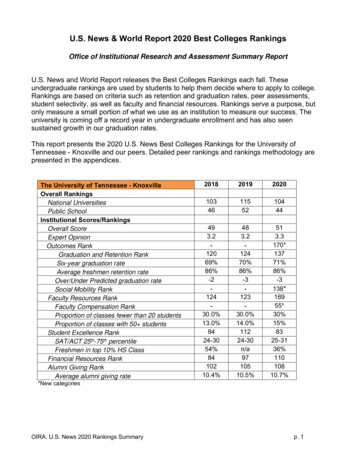
was chosen to essentially fill in the gaps, and because the MBA as a programmight produce interesting information. It was assumed that traditional sciences might have different interests than engineering disciplines, because itfits into the academic, non-profit driven side of STEM; it was represented byBiology and Chemistry.US News and World Report has a number of breakdowns for collegerankings, some of which focus on a specific subject area, and some of whichfocus on breakdowns not within the scope of this paper. The subject areas covered ended up as a subset of this paper’s categories. College Factualgrouped their program rankings into the following areas: Arts and Humanities, Public/Social Services, Social Sciences, Business, ”Trades, Skills, andServices, and Miscellaneous”, STEM, Health and Medicine, and Multidisciplinary Studies. Covering every subject area would be outside of the scope ofthis project, so some categories were discarded by a fairly subjective measureof what seemed “interesting”.3.3Results of Ranking SearchesAccording to our research, there are more than 20 college ranking sites available online. We classified them into two groups. The first group includesranking sites that had clearly explained methodologies, and second groupincludes ranking site that did not list their methodologies. Table 3.1 listedavailable ranking sites that provided methodologies, and Table 3.2 listedthose that did not. Many of the ranking sites that do not have methodologies seem to mostly be purely advertising sites. Some of them, such asUS College Ranking, World Ranking Guide, and Good University RankingGuide just show the results from other ranking site such as US News.3.4SummaryThis paper looked at a number of methods of finding college rankings, although ended up finding that web searches provided almost all of the results.Several programs were chosen as representatives for different subject areasin an attempt to reduce the amount of work needed, while still examiningrankings that were representative of most program rankings. In the end, thefollowing programs were chosen, Computer Science, Gaming, History, Music,20
Psychology, Liberal Arts, Business, Biology, Chemistry, Electrical Engineering, Mechanical Engineering, Robotics. Some of the ranking sites lackedmethodologies, which meant that they did not provide any useful information, so only ranking sites that provided methodology sections were selectedfor analysis.21
Electrical xx
College Program Rankings IQP-CEW-1502 Submitted to the Faculty of WORCESTER POLYTECHNIC INSTITUTE In Partial Ful llment of the Requirement for the Degree of Bachelor of Science by Sam Abradi Christopher Nota Penny Over Tung Ton UNDER THE GUIDANCE OF Professor Craig E. Wills Friday 13thMarch, 2015