Transcription
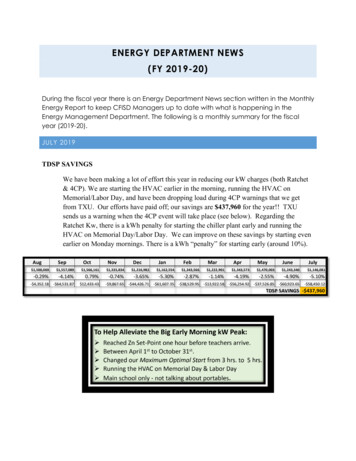
ENERGY DEPARTMENT NEWS(FY 2019-20)During the fiscal year there is an Energy Department News section written in the MonthlyEnergy Report to keep CFISD Managers up to date with what is happening in theEnergy Management Department. The following is a monthly summary for the fiscalyear (2019-20).JULY 2019TDSP SAVINGSWe have been making a lot of effort this year in reducing our kW charges (both Ratchet& 4CP). We are starting the HVAC earlier in the morning, running the HVAC onMemorial/Labor Day, and have been dropping load during 4CP warnings that we getfrom TXU. Our efforts have paid off; our savings are 437,960 for the year!! TXUsends us a warning when the 4CP event will take place (see below). Regarding theRatchet Kw, there is a kWh penalty for starting the chiller plant early and running theHVAC on Memorial Day/Labor Day. We can improve on these savings by starting evenearlier on Monday mornings. There is a kWh “penalty” for starting early (around 10%).Aug 1,500,069Sep 1,557,089Oct 1,566,161Nov 1,335,834Dec 1,216,982Jan 1,162,554Feb 1,343,566Mar 1,222,901Apr 1,343,573MayJune 1,470,003 1,243,340July -1.14%-4.19%-2.55%-4.90%-5.10%- 4,352.18- 64,531.87 12,433.43- 9,867.65- 44,426.71- 61,607.35- 38,529.95- 13,922.58- 56,254.92- 37,526.85- 60,923.65- 58,450.12TDSP SAVINGS - 437,960
RMS BUILDING OPTIMIZATION SOFTWARERMS building optimization software is used to monitor almost all CFISD facilities’ kWhand kw usage. RMS can be utilized many ways (see below specifications). It was justused to discover a chiller plant that was left ON 24/7 at Lee Elementary School (seebelow); just finding and fixing this problem saved the District over 30,000. Here aresome of the features of this software that CFISD has been using for over a year:Technical llect automatic interval energy data from utilities websites.Display kWh per hour interactive graphs to be visualized in heat maps,Displays kWh line graphs, column bar graphs for daily, monthly comparing yearover-year.Automatic Daily Reporting and Alarms: the technology will provide a daily reportper facility.Capabilities to generate an alarm if a threshold is reached when an increment ofenergy use in kWh is obtained comparing current use versus last year’s use.Data export: the technology will provide these reports in pdf format.Automatic monthly reportingkWh consumption analysis per facility, compared with last year, considering kWh,kWh/ Sf Ft, Peak kW, and Load Factor.Data export: the technology will provide these reports in pdf format.Weekly Benchmark: the technology will provide visual benchmarking per facilityto compare with last year’s weekly energy consumption with descending sortingand calendar weekly selection capabilities.Pivot Data Tables: this technology will display energy consumption in kWh, kWh/SF, kWh/student, KW Peak, per facility considering the name with capabilities offiltering and sorting by building type, Utility or source, year, month, day, week andday. Will show partial and totals per year, month, day. Pivot Tables will be able tobe deployed as Bar-chart heat-map, Row heat-map or Column heat-map.Load Factor: the technology will show daily, monthly, and yearly load factor in agraph bar.Track and manage peak demand: the technology will generate an annual graphshowing the kWh used versus the percentage in time it was used to identify the peakload in each facility.Regression Analysis: The technology will generate a polynomial regressionfunction per facility using the 12 past months’ interval kWh and temperature,omitting off-hours, holidays, and vacations as we would like to analyze thefacilities’ behavior which is dependent on temperature. Ability to present currentdaily scatter points to compare performance to the base year.
15.Normalization of energy consumption and Prediction Model: The technology willgenerate an algorithm for prediction model of energy consumption in each facilityto compare energy consumption to that model and deploy in bar graphs the savingsor waste of energy.
AUGUST 2019TXU REDUCTION REWARDSCypress Fairbanks ISD’s Energy Management Department will receive a TXU ReductionRewards check for 43,000 for limiting electricity load during all three “Demand Events”this past summer. The Reduction Rewards program is voluntary and there is no contract.A notice is sent in the morning of the impending event; CFISD signs up for the event, andthen gets ready to curtail during the hours requested (usually 1-3 hours).CFISD reduces their electrical load using several Demand Response (DR) Programswhich Energy Management has invested approximately 140,000 on these programs. Oneprogram is in ALC (Fig. 6) and another program is in Unify (Fig. 7). We also can limitoutside air (OA) in Trane. Most control companies provide this DR feature – sometimesas an add-on. Please see snapshots below:
With the DR programs, CFISD can reduce its load in the following ways: Resetting the temperature during the demand event (1, 2 or 4) degrees.Limiting the OA during the event period.Returning to an earlier chiller state or shutting the chiller plant down all together.Limiting all the VFDs in the school – using a multiplier (i.e. 70%).CFISD has 69 schools on either the ALC, Unify and Trane programs. CFISD also usesthe same programs for Summer Dehumid (limiting OA), School-Day Morning Start-up(limiting OA), 4CP Reduction, Demand Response- ERS Events, along with TXUReduction Rewards. The program paid for itself the first year – just limiting the OAduring the Summer Dehumid. We also can make exceptions for special events and floorrefinishing.Figure 1 ALC Elementary School Demand Response Dashboard
Figure 7: Unify Demand Response Set-UpTDSP SAVINGSCFISD has been reducing our kW charges (both Ratchet & 4CP). We are starting theHVAC earlier in the morning, running the HVAC on Memorial and Labor Day, and havebeen dropping load during 4CP warnings that we get from TXU. Our efforts have paidoff; our savings are 111,907 for August 2019 (over the base month – August 2017).Regarding that Ratchet Kw, there is a kWh penalty for starting the chiller plant early andrunning the HVAC on Memorial Day/Labor Day. We can improve on these savings bystarting even earlier on Monday mornings to avoid all the chiller stages from coming ONwhile the school is occupied; this occurs because the chiller plant decrements before thestudents arrive (because of the building being pre-cooled).
2018-19AugMonth 1,500,069Prev Yrs. CostsTDSP Rate Red.SavingsOct 1,566,161Nov 1,335,834Dec 1,216,982Jan 1,162,554Feb 1,343,566Mar 1,222,901Apr 1,343,573MayJune 1,470,003 1,243,340July -1.14%-4.19%-2.55%-4.90%-5.10%- 4,352.18- 64,531.87 12,433.43- 9,867.65- 44,426.71- 61,607.35- 38,529.95- 13,922.58- 56,254.92- 37,526.85- 60,923.65- 58,450.122019-2020AugMonthSep 1,557,089NovDecJanFebMarAprMayJuneJulySavings- 107,555.21MonthCombined Savings (They are DSP Rate Red.Combined SavSepOct 1,288,264Prev Yrs. Costs-8.35%- 111,907TOTAL TDSP SAVINGS - 549,868SEPTEMBER 2019INCENTIVE CHECKSCFISD received a 112,526 check from CenterPoint SCORE in November and willreceive another 57,016 check. We also have potential for receiving checks for MooreES and Metcalf ES M&V Reports 66,108 and 44,913 checks. We’re thinking abouthaving a “big check” presentation at the February’s board meeting. TXU has expressed adesire to be in such a presentation as well for their Greenback Rewards & for ReductionRewards. So, they would be joining us (2 big checks). Matt Morgan and Roy Spraguewill join us for the presentation as well as representatives from CenterPoint and TXU.FromSCORESCORESCORESCOREFromTXUTXUCheck StatusAmountCheck Received 112,526.00Check Released 57,016.00Future Check 66,108.00Future Check 44,913.00 280,563.00Check StatusAmountCheck Received 75,000.00Check Received 43,000.00 118,000.00TOTAL 398,563.00Description40% of Cook, Thornton, Truitt, Langham Creek HS2019 Bond lighting projectsMoore M&VMetcalf M&VDescriptionGreenback RewardsReduction Rewards
LED BULBSWe would like to use part of the incentive money for RCx projects; in addition, we wouldlike to use the incentive money to purchase LED bulbs for schools that are not gettingLED fixtures on the 2019 Bond. I will have to find out from Matt and Richelle whichschools are not scheduled for LED retrofits. The LED bulbs would pay for themselves inless than two years if we were to install the retrofit; and approximately three and a halfyears if we hire out the labor. I’ve talked to two different vendors and will work withTom Draper on the purchases. I’m thinking about doing Cy-Park HS and Bridgeland HSfirst (if they are not on the Bond). The lamps should last at least 10 years and will holdus over until a Bond comes along to replace the fixtures. The wattage will be 10Wcompared to the present bulbs which approximately use 25W. This will help CFISDachieve their sustainability goals (set forth by the State ety-code/health-safety-sect-388-005.htmlHere is the LED Lamp Cut Sheet of one of the vendors:https://www.halcolighting.com/pdf/sell sheet/9209.pdfLED Retrofit Lamps & Labor (Electric Savings Only105075363940.953500143,3250.07410,606.051.25 13,257.56FixturesWatts/Fixt PreWatts/Fixt PostWattskW SavingsHoursKwhBlended Electric Rate50,000.00 hour life14.29HVAC SavingsTotal Annual Savings 37,462.50 Cost2.8 Payback 11.89 Per/lamp (installed)LED Retrofit Lamps/No Labor (Electric Savings Only105075363940.953500143,3250.07410,606.051.25 13,257.56FixturesWatts/Fixt PreWatts/Fixt PostWattskW SavingsHoursKwhBlended Electric RateHVAC SavingsTotal Annual Savings 19,980.00 Cost1.5 Payback 6.34 Per/lamp (installed)50,000.00 hour life14.29
TDSP SAVINGSCFISD has been reducing our kW charges (both Ratchet & 4CP). We are starting theHVAC earlier in the morning, running the HVAC on Memorial and Labor Day, and havebeen dropping load during 4CP warnings that we get from TXU. Our efforts have paidoff; our savings are 103,211 for September 2019 (over the base month – September2017). Regarding that Ratchet Kw, there is a kWh penalty for starting the chiller plantearly and running the HVAC on Memorial Day/Labor Day. We can improve on thesesavings by starting even earlier on Monday mornings to avoid all the chiller stages fromcoming ON while the school is occupied; this occurs because the chiller plant decrementsbefore the students arrive (because of the building being pre-cooled).2018-19AugMonthPrev Yrs. CostsTDSP Rate Red.Savings 1,500,069Oct 1,566,161Nov 1,335,834Dec 1,216,982JanFeb 1,162,554 1,343,566Mar 1,222,901Apr 1,343,573MayJuneJuly 1,470,003 1,243,340 -1.14%-4.19%-2.55%-4.90%-5.10%- 4,352.18- 64,531.87 12,433.43- 9,867.65- 44,426.71- 61,607.35- 38,529.95- 13,922.58- 56,254.92- 37,526.85- 60,923.65- 58,450.122019-2020AugMonthSep %-2.78%- 107,555.21- 38,679.03MonthCombined Savings (They are rev Yrs. CostsTDSP Rate Red.Combined Sav 1,288,264- 111,907SepOct 1,391,388- 103,211TOTAL TDSP SAVINGS - 653,079OCTOBER 2019POWER FACTOR CORRECTION CAPACITORSWe received a quote to install power factor correction capacitors at Langham Creek HighSchool and Cook Middle School. As we are doing whole-building M&V at both schoolsfor SCORE, any conservation measure that add to those buildings will also be capturedby the M&V. At LCHS, we can save 67.6 KVA, and at Cook, we can save 71.3 KVA.SCORE pays 175 per KVA making the rebate 24,312. I calculated the annual savings– see financials below:
LCHSOld15570.941656.4New15570.981588.8Diff67.6% Drop4%Rebate 11,831.31Ratchet KVA1329Monthly KVA11004CP KVA466Monthly Saving 329.86Annual Savings 3,958.29Cook MSOld9280.921008.7New9280.99937.4Diff71.3% Drop7%Rebate 12,481.34Ratchet KVA13294CP KVA352Monthly Savings 453.34Annual Savings 5,440.06Turnkey CostRebateSubTotalAnnual SavingsPayback Yrs. 48,000.00 24,312.64 23,687.36 9,398.352.5RETRO-COMMISSIONINGWe just finished implementing the RCx report at Langham Creek HS in October.Combined with the LED retrofit last summer, it’s looking like Langham Creek is now themost efficient high school in the District. Of course, the number of “after-hours” eventsplays a part in this. Still, it’s a 26% reduction over last year, when you take both (the RCxand LEDs) into account.We are currently working on CyRanch and replicating the same energy conservationmeasures. We could install LED bulbs there as well and get close to the same result. Themain ECMs are adding VFDs to convert constant volume AHUs to variable volume andadding CO2 sensors to control outside air dampers.
The PowerPoint below (from TEMA) shows the typical payback times of energy efficientprojects. As one can see, Retro-commissioning is one of the quickest paybacks.TDSP SAVINGSCFISD has been reducing our kW charges (both Ratchet & 4CP). We are starting theHVAC earlier in the morning, running the HVAC on Memorial and Labor Day, and havebeen dropping load during 4CP warnings that we get from TXU. Our efforts have paidoff - our savings are 37,893 for October 2019 (over the base month – October 2017).Total TDSP savings are 690,972 since we started our reduction methods (15 monthsago). Regarding that Ratchet Kw, there is a small kWh penalty for starting the chillerplant early and running the HVAC on Memorial Day/Labor Day. We can improve onthese savings by starting even earlier on Monday mornings to avoid all the chiller stagesfrom coming ON while the school is occupied; this occurs because the chiller plantdecrements before the students arrive (because of the building being pre-cooled).MonthPrev Yrs. CostsTDSP Rate Red.SavingsMonth2018-19Aug 1,500,069Sep 1,557,089Oct 1,566,161Nov 1,335,834Dec 1,216,982Jan 1,162,554Feb 1,343,566Mar 1,222,901Apr 1,343,573MayJune 1,470,003 1,243,340July -1.14%-4.19%-2.55%-4.90%-5.10%- 4,352.18- 64,531.87 12,433.43- 9,867.65- 44,426.71- 61,607.35- 38,529.95- 13,922.58- 56,254.92- 37,526.85- 60,923.65- Savings-8.35%-2.78%-4.05%- 107,555.21- 38,679.03- 50,326.37MonthCombined Savings (They are rev Yrs. CostsTDSP Rate Red.Combined Sav 1,288,264- 111,907Sep 1,391,388- 103,211Oct 1,241,799- 37,893TOTAL TDSP SAVINGS - 690,972
NOVEMBER 2019UPS COMPARISONI monitored uninterruptible power supplies for the IT department, comparing threedifferent UPSs, one of which will be purchased across the District.IntroductionThe Input and Output of the three UPSs were monitored for 2-3 days, using a high speedDranetz HDPQ power meter. Both current and voltage were measured at theinput/output. The Dranetz HDPQ is capable IEEE 1459 Advanced Power Measurements.High Definition PQ and Energy Monitoring – 1000Vrms, AC/DC, 512 samples/cycle. Ascope snapshot was taken of both current and voltage prior to leaving the meter formonitoring for 2-3 days. Channel A is the Input (both current and voltage). Channel B isthe Output (both current and voltage). The energy consumption in kVAhs wasaccumulated during the time period. A picture was taken of the final result for each unit.A special adapter was made for the voltage probes to connect into the 120V outlet. Thecurrent was made using Dranetz CTs with a 3A scale, and by splitting an extension cordand monitoring just the hot; the load (switches) and UPS were connected to the extensioncords.Monitoring ResultsAfter monitoring for two-three days each, the following results were obtained:Figure 6: Efficiency ResultsTripp-LiteEatonVertivInput kVA-h Output kVA-h25.3613.1519.2917.05.365.08Eff52%88%95%Vertiv was the most efficient UPS, coming in at a 95% efficiency.
District Electricity CostsAssuming that these results (shown above – Fig 6) were a good representation forcontinual loading for the complete calendar year, and assuming a 24/7-day operation anda 70% load on 1000, 2000VA units, the electrical costs to the District are as follows:Figure 7: District Utility CostskVA-h Eff Annual ElctricityCosts ( ) 412,916 101,812 44,801The following pages show the scope snapshots and the monitoring consumption results inkVAhs:Tripp-Lite UPS (2/7 to 2/10/2020)Figure 8: Tripp-Lite: Input Voltage (Red), Current (Burgundy), Output Voltage (Yellow), Current (Goldenrod)
Figure 9 Tripp-Lite: Input (Ch A) / Output (Ch B)Eaton UPS (2/10 to 2/12/2020)Figure 10 Eaton: Input Voltage (Red) Current (Burgundy); Output Voltage (Yellow), Current (Goldenrod)
Figure 11 Eaton: Input (Ch A) / Output (Ch B)Vertiv UPS (2/12 to 2/14/2020)Figure 12 Vertiv: Input Voltage (Red) Current (Burgundy); Output Voltage (Yellow), Current (Goldenrod)
Figure 13 Vertiv: Energy Consumption Input (Ch A) / Output (Ch B)Miscellaneous Notes The Uninterruptible Power Supply (UPS) should be Energy Star stamped for thatspecific model (not just the family). The Energy Star test is likely rigorous andrequires testing the UPS over a long period of time (probably weeks) and over variousloads. The Maintenance Department should be scheduled to do an emergency generator testat Woodard ES to see how the UPSs perform during an emergency event. For Set-Up: When setting up the chosen UPS, make sure that it is set up to run in theECO mode during normal operation. The UPS shall also have a user customizablerequalification time that input power must remain within the ECO mode parametersbefore transferring back to ECO operation; please make sure the minimumrequalification time-period is selected, so it runs in the ECO mode for as long aspossible. Remember that any inefficiency of the UPS will also have electrical circuit capacityissues, not just increased utility costs. For example, if a UPS is 50% efficient, an extra50% must be added to the load that is place on a 20 or 30 circuit. So, an inefficientUPS might require that the electrical circuits to be upgraded to handle the extra amps.
TDSP SAVINGSCFISD has been reducing our kW charges (both Ratchet & 4CP). We are starting theHVAC earlier in the morning, running the HVAC on Memorial and Labor Day, and havebeen dropping load during 4CP warnings that we get from TXU. Our efforts have paidoff; our savings are 50,325 for November 2019 (over the base month – November2017). Total TDSP savings are 743,574 since we started our reduction methods (16months ago). Regarding that Ratchet Kw, there is a small kWh penalty for starting thechiller plant early and running the HVAC on Memorial Day/Labor Day. We can improveon these savings by starting even earlier on Monday mornings to avoid all the chillerstages from coming ON while the school is occupied; this occurs because the chiller plantdecrements before the students arrive (because of the building being pre-cooled).MonthPrev Yrs. CostsTDSP Rate Red.SavingsMonthPrev Yrs. Costs2018-19Aug 1,500,069Sep 1,557,089Oct 1,566,161Nov 1,335,834Feb 1,343,566Mar 1,222,901Apr 1,343,573MayJune 1,470,003 1,243,340July -1.14%-4.19%-2.55%-4.90%-5.10%- 64,531.87 12,433.43- 9,867.65- 44,426.71- 61,607.35- 38,529.95- 13,922.58- 56,254.92- 37,526.85- 60,923.65- 58,450.122019-2020Aug 1,288,264Sep 1,391,388Oct 1,241,799Nov-8.35%-2.78%-4.05%-3.83%- 38,679.03- 50,326.37- 42,734.80MonthCombined Savings (They are Cumulative)AugSepOctNov- 111,907- 103,211- JuneJuly 1,114,880- 107,555.21Combined SavJan 1,162,554- 4,352.18SavingsTDSP Rate Red.Dec 1,216,982- 52,602TOTAL TDSP SAVINGS - 743,574DECEMBER 2019POWER FACTOR CORRECTION AND M&V FOR FOOD PRODUCTIONCLEAResult approved a baseline for “M&Ving” the Food Production 2014 BondRenovation. We already got paid deemed savings for the project, but since the actualsavings are significantly greater than what was anticipated, and what CLEAResultalready paid out on, I asked CLEAResult if we can calculate the actual savings (usingMeasurement & Verification protocols); they said yes, if I could get a good baselineusing Metrix 4 (which I did).
The retrofits installed at Food Production included: compressed air (compressor anddryer), air cooled chiller, other AC mechanical, HVAC controls, LED lighting, aircurtains, and fast roll-up doors. Compressed air retrofits can save a lot also when they fixall the air leaks (which I suspect they did while they were installing the new equipment).I would also like to install power factor correction to boost our savings and incentive ifCarey is okay with it (see financials below).I calculate that we should be able to receive around 100, 000 extra dollars (above the 25,000 they already paid out in incentives for this bond project).Figure 2 Power Factor FinancialsFood ebate 18,735.02Monthly KVA124.9Monthly Saving 780.63Annual Savings 9,367.51Turnkey CostRebateSubTotalAnnual SavingsPayback Yrs. 30,000.00 18,735.02 11,264.98 9,367.511.2CFISD NATATORIUMThe CFISD Natatorium electric bill is a lot higher this year than last year (between 2540%). I’m going to investigate the costs of recommissioning the building. Noresco (whoworks with ALC) has a recommissioning division; I’m going to have them quote a price(it’ll be on ALC’s Co-Op) Unfortunately, the CenterPoint Recommissioning Programthat we have been using has been changed a lot (adverse changes), and I’m reluctant tostart any new projects with them (though we are finishing up on the ones we alreadystarted) Whatever the costs are with Noresco, I’m anticipating a quick payback oncetheir report is implemented and possibly will receive an incentive from CLEAResult aswell (that may cover the costs of the RCX completely).
Figure 3 CenterPoint RCx ProjectsSchoolLangham Creek HSCampbell MSRennell ESCy-Ranch HSSmith MSWarner ESCy-Woods HSSpillane MSRobison ESCy-Fair HSCy-Springs HSCy-Lakes HSArnold MSCo.Walk-Thru Sep-20Sep-20Sep-20Dec-20Dec-20Dec-20Dec-20TDSP SAVINGSCFISD has been reducing our kW charges (both Ratchet & 4CP). We are starting theHVAC earlier in the morning, running the HVAC on Memorial and Labor Day, and havebeen dropping load during 4CP warnings that we get from TXU. Our efforts have paidoff; our savings are 55,682 for December 2019 (over the base month – December 2017).Total TDSP savings are 799,256 since we started our reduction methods (16 monthsago). Regarding that Ratchet Kw, there is a small kWh penalty for starting the chillerplant early and running the HVAC on Memorial Day/Labor Day. We can improve onthese savings by starting even earlier on Monday mornings to avoid all the chiller stagesfrom coming ON while the school is occupied; this occurs because the chiller plantdecrements before the students arrive (because of the building being pre-cooled).
MonthPrev Yrs. CostsTDSP Rate Red.SavingsMonthPrev Yrs. Costs2018-19Aug 1,500,069Sep 1,557,089NovOct 1,335,834 1,566,161Dec 1,216,982Mar 1,222,901Apr 1,343,573MayJune 1,470,003 1,243,340July -1.14%-4.19%-2.55%-4.90%-5.10%- 64,531.87 12,433.43- 9,867.65- 44,426.71- 61,607.35- 38,529.95- 13,922.58- 56,254.92- 37,526.85- 60,923.65- 58,450.122019-2020Aug 1,288,264Sep 1,391,388OctNov 1,241,799 1,114,880Dec-8.35%-2.78%-4.05%-3.83%-1.12%- 38,679.03- 50,326.37- 42,734.80- 11,255.03MonthCombined Savings (They are Cumulative)AugSepOctNov- 111,907- 103,211- 37,893- ly 1,001,155- 107,555.21Combined SavFeb 1,343,566- 4,352.18SavingsTDSP Rate Red.Jan 1,162,554Dec- 55,682TOTAL TDSP SAVINGS - 799,256JANUARY 2020CY–SPRINGS LED LAMPSI got the following quote from Voss lighting for LED lamps at Cy-Springs (materialonly). His quote was based off the drawings I gave them. The first table and the thirdtable are all CFISD is interested in. The first table is LED lamps only using the PhillipsInstafit bulbs (which work with existing ballasts). The second table is direct wiring tolamps – which have drivers in them. The third table is new drivers to be in place ofexisting ballasts, and with new LED lamps. Unfortunately, I received an email fromCarey today who said he would rather change-out complete fixtures, and that theirsummer project list is full. New fixtures would cost around 250,000 just for the fixturesinstead of the 54,000 that I was prepared to spend for LED lamps. Also, with new LEDfixtures, you lose your inboard/outboard dimming! Still I worked out the financials forlamps only they are listed below the quote from Voss Lighting. I could get a quote froman outside contractor to do the labor (which of course would change the financials some).I would be looking for a labor cost of around 20,000.
Quotes from Voss Lighting (Material Only)Financials for New Lamps Only10,735251312161.0253000483,075 0.0740 35,747.55 54,1041.5lampsPre WPost WDiff WTotal kW SavedHourskWh Saved per YearElectric RateSavings per yearCostPayback Yrs.
CY-RANCH RECOMISSIONINGWe finally got a quote from ALC for Cy-Ranch recommissioning (along with Smith MS& Warner ES). The cost will be 161,333 and includes the following new devices alongwith energy efficient programming:DevicesVFDCO2 SensorsRh% SensorsSA SensorsNotes:Cy-Ranch#71176DevicesVFDCO2 SensorsRh% SensorsSA SensorsSmith#4220WarnerDevicesCO2 SensorNormally recommissioning projects have a payback of 1-2 years, giving them thequickest return on investment of any energy conservation measure. Using the LanghamCreek RCx Project as an example, I calculate our savings to be 79,000 per year if weperform in a similar manner. This gives the project a two-year payback and a 48% returnon investment based on a life of ten years, and a net present value of 512,886. 79,000.00 161,3332.048% 512,886Savings per yearCostPayback Yrs.IRR (based on 10Yr)NPVTDSP SAVINGSCFISD has been reducing our kW charges (both Ratchet & 4CP). We are starting theHVAC earlier in the morning, running the HVAC on Memorial and Labor Day, and havebeen dropping load during 4CP warnings that we get from TXU. Our efforts have paidoff; our savings are 85,284 for January 2020 (over the base month – January 2017).Total TDSP savings are 884,540 since we started our reduction methods (17 monthsago). Regarding that Ratchet Kw, there is a small kWh penalty for starting the chillerplant early and running the HVAC on Memorial Day/Labor Day. We can improve onthese savings by starting even earlier on Monday mornings to avoid all the chiller stagesfrom coming ON while the school is occupied; this occurs because the chiller plantdecrements before the students arrive (because of the building being pre-cooled).#2
2018-19AugMonthPrev Yrs. CostsTDSP Rate Red.Savings 1,500,069Prev Yrs. CostsOct 1,566,161Nov 1,335,834Dec 1,216,982Jan 1,162,554Apr 1,343,573MayJune 1,470,003 1,243,340July -4.19%-2.55%-4.90%-5.10%- 64,531.87 12,433.43- 9,867.65- 44,426.71- 61,607.35- 38,529.95- 13,922.58- 56,254.92- 37,526.85- 60,923.65- 58,450.12 1,288,264Sep 1,391,388Oct 1,241,799Nov 1,114,880Dec 1,001,155Jan-8.35%-2.78%-4.05%-3.83%-1.12%-2.45%- 38,679.03- 50,326.37- 42,734.80- 11,255.03- 23,676.53MonthCombined Savings (They are Cumulative)AugSepOctNov- 111,907- 103,211- 37,893- 52,602Dec- 55,682FebMarAprMayJuneJulyFebMarAprMayJuneJuly 968,150- 107,555.21Combined SavMar 1,222,901-0.29%SavingsTDSP Rate Red.Feb 1,343,566- 4,352.182019-2020AugMonthSep 1,557,089Jan- 85,284TOTAL TDSP SAVINGS - 884,540FEBRUARY 20202019 CALANDAR YEAR DASHBOARDPlease see dashboard that summarizes CFISD utilities for 2019 calendar year on theEnergy Management webpage -costs;the label for this dashboard is CFISD Utility Dashboard CY 2019 (.xls). The dashboardhas slicer buttons to drill down on each utility. If more than one utility needs to be lookedat the same time (such as water, irrigation, and fire), hit the control key as each button isselected. Here is a summary of the 2019 calendar year: The annual costs for all CFISD utilities are 17,856,592; 1.04 per Sq.Ft. for the District, 0.095 per Sq.Ft. for schools only. This includes Electricity, Water and Natural Gas.The annual costs to the District for Electricity only, was 13,108,432 (73.4 % of the totalutility expenses); 0.076 per Sq.Ft. for the District, 0.070 per Sq.Ft. for schools only.Consumption was 10.6 kWh/Sq. Ft. for the District, 9.7 kWh/Sq. for schools only. Thetotal electric consumption was 183,224,774 kWhs (increased 2,271,742 kWhs due toBrautigam and the result of having three extra move-in days in heat of the summer).The annual costs for Water (including Irrigation and Fire) is 4,012,575 (22.5 % of thetotal utility expenses); .021 per Sq.Ft. for the District and .019 per Sq. Ft. for schoolsonly. The total consumption was 426 Kgals (426 million gallons). The average rate forwater was 9.41 per Kgal, up from 8.01 (17.4 % increase, which comes out to a 624,823increase due to increased rates)!!The annual costs for Natural Gas are 735,585 (4.1 % of the total); 0.04 per Sq.Ft. forthe District and 0.03 for schools only.
CY-LAKES HS CHILLER PLANT UPGRADEWe purchased a chiller plant upgrade for Cy-Lakes HS. It involves a controller upgradejust at the chiller plant, along with programming. This upgrade will save energy in threeor more areas:1. Running the condenser water temperature at the optimal set-point (lowering itwhenever it is practical). The chillers save approximately 1% per degree th
ENERGY DEPARTMENT NEWS (FY 2019-20) During the fiscal year there is an Energy Department News section written in the Monthly . Cypress Fairbanks ISD's Energy Management Department will receive a TXU Reduction Rewards check for. 43,000 . for limiting electricity load during all three "Demand Events"