Transcription
33rd International Symposium on Automation and Robotics in Construction (ISARC 2016)Real-time 3D Mobile Mapping for the Built EnvironmentJingdao Chena, Yong K. ChobaSchool of Electrical and Computer Engineering, Robotics Institute, Georgia Institute of TechnologybSchool of Civil and Environmental Engineering, Georgia Institute of TechnologyE-mail: jchen490@gatech.edu, yong.cho@ce.gatech.eduAbstract –Laser scanned point clouds are relevant forgeometric analysis, building maintenance and energymodeling, yet obtaining fully registered point cloudsis a labor-intensive process when targets or commonregistration features are absent. Thus, we propose aversatile mobile platform that forms an incremental3D map of the environment in real time using anorthogonal pair of Lidar (Light Detection andRanging) devices. The horizontal scanner aims toestimate the robot position and orientation withSLAM (Simultaneous Localization and Mapping)techniques whereas the vertical scanner recovers thebuilding structure in the vertical plane. We alsodeveloped a real time point cloud visualization toolthat allows an operator to track the mapping progress.The method was evaluated with walk-through laserscans of a complete building floor.Keywords3D, Lidar, point cloud, SLAM, real-time1IntroductionThree-dimensional models of building componentsin the as-built condition are important tools in buildingmaintenance and restoration applications. Theacquisition of data for creating building models hastraditionally been done with tools such as measuringtapes and distometers [1]. However, advances in recenttechnology has led to use of a host of techniques such asrobotic total station, stereo photogrammetry, depthcameras, Light Detection and Ranging (Lidar), as well ashybrid setups to survey and map various aspects ofbuilding infrastructure. The acquired data in the form ofvisual or range data can be incorporated into a singlethree-dimensional point cloud representation. Thegenerated point cloud can be further post-processed tocreate a Building Information Model (BIM) [2], whichdescribe relational characteristics and attributes ofbuilding elements. The generated model can also be usedto monitor defects and estimate energy usagecharacteristics [3].Static scanning solutions such as fixed camera setupsand ground-based Lidar are widely used in the datacollection step of infrastructure modelling. However,they suffer from the limitation that the registration step tocombine data collected from multiple scan times is laborintensive. For example, images taken in multiplelocations for photogrammetry have to be combined in afeature point matching process. For the case of groundbased Lidar, multiple scans have to be registered togetherin a post-processing step using either Global PositioningSystem (GPS) information or iterative optimizationtechniques. These data collection methods offer limitedfeedback to the operator in terms of the final registeredoutput during the scan process, so the generated data isoften vulnerable to problems such as incomplete scans oroccluding structures.Thus, in this study we propose a mobile scanningsolution that generates a registered three-dimensionalpoint cloud output in real-time. The proposed methodinvolves two Lidar devices mounted in an orthogonalposition on a mobile platform. The two devices workconcurrently in a Simultaneous Localization andMapping (SLAM) setting to estimate the current positionand map of the environment so that each scan can beautomatically registered. The combined point cloud ispresented to the operator through a visualization tool todetermine scan progress. The proposed method aims toachieve a more efficient and accurate scanning processcompared to conventional scan techniques.2Literature ReviewMost instances of 3D mapping have been achieved byusing photogrammetry, laser scanners or even acombination of both methods with some also usingadditional technologies such as sonar and infra-red (IR)[4]. Since most research has been focused on thephotogrammetric and Lidar-based SLAM, we discusssome common practices of each approach and how closethey are to solving the SLAM problem. We also discussthe pros and cons of each approach.
Sensing Technology2.1 Application of SLAMSimultaneous Localization and Mapping (SLAM) [5]is a significant problem in mobile robotics where mapbuilding and localization is carried out without a prioriinformation. SLAM algorithms collect environmentfeatures and learn a mapping between the robot locationand the environment. Thus, SLAM algorithms provide auseful tool to automatically obtain the scan origin andregister sensor data onto a global map.2.1. Photogrammetric ApproachIn [6], Davison et al. were able to recover the 3Dtrajectory of a monocular camera moving through apreviously unknown scene. Here the nature of the mapdepends on the initial and current positions of the camera,3D position of the center of the feature and the orientationof its local surface. This algorithm is unable to handlesudden jerky movements and while it uses modestprocessing power, it has limited application in getting adetailed map of the environment. In [7], sixteenadvantages are provided on the advantages of thephotogrammetric 3D workflow over the directlymeasured laser point clouds with significant points beingthe inexpensive hardware available for vision basedtechniques and the density of surface points being higherbut these require multiple cameras and hardware to runexpensive algorithms to achieve real time SLAM. In [8],a Kinect sensor is used to generate a 3D model of abuilding and the result is compared to another modelgenerated from a laser scanner. While the paper doesmake a case for detecting discontinuity points using avision based system, the authors concluded that themeasurements are highly influenced by the material andlighting conditions. As a consequence, the generatedpoint cloud is noisy and not uniform. Khoshelham et al.[9] expounded on this in detail in their paper where theynote that the random error of depth measurementsincreases quadratically with increasing distance from thesensor. Their technique also required accurate stereocalibration of the IR camera and visual camera.Thus we can summarize the advantages of usingvisual based SLAM as being relatively less expensive,lighter and consuming less power per unit instrumentthan using laser scanners. Visual based systems are alsoable to detect colors and other features/objects whichcannot be detected by Lidar in a cluttered environment.These approaches also have their disadvantages: 1) Theycan accumulate large errors if there are large distances, 2)They are very susceptible to even slight changes tolighting conditions, 3) They can get confused in adynamic environment and 4) They are difficult to use atnight [10].2.2 Lidar Based ApproachThere have been several attempts in the literature tomap an indoor environment with laser scanners. Shohetand Rosenfeld [11] talk about two main factors affectingthe precision of the map: 1) orientation of the carriage onwhich the scanner is mounted and 2) distance betweenthe sensor and the walls being scanned. Howeveradvancements in Lidar technology have rendered the lastpoint irrelevant with commercial Lidars now availablewith a range of 120 m [12]. Current research is focusedon improving the accuracy of maps generated from laserscanners. Jung et al [13] proposed a kinematic 3D laserscanning system for indoor mapping which imposessome constraints on the environment where mainstructures are formed from straight lines and all structuresare parallel or perpendicular. Another approach tosolving the SLAM problem is having multiple robots onthe field and then integrating the pose estimations of therobots and individual maps to create a more accuratemodel of the environment [14]. This approach, whilesuccessful, does not allow the operator to have a real-timeview of the map as the off-line optimization step mayrequire the robots to stop exploration and perform theoptimization process before they resume the explorationtask.Kohlbrecher and von Stryk [15] proposed a 2DSLAM system known as Hector SLAM which performslaser scan matching to obtain a pose estimate and planarmap of the environment. The SLAM system is flexible,scalable, and has been deployed on unmanned groundvehicles (UGV), unmanned surface vehicles (USV), andsmall indoor navigation systems. LOAM (LidarOdometry and Mapping in Real time) [16] is anotherapproach for real-time SLAM but requires a spinningLidar which is more expensive to achieve than a planarLidar approach like Hector SLAM. There have beenseveral studies which built on Hector SLAM to producemore accurate maps of indoor environments usingexternal sensors [17-20]. Khan et al [20] proposed a datadriven method, built on Hector SLAM, which modelslaser intensities and measures the surface reflectivity toaugment a geometric model of the surroundingenvironment.In this study, the method of [15] was built upon toobtain full 3D Lidar mapping. The goal is to achieve amore mapping-focused SLAM compared to navigation[19] or exploration [17]. This study also utilizes lesssensory requirements compared to [13] and [16].
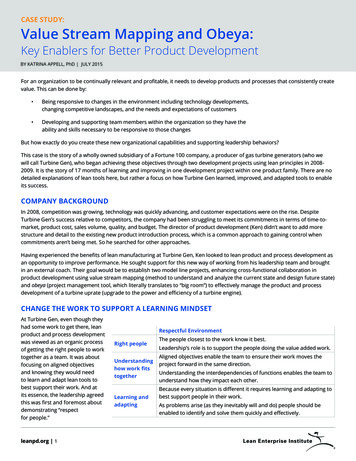
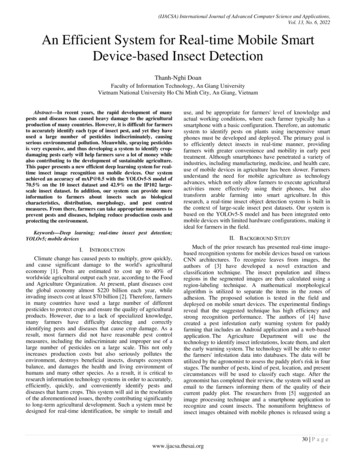
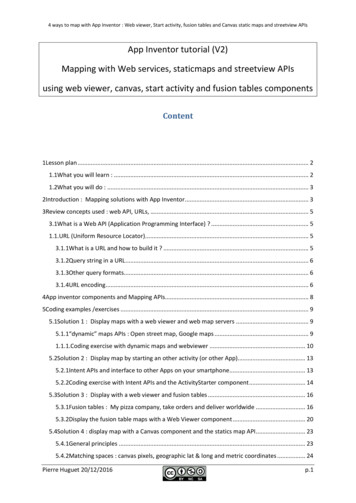
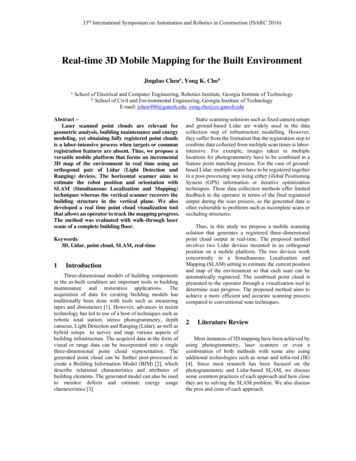
33rd International Symposium on Automation and Robotics in Construction (ISARC 2016)3MethodologyThe hardware setup of our experiments consists of 2Lidar devices as shown in Figure 1. The larger device isa SICK Lidar LMS511 which scans at a 0.5o angularresolution and 50 Hz sample rate. The smaller device is aSICK Lidar LMS151 which scans at a 0.25o angularresolution and 25 Hz sample rate. Each Lidar device onlyscans along a single plane so it is necessary to stack theLidar devices in order to capture full 3D information. TheLidar devices are mounted orthogonally to each other onthe mobile platform where the larger Lidar is used forscanning in the horizontal plane and the smaller Lidar isused for scanning in the vertical plane. The Lidar devicesare connected to an NVIDIA Jetson TK1 processorrunning Ubuntu Linux. The Robot Operating System(ROS) [21] software suite is used to carry out sensor datainput and output, coordinate timing, and perform frametransformation between the two Lidar devices. Pointcloud processing modules from the Point Cloud Library(PCL) [22] are also used for point cloud filtering, storageand visualization.and contains occlusion in the form of furniture whereasmapping a series of corridors presents a challenge interms of scanning long distances and mapping aroundcorners.3.2Motion EstimationThe Lidar data from the horizontal device isprocessed with a SLAM algorithm to estimate the motionof the mobile platform on the horizontal plane. TheSLAM algorithm used in this study is Hector SLAM [15],which performs scan matching between the current Lidarinput and an incrementally built map. The SLAMalgorithm estimates the optimal Lidar pose includingtranslation and rotation to match the current scan with amap of the environment. The SLAM algorithm alsooutputs an occupancy grid map which indicates the gridlocations that are likely to be obstacles and the gridlocations that are unobstructed. An example of thegenerated planar map is shown in Figure 2 for thebuilding corridor experiment. The map shows a series ofgrid lines representing the areas scanned by thehorizontal Lidar and a single thick curve representing thetrajectory of the mobile platform. Light areas of the mapcorrespond to open space that may be traversed by themobile platform whereas dark areas correspond tobuilding structures. The trajectory is updated for eachinput scan from the horizontal Lidar with the calculatedcurrent position and orientation of the mobile platform.Figure 1: Lidar devices used in the hardware setupThe following sections provide details on each stepof the scan process. Each step is processed continuouslyto generate a real time scan output in the form of a pointcloud.3.1Lidar Data CollectionThe data collection process involves walk-throughscans with the mobile platform equipped with two Lidardevices. The two sites utilized for this study are alaboratory room and corridors along a selected buildingfloor since they contain features of interest toqualitatively evaluate the scan output. A laboratory roomsetting is challenging because it is relatively unstructuredFigure 2: Two dimensional map on the horizontal planewith trajectory estimate of the mobile platform. Bluegrid lines indicate scanned areas while the purple curveindicates the trajectory of the mobile platform.
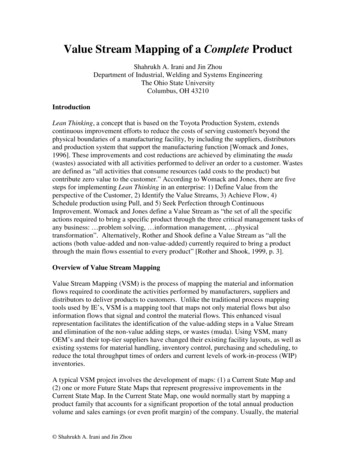
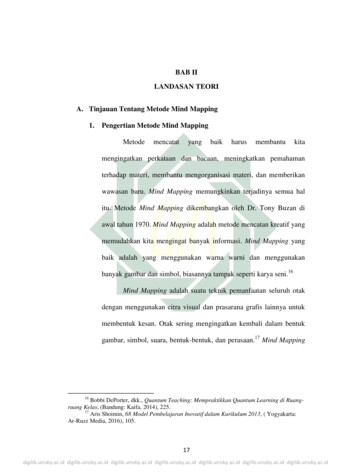
Sensing Technology3.3Scan RegistrationBased on information gathered about the mobileplatform position from the previous step, the vertical scaninput from the second Lidar device can then be registeredonto a global three-dimensional map. For each verticalscan collected, the corresponding timestamp is obtainedfrom the sensor and matched with the nearest timestampfrom the horizontal sensor. Linear interpolation is thenused to obtain the 2D position of the mobile platform atthe time when the vertical scan is collected. In terms ofposition, the current estimate is obtained by fitting alinear motion trajectory through the preceding positionestimates. In terms of rotation, the current estimate isobtained through Spherical Linear Interpolation (SLERP)[23] of the neighboring rotation quaternions. The verticalscan is added to a global map by horizontal translationwith the calculated 2D vector. A three-dimensional mapis thus incrementally built up through the stacking ofmultiple planar scans.3.44ResultsThe proposed technique was applied to two separatescenarios and the scan results in the form of 3D pointclouds are shown below. The first experiment was carriedout in an indoor laboratory room as shown in Figure 4.The ceiling component of the point cloud was filtered outto allow a clearer view of the room contents. The scantrajectory can also be observed in the middle section ofthe point cloud. The scan result demonstrates the abilityof our technique to capture shape profiles from furnituresuch as desks and cabinets even in a relatively clutteredenvironment.Scan VisualizationWe also develop a visualization tool to aid theoperator of the mobile platform in tracking the scanprogress. Figure 3 shows an example of a scan inprogress rendered using OpenGL. The visualizationdisplays a set of larger points representing the currenthorizontal scan and a set of smaller points representingthe registered vertical scans in 3D world coordinates. Thevisualization tool enables the operator to identifyunscanned areas and detect potential occlusions duringthe scan process. This ensures a higher quality and morecomplete point cloud in the final output.Figure 4: Indoor lab mapping resultOn the other hand, the second experiment wascarried out over an entire building floor as shown inFigure 5. The result consists of scans along multiplecorridors on the same floor. The scan result is largelyextensive with a few missing areas corresponding toareas not accessible by the mobile platform. Thisdemonstrates the ability of our technique to capturescans in a large area and register them in a single map.Figure 5: Corridor mapping resultFigure 3: Mapping progress shown in user display.Bold white points indicate horizontal scans whilesmall colored points indicate vertical scans.The accuracy of the generated point cloud mapwas validated against a commercially available laserscanning system [25]. The static Lidar was placed in4 different scan points along the corridor shown inFigure 5 and the fully-registered point cloud was used
33rd International Symposium on Automation and Robotics in Construction (ISARC 2016)as a reference. The reference point cloud is registeredusing manual coarse registration and Iterative ClosestPoint (ICP) fine tuning. Since the scans were taken inan indoor environment, the accuracy metric used isthe Euclidean Root Mean Squared Error (RMSE) ofpoint distances to three selected best-fit planes. Thecalculated Euclidean distance error of the point clouddata is shown in Table 1. The estimated scanning timeinvolved is shown in Table 2. The results indicate thatthe proposed method achieves reasonable accuracy inthe generated point cloud data but involves muchfaster scanning time.Table 1: Euclidean distance error of point cloudRMSE (ourPlaneRMSE (singleLidar) (m)method) ble 2: Scanning time comparison betweendifferent methodsMethodScanning Time (minutes)5Single Lidar302 Lidar mobileplatform (ourmethod)5estimated trajectory by eliminating outliers. We can alsoenforce geometric consistency conditions among verticalscans in a local region such as planarity constraints alongthe floor and walls. Another limitation of the proposedtechnique is non-uniform point cloud resolution in thegenerated 3D map. The point cloud tends to be denser forregions where the mobile platform is moving fast andsmoothly and sparser for regions where the mobileplatform is moving quickly or undergoing a rapid rotation.To overcome this problem, the operator can reduce thevelocity when moving around corners and obstacleswhile obtaining feedback from the visualization tool toensure a high resolution in the point cloud output.Table 3 shows a comparison between our proposedmapping technique with alternative techniques. Forexample, generating a 3D map using pure visual inputinvolves a less expensive hardware setup and is able tooutput color information. However, visual scenereconstruction is prone to scale inaccuracies because theprocess of translating between pixel values and metricunits is complex and rely on accurate camera calibration.A depth camera, such as the Microsoft Kinect [24], isable to output both color and depth information butoperates at lower ranges compared to a Lidar device. Asingle ground-based Lidar, such as the FARO Focus laserscanner [25], is capable of generating point clouds at ahigh resolution, but suffers from the limitation ofrequiring an additional step to register scans taken frommultiple locations. Our proposed technique involvingtwo Lidar devices has the ability to perform automaticregistration of scan outputs in real time, but involves anexpensive hardware setup.Table 3: Comparison between scanning techniquesDiscussionThis section discusses the strengths and weaknesses ofthe proposed technique for generating a threedimensional point cloud map of the built environmentalong with the associated challenges. From the scanresults obtained from two test scenarios, we found thatthe hardware and software setup is capable of performingscan localization and mapping in real time with an updaterate of 25Hz. The visualization tool is also effective inproviding the operator with an informative view of thescan progress.The proposed technique is able to generate detailedpoint clouds due to the high angular resolution of theLidar devices. However, our methodology heavily relieson accurate localization of the mobile platform at eachscan time. The sensor pose estimate may occasionally beerroneous due to jerky motion of the mobile platformwhich causes a mismatch in the scan registration process.One strategy is to employ a median filter to smoothen theTechniqueAdvantagesVisual CameraInexpensivehardware, hascolor informationDepth cameraHas color anddepth informationLimited rangeHigh resolutionoutputRequireadditionalregistration stepReal time,automaticregistrationExpensivehardwareSingle Lidar2 Lidar mobileplatform (ourmethod)6DisadvantagesSensitive tolighting,vulnerable toscaleinaccuraciesConclusionIn conclusion, the results of this study demonstratethe viability of the proposed technique for creating three-
Sensing Technologydimensional maps of the built environment in real timeusing an orthogonal pair of Lidar devices mounted on amobile platform. The proposed technique leverages stateof-the-art SLAM algorithms and scan registration togenerate dense and accurate point cloud outputs. Themain advantages to the proposed technique are the highupdate rate, high output resolution and effective progressvisualization. The proposed technique has the potential tobe utilized in infrastructure surveying applications suchas geometric analysis, building maintenance and energymodeling. For future work, we hope to improve theaccuracy of scan registration on the global threedimensional map. This can conceivably be achievedthrough better handling of sensor error and identifying amore precise motion model for the mobile platform. Wealso consider including color information in the pointcloud output by adding a visual sensor, which could beuseful in providing a better visualization for the pointcloud output as well as helping to identify color featuresin the post-processing stage.[6][7][8][9]7AcknowledgementThis material is based upon work supported by theNational Science Foundation (Award #: CMMI1358176). Any opinions, findings, and conclusions orrecommendations expressed on this material are those ofthe authors and do not necessarily reflect the views of theNSF.References[1][2][3][4][5]C. Eastman, P. Teicholz, R. Sacks, K. Liston,"BIM Handbook – A Guide to BuildingInformation Modeling for Owners, Managers,Designers, Engineers, and Contractors", JohnWiley & Sons, Inc. (2008)L. Barazzetti, F. Banfi, R. Brumana, G.Gusmeroli, M.Previtali, G. Schiantarelli,"Cloud-to-BIM-to-FEM: Structural simulationwith accurate historic BIM from laser scans",Simulation Modelling Practice and Theory,Volume 57, September 2015, Pages 71-87,C. Wang, and Y. Cho. “Automated 3D BuildingEnvelope Recognition in Point Clouds.” ASCE,Proceedings of Construction Research Congress2012, West Lafayette, IN, pp. 1155-1164Akshay Kumar Shastry, Sanjay Anand, V.Chaitra, K. Uma Rao, and D. R. Akshay, "SONAR Validation for SLAM," InternationalJournal of Innovation, Management andTechnology vol. 4, no. 5, pp. 498-501, 2013J. J. Leonard, J. J., and H. F. neous map building and localization foran autonomous mobile robot." in Proceedings ofIEEE/RSJInternationalConferenceonIntelligent Robots and Systems (IROS’91), pp.1442–1447, New York, USA.A. J. Davison, I. D. Reid, N. D. Molton and O.Stasse, "MonoSLAM: Real-Time Single CameraSLAM," in IEEE Transactions on PatternAnalysis and Machine Intelligence, vol. 29, no. 6,pp. 1052-1067, June 2007.F. Leber, A. Irschara, T. Pock, P. Meixner, M.Gruber,S.Scholz,A.Wiechert.Photogrammetric Engineering and RemoteSensing. Vol 76, No.10, pp 1123-1134, 2010D. Roca, S. Lagüela, L. Díaz-Vilariño, J.Armesto, P. Arias, "Low-cost aerial unit foroutdoor inspection of building façades",Automation in Construction, Volume 36,December 2013, Pages 128-135, ISSN 09265805Khoshelham K, Elberink SO. "Accuracy andResolution of Kinect Depth Data for IndoorMapping Applications." Sensors 90/s120201437.Fuentes-Pacheco, J., et al. "Visual simultaneouslocalization and mapping: a survey." ArtificialIntelligence Review 43(1): 55-81Igal M. Shohet, Yehiel Rosenfeld, "Roboticmapping of building interior—precisionanalysis", Automation in Construction, Volume7, Issue 1, December 1997, Pages 1-12, ISSN0926-5805,Velodyne Lidar. http://velodynelidar.com/hdl64e.htmlJung J, Yoon S, Ju S, Heo J. "Development ofKinematic 3D Laser Scanning System for IndoorMapping and As-Built BIM Using ConstrainedSLAM". Passaro VMN, ed. Sensors (Basel,Switzerland). 2015;15(10):26430-26456.H. Jacky Chang, C. S. George Lee, Y. Charlie Huand Yung-Hsiang Lu, "Multi-robot SLAM withtopological/metric maps," Intelligent Robots andSystems, 2007. IROS 2007. IEEE/RSJInternational Conference on, San Diego, CA,2007,pp.1467-1472.S. Kohlbrecher, J. Meyer, O. von Stryk, U.Klingauf. "A flexible and scalable SLAM systemwith full 3D motion estimation." in Proc. of theIEEE International Symposium on Safety,Security, and Rescue Robotics (SSRR’2011), pp.50–55. Kyoto (2011)J. Zhang and S. Singh. "LOAM: Lidar Odometryand Mapping in Real-time". Robotics: Scienceand Systems Conference (RSS). Berkeley, CA,
33rd International Symposium on Automation and Robotics in Construction (ISARC 2016)[17][18][19][20][21][22][23][24][25]July 2014F. Hoeller, A. Konigs and D. Schulz,"Autonomous reconnaissance and surveillance inurban structures - Eurathlon 2013," AutonomousRobot Systems and Competitions (ICARSC),2014 IEEE International Conference on, Espinho,2014, pp. 223-228.Hoeller, F.; Konigs, A.; Schulz, D. "Autonomousreconnaissance and surveillance in urbanstructures - Eurathlon 2013", AutonomousRobot Systems and Competitions (ICARSC),2014 IEEE International Conference on, Onpage(s): 223 – 228Schueftan, D.S.; Colorado, M.J.; MondragonBernal, I.F. "Indoor mapping using SLAM forapplicationsinFlexibleManufacturingSystems", Automatic Control (CCAC), 2015IEEE 2nd Colombian Conference, page(s): 1 – 6S. Khan, D. Wollherr and M. Buss, "ModelingLaser Intensities For Simultaneous Localizationand Mapping," in IEEE Robotics andAutomation Letters, vol. 1, no. 2, pp. 692-699,July 2016.M. Quigley, B. Gerkey, K. Conley, J. Faust, T.Foote, J. Leibs, E. Berger, R. Wheeler, and A. Ng,“ROS: An open-source robot operating system,”in Proc. Open-Source Software Workshop Int.Conf. Robotics and Automation, Kobe, Japan,2009R. B. Rusu and S. Cousins, “3D is here : PointCloud Library ( PCL ),” in IEEE InternationalConference on Robotics and Automation (ICRA),2011.K. Shoemake, "Animating rotation withquaternion curves." in Computer Graphics:Proceedings of SIGGRAPH ’85, 245–254. SanFrancisco: ACMMicrosoft Kinect. http://www.xbox.com/enus/kinect/FARO Focus 3D X. ofocus3d/overview
scanning in the horizontal plane and the smaller Lidar is used for scanning in the vertical plane. The Lidar devices are connected to an NVIDIA Jetson TK1 processor running Ubuntu Linux. The Robot Operating System (ROS) [21] software suite is used to carry out sensor data input and output, coordinate timing, and perform frame