Transcription
Calculation and M&V GuidelinesComEd Energy Efficiency ProgramRetro-Commissioning (RCx) Flex andMonitoring-Based Commissioning (MBCx) OfferingsEffective January 1, 2021 – December 31, 2021Copyright 2021 Nexant Inc. 02.02.21
Contents1 Introduction 4Overview 4Measure Tiers 42 General Requirements 5Calculation Guidelines 5Weather Data 5Determining Peak Demand Savings 5Energy Cost Savings 6Trending Requirements 6Trending Period 6Documentation 6Trend Interval 6Power Measurements Accompanying Trends 7Equipment and Seasonal Data Collection Limitations 7Equipment List 7Planning, Investigation and Verification Data Quality 73 Tier 1 (Large) Measure Requirements 8Applicable IPMVP Guidelines – Tier 1 measures 8Sampling – Tier 1 Measures 8Calculation Input Priority – Tier 1 Measures 94 Tier 2 (Medium) and Tier 3 (Small) Measure Requirements 10Applicable IPMVP Guidelines – Tier 2 and Tier 3 Measures 10Sampling - Tier 2 and Tier 3 Measures 10Use of RCx Offering-Provided Calculators – Tier 2 and Tier 3 Measures 10Calculation Input Priority – Tier 2 and Tier 3 Measures 11Appendix ACalculation Inputs for Common Variables 12Use of this Appendix 12ASHRAE Fan Curves 12Pump and Fan Equations 13Affinity Laws, Fans and Pumps 14Motor Power 15
Contents (continued)Fan Efficiency 16Pump Efficiency 17VFD Efficiency 17Heating and Cooling Equipment Efficiencies 18District Energy 18Appendix BM&V Guidelines for Common Measures 22Use of Guidelines 22Common Measure Descriptions 22
1IntroductionOverviewThis document is for the ComEd Energy Efficiency Program, Nicor Gas, Peoples Gas, and North Shore GasRCx offering (including RCx, RCxpress and MBCx) Service Providers’ use in preparing required RCx offeringdeliverables and supporting calculation files. The goal of this document is to standardize the calculationmethods used by providers and to ensure that those calculation methods provide accurate energy and costsavings information to both the RCx offering and the RCx offering participants. Use of these guidelines will alsodecrease time investment in review and revisions for both Nexant and the Service Provider.Measure TiersThe RCx offering specifies three tiers (or categories) of measures in order to differentiate between large,medium and small measures. Service Provider calculations as well as measurement and verification (M&V)efforts are to be focused on Tier 1 (Large) measures since those measures account for the great majority of theRCx offering’s total impacts. Table 1 summarizes how measures are categorized.Table 1. Measure TiersMeasure CategoryTier 1ThresholdsM&V MethodologyOver 100,000 kWh per yearData collection (spot measurements and/ortrends) is required. Minimum sample size isspecified in Table 3 and Table 4OROver 7,500 therms per yearTier 2Measures below all the Tier 1 thresholdsand above Tier 3 thresholdsBelow 50,000 kWh per yearTier 3ORBelow 3,500 therms per yearUse of RCx Offering-Provided Calculators isstrongly encouraged.Tier 1 data collection requirements applyto measures that do not use RCx OfferingProvided Calculators.Use of RCx Offering-Provided Calculators isstrongly encouraged.Tier 1 data collection requirements applyto measures that do not use RCx OfferingProvided Calculators.Measure tiers are defined at a strategy level. For example, if multiple measures are identified which implementone energy conservation strategy (the same strategy applied to the same type of equipment, e.g. several AHUscheduling measures) and their total impacts are greater than 7,500 therms per year or 100,000 kWh per year,then all of those measures will be subject to the Tier 1 calculation and M&V requirements.4
2General RequirementsThe following guidelines apply to all calculations (Tier 1, Tier 2 and Tier 3 measures) presented for the RCxoffering:Calculation Guidelines Calculate system or equipment baseline energy consumption and monthly peak demand before estimatingenergy savings. Use measured data and/or trended data to support both the pre- and post-installation energy savingscalculations. Guidance and requirements for measured and trended data are provided in this document. Present calculations in a clear, easy-to-follow format. Clearly state and explain assumptions used in the calculation in the Diagnostic and Calculation (D&C) Plan. Consider latent cooling effects wherever cooling savings are identified. Present calculations in spreadsheet format unless written pre-approval is provided by Nexant. Identify the final implementation date for each measure in order to aid in M&V data gathering efforts. Thedate should occur after all fine-tuning and iterations of the measure have been completed.Weather DataAll weather sensitive measures will use Typical Meteorological Year 3 (TMY3) data unless prior approval is givenby Nexant. TMY3 data is available for download from the National Renewable Energy Laboratory here (https://nsrdb.nrel.gov/data-sets/archives.html). Service Providers will use TMY3 data from the weather site nearest tothe building under investigation unless the building is within 8 miles of Lake Michigan; then it’s recommendedthat TMY3 data from Midway or Waukegan be used (whichever is closer) to account for lake-effect weatherconditions. The program standard calculators include TMY3 data for Midway (MDW), O’Hare (ORD), Waukegan(UGN), and Rockford (RFD).The preferred method for analysis is to process data into outdoor air temperature bins of 1, 2, or 5 degrees,depending of level of accuracy required. For example, a change in economizer setpoint from 62 to 68 OATwould require 1 or 2 bins to accurately represent the operating hours.Determining Peak Demand SavingsUsing blended rates for input, both customer average demand savings and ComEd peak demand savings canbe determined by the RCx offering-provided standard calculators. However, in cases where demand rates areavailable, peak demand savings will be determined through two separate metrics:1. Customer Average Demand Savings – The customer’s average demand savings is used to determine themonetary impacts on the customer’s utility bill. To determine when peak billing demand occurs during eachmonth, historical interval data and monthly peak demand data will be reviewed by the Service Provider.For each measure and for each month of the year, determine demand savings which reduce the monthlypeak demand. The customer’s demand monetary cost savings which result from each measure will bedetermined by considering site-specific time-of-day and seasonal demand rates.2. ComEd Peak Demand Savings – Peak demand savings are reported for each measure and defined forsummertime peak capacity evaluation by ComEd.Non-weather-sensitive measures: The ComEd Peak Demand Savings is the expected average demand (kW)reduction between 1 pm and 5 pm Central Standard Time on all business days from June 1 through August31. Business days are defined as all weekdays that are not federal holidays.Weather-sensitive measures: The ComEd Peak Demand Savings is to be estimated by determining theaverage demand savings under the weather conditions in Table 2 and during the same time constraints asdefined for non- weather-sensitive measures (see above).5
Table 2. Weather Conditions for Peak Demand SavingsWeather Conditions 1–5 pmAverage Dry Bulb Temp.Average Relative Humidity8258%Energy Cost SavingsThe Energy Cost Savings is the annual reduction in energy costs through the energy and demand savingsrealized by implementing a measure. This Energy Cost Savings must be estimated using the incremental cost ofenergy and demand (or “next unit” cost in /kWh or /kW) calculated from the customer’s electricity bills. Eligiblecustomers for the RCx offering must use ComEd, Nicor Gas, Peoples Gas or North Shore Gas delivery services;however, a customer may use another supplier. It is the Service Provider’s responsibility to obtain electricity billsfrom the Customer or supplier as appropriate.The incremental cost of energy is calculated by adding up all charges which are billed on a per-kWh basis. Theincremental cost of demand is calculated by summing all charges which are billed on a per-kW basis. Further,the incremental costs of energy and demand may fluctuate based on the time of year, on-peak/off-peak periods,etc. Therefore, it is the Service Provider’s responsibility to select the most appropriate incremental cost(s) to useconsidering when energy savings will be realized for a particular measure. The use of blended rates (i.e., theratio of total annual energy costs ( ) and annual energy consumption (kWh)) for determining energy cost savingsis not permitted.Trending RequirementsTrending of key parameters is typically required (see Calculation Input Priority – Tier 1 Measures and CalculationInput Priority – Tier 2 and Tier 3 Measures sections). The following guidelines apply where trending is required.Note that if there are any safety concerns (e.g. high voltage equipment, dangerous locations, poor equipmentcondition, etc.), the Service Provider should contact Nexant to determine the appropriate data or assumptionsto use in lieu of the preferred data.Trending Period Weather sensitive measures: collect trend data for key parameters covering a range of operatingconditions for a minimum of two weeks. Local outdoor air dry bulb temperature should also be trendedcontemporaneously with other parameters. Non-weather sensitive measures: collect trend data for key parameters covering at least 1 week during typicaloperating conditions.Documentation Provide the RCx offering with raw trend data files for records. Service Provider should analyze and processtrend data into weather bins (2 or 5 degree bins are typical) and this data should be used to calculate energysavings. Note any non-typical operating conditions included in the trend period such as holidays or buildingshut-downs.Trend Interval When trending temperature, humidity, enthalpy, pressure, VFD speed, or light levels: Trend interval of 15 to 60minutes. When trending equipment amperage or on/off status: Trend interval no longer than the cycle time ofequipment.6
Power Measurements Accompanying Trends Three phase power measurements are no longer required by the program because of safety concerns. If the equipment has a VFD or integrated display (e.g. chiller), take a picture of the display showing motorspeed, amps, volts and if available: kW and power factor. The power measurements should be synchronizedwith a known building automation system (BAS) data point, e.g. equipment speed or % load. Collect data at 3operating loads, in order to better understand the relationship of power vs. load. When spot measurements are taken, document date, time of day, value of related BAS data point and outsideair temperature (OAT) in order to synchronize spot measurements with a BAS data point taken at the sametime.Equipment and Seasonal Data Collection LimitationsDue to RCx offering timelines, some data collection limitations may exist for some retro-commissioningmeasures. The following guidelines will be followed by the Service Providers when reporting savings for thesemeasures. This section applies to both heating and cooling measures. This section does not imply flexibility forService Providers to delay the data collection process for other reasons.Equipment ListProvide documentation supporting installed equipment capacity (Motor HP, Tons, CFM, GPM, etc.). The followingsources are listed in order of program preference beginning with the highest preference.1. Picture or PDF copy of mechanical equipment schedules (as-built)2. Pictures of equipment nameplates or equipment list compiled by the customer3. Manufacturer’s technical specifications or cut sheets that best match the equipment make/modelPlanning, Investigation and Verification Data QualityWhere seasonal equipment operation will not allow appropriate data collection as required by the RCx offering,Service Providers will document limitations in the D&C Plans summarizing data collection approach. In the D&Cplans, Service Providers will detail the preferred data collection plan and summarize reasons for any changesto the proposed plan. Service Providers will report savings based on best available data including engineeringassumptions as required.1. BAS trend history2. Data loggers3. Functional tests and equipment spot measurements to simulate post-install operation during VerificationPhase (as feasible and allowed by customer). Provide mechanical drawings with design sequence ofoperation if available4. Screenshots of BAS graphics including setpoints and reset schedules5. Screenshots of control logic or equipment schedulesWith Nexant’s prior approval the following may be considered for Tier 3 measures.6. Operator logs7. Operator interviewPlease note that data quality preferences 1, 2 and 3 are not required for RCx Planning Phase work. However,if this data is easily available, it’s strongly recommended that Service Providers collect trends or performfunctional tests. This will help the Service Provider better understand baseline operating conditions and refineenergy savings calculations which will help the customer fully understand the benefits of ECMs presented in theplanning report.7
3Tier 1 (Large) Measure RequirementsApplicable IPMVP Guidelines – Tier 1 measuresService Providers will generally follow Option A: Retrofit Isolation: Key Parameter Measurement or Option B: AllParameter Measurement of IPMPV Concepts and Options for Determining Energy and Water Savings, Volume1. This document is available online at www.evo-world.org. Trending requirements are provided for specificmeasures in “Appendix B M&V Guidelines for Common Measures” of this document.Sampling – Tier 1 MeasuresWhere a measure involves multiple, similar equipment, sampling is allowed. Equipment is deemed similar forsampling purposes if:1. Equipment type and size are similar, or2. Equipment is controlled in a similar way, or3. Operating schedule and equipment loading are similar; e.g. AHU schedule for different floors, same setbackschedule for different floors, same supply air setpoint for air handling units (AHU), etc.If Service Providers are uncertain about how the equipment is deemed similar in a project, Service Providersshall consult with Nexant.Required sample sizes are categorized in two groups:GroupGroup AGroup BEquipmentLarge or system level equipment - AHUs,chillers, boilers, large pumps, etc.Additionally any equipment withcomplex controlsSmall or zone level equipment - terminalboxes, radiant heaters, small zone levelpumps, etc.Sample Size TableSample Size Confidence andPrecisionTable 380% confidence interval, 20%precision levels (assumingcoefficient of variance equal to0.75)Table 480% confidence interval, 20%precision levels (assumingcoefficient of variance equalto 0.5)If obtaining the required sample size is too cost-prohibitive for a project, Service Providers shall consult withNexant.8
Table 3. Required Sample Sizes (Group A – large or system level equipment)Population SizeRequired Sample 6Total 5-281329-331434-401541-481649-581759-721873-9119 9120Table 4. Required Sample Sizes (Group B – small or zone level equipment)Population SizeRequired Sample 6Total population7-9510-13614-19720-27830-49950-11010 11011Calculation Input Priority – Tier 1 MeasuresThe preference for the source of inputs is provided, beginning with the highest preference.1. Use measured data:a. For key parameters which vary depending on ambient conditions, time of day, etc. In this case, collectat least two weeks of trended data (see “Trending Requirements”) and develop a correlation betweenoutdoor air conditions and measured data in order to predict operation over the course of a typical yearusing TMY3 weather data (see “Weather Data” section).b.For parameters which do not vary significantly or whose value does not greatly impact the energy savings.In this case, take a picture of the VFD showing amps, speed, volts and if available, kW and power factor.9
c. If power can be measured safely, take a spot measurement of true RMS power or use a read-out fromequipment controller or BAS. Use equipment specifications from the equipment manual, nameplate, orequipment schedules.2. Use a default value provided by Nexant. Guidance for calculation inputs for several common variables isprovided in “Appendix A Calculation Inputs for Common Variables” of this document (motor load factor,motor and VFD efficiencies, fan, pump, chilling and heating equipment efficiencies).4Tier 2 (Medium) and Tier 3 (Small) Measure RequirementsApplicable IPMVP Guidelines – Tier 2 and Tier 3 MeasuresService Providers will generally follow Option A: Retrofit Isolation: Key Parameter Measurement of IPMPVConcepts and Options for Determining Energy and Water Savings, Volume 1. This document is available onlineat www.evo-world.org.Sampling - Tier 2 and Tier 3 MeasuresWhere a measure involves many pieces of similar equipment, sampling is allowed. Equipment is deemed similarfor sampling purposes if:1. Equipment type and size are similar, including part load performance if applicable or;2. Equipment is controlled in a similar way, or;3. Operating schedule and equipment loading are similar;Some examples include variable air volume (VAV) boxes located in the same orientation, units serving the sameside of the building (if solar load affects operation), same supply air setpoint for air handling units (AHU), etc.If Service Providers are uncertain about how the equipment is deemed similar in a project, Service Providersshall consult with Nexant. Required sample sizes are specified in Table 5 based on a 70% confidence interval,30% precision levels (assuming coefficient of variance equal to 0.5). The Service Provider shall follow Table 5 toobtain the minimum number of samples.Table 5. Required Sample SizesPopulation SizeRequired Sample2-62 63Use of RCx Offering-Provided Calculators – Tier 2 and Tier 3 MeasuresA RCx offering-provided calculation spreadsheet is available for the 11 measures listed below. For measuresusing the RCx offering-provided calculators, general requirements for spot measurement, trending, andfunctional testing typically do not apply. Instead, Service Providers will follow “Data collection requirements”specified for each measure in the individual measure calculator.1. Implement or optimize air-side, dry-bulb economizer controls; Optimize air-side enthalpy economizercontrols.2. Reduce ventilation (outside air volume)3. Implement duct static pressure reset or reduce static pressure setpoint4. Reset condenser water entering temperature based on outdoor air temperature10
5. Reset chilled water temperature based on outdoor air temperature6. Schedule chilled water or hot water pumps7. Schedule air handler8. Reduce or reset pump differential pressure setpoint9. Schedule lights10. Night setback11. Optimize AHU operation during unoccupied hoursIf a recommended energy conservation strategy meets the measure criteria specified under “Assumptions” inthe individual measure calculator, and if its impacts at the site are less than or equal to 100,000 kWh per year or7,500 therm per year, Service Providers should use a RCx offering-provided calculation tool.If savings are greater than the Tier 1 threshold of 100,000 kWh or 7,500 therms, the standard calculators may beused if trend data is collected, included in the standard calculator tool, and the model parameters are adjustedto replicate trend data collected.Calculation Input Priority – Tier 2 and Tier 3 MeasuresThe preference for the source of inputs is provided, beginning with the highest preference.1. Use measured data:a. For key parameters which vary depending on ambient conditions, time of day, etc. In this case, collectat least two weeks of trended data (see “Trending Requirements”) and develop a correlation betweenoutdoor air conditions and measured data in order to predict operation over the course of a typical yearusing TMY3 weather data (see “Weather Data” section).b.For parameters which do not vary significantly or whose value does not greatly impact the energy savings,take a picture of the VFD showing amps, speed, volts and if available, kW and power factor.c. If power can be measured safely, take a spot measurement of true RMS power or use a read-out fromequipment controller or BAS.2. Use equipment specifications from the equipment manual, nameplate, or equipment schedules.3. Use a default value provided by Nexant. Guidance for calculation inputs for several common variables isprovided in “Appendix A Calculation Inputs for Common Variables” of this document (motor load factor,motor and VFD efficiencies, fan, pump, chilling and heating equipment efficiencies).11
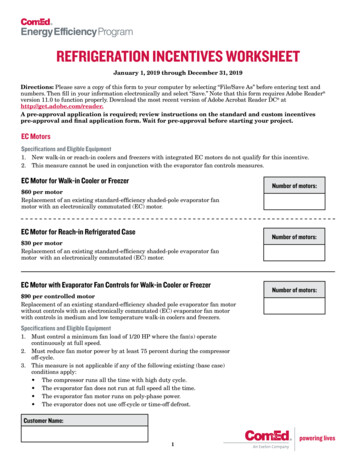
Appendix ACalculation Inputs for Common VariablesUse of this AppendixService Providers will consult this Appendix when the variables included in this Appendix are part of themeasure energy savings calculation. Service Providers will consider site specific operation factors.ASHRAE Fan CurvesWhere estimations of fan power or change in fan power are made, Service Providers will reference the ASHRAEfan curves from ASHRAE 90.1. This reference should be utilized for all HVAC fan measures involving a change inflow. The fan curves are replicated in Figure 1 for reference. Note that for each type of fan and control, there is aminimum turndown ratio, as given in Table 6. An additional table of power fraction as a function of CFM ratio isgiven in Table 7 for reference.Table 6. Minimum Fan Turndown RatiosFan Type – ControlMin. TurndownAir-Foil or Backward – Inclined – Damper Control45%Air-Foil or Backward – Inclined – Inlet Vanes30%Forward-Curved – Damper Control20%Forward – Curved – Inlet Vanes20%Vane-Axial – Variable Pitch Blades20%Variable Speed Drive20%Figure 1. ASHRAE Fan Curves12
Table 7. Fan Power Fraction as a Function of CFM Ratio from ASHRAE Fan CurvesPower FractionAir - Foil orBackward- Inclined- DamperControlForward- Curved- DamperControlForward- Curved Inlet VanesVane - Axial- VariablePitch BladesVariableSpeed Drive0.200.270.220.150.100.250.300.220.150.10CFM RatioAir - Foil orBackward- Inclined Inlet 00.990.991.00Pump and Fan EquationsFor applications where a change in pump or fan operation is being recommended and the ASHRAE fan curvesare not applicable, the Service Provider should use the pump and fan equations to determine savings. Thesecalculations determine pump or fan power based on flow and static pressure developed by the device and thedevice efficiency. The pump and fan equations are provided in Table 8.The Service Provider should use the equations in Table 8 to calculate energy savings when the affected fans andpumps’ operation is pressure dependent before and after the implementation. For example, calculating the fanenergy savings by reducing the duct static pressure in a VAV system.13
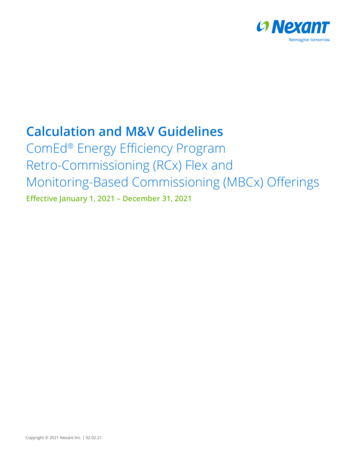
Table 8. Pump and Fan EquationsPump EquationBhp Q̇(gpm) · P(psi)1714 · ηpumpFan EquationBhp Q̇(CFM) · P(in. w.g.)6356 · ηfanConversion from Bhp to kWelectrickWelectric Bhp* 0.746(kW/hp)ηmotorηVFDConversion fromMotor Nameplate HP to kWelectrickWelectric HP* 0.746(kW/hp) *70% load factorηmotorηVFDAffinity Laws, Fans and PumpsIf affinity laws apply to the measure calculation, and the ASHRAE fan curves or the pump or fan equationscannot be used, Service Providers will consult the following guidelines. The affinity laws for fans and pumps areprovided in Table 9 and Table 10 below. In practice, losses within the system decrease savings from theoretical.Service Providers will use an exponent of 2.5 instead of the theoretical value of 3 for the flow vs. powerrelationship. Service Providers will use an exponent of 1.3 instead of the theoretical value of 1.5 for the pressurevs. power relationship. This results in a conservative estimate when calculating energy savings by accounting forother losses within the system.Table 9. Fan Laws11. Assumes constant fan size and gas densitySource: 2008 ASHRAE Handbook: HVAC Systems and Equipment (pg. 20.4, Table 2)14
Table 10. Pump Affinity Laws22. Assumes constant impeller sizeSource: 2008 ASHRAE Handbook: HVAC Systems and Equipment (pg. 43.7, Table 1)Motor PowerService Providers will take true RMS spot power readings on motors involved in calculations. True RMS spotpower measurements will include power factor measurements. Table 11 provides other default values formotors for use in Planning Phase and in limited cases where true RMS power readings are not available in theInvestigation and Verification Phases.Table 11. Other Default ValuesRCx Offering Default Values, MotorsMotor Load Factor70%Heating Equipment Load Factor70%Power Factor85%Service Providers will obtain motor nameplate information for motors involved in calculations. When motorefficiency is not available, motor efficiency is assumed to be Energy Policy Act (EPAct) standard efficiency fromTable 12.15
Table 12. NEMA Threshold Full-Load Nominal Efficiency Values for Energy-Efficient Motors3Nominal Full Load Efficiency for Enclosed �45095.495.4––50095.495.8––3. Motor classes from 1 to 200 hp for 3600, 1800, and 1200 rpm motors are covered by efficiency standardscontained in the Energy Policy Act of 1992.Source: NEMA Standard MG1 (Table 12-10)Fan EfficiencyService Providers will consult the fan performance curves for the fan in consideration to determine theefficiency at given operating conditions.In the Planning Phase, where performance curves are not available, Service Providers will assume fan efficiencyof 60 percent.In the Investigation and Verification Phases, actual performance curves or measurements must be used. Ifunavailable, Service Providers will consult with Nexant.16
Pump EfficiencyService Providers will consult the pump performance curves for the pump in consideration to determine thepump efficiency at given operating conditions.In the Planning Phase, where performance curves are not available, Service Providers will use the valuespresented in Table 13 below.In the Investigation and Verification Phases, actual performance curves or measurements must be used. Ifunavailable, Service Providers will consult with NexantTable 13. Bell & Gossett Pump Centrifugal Pump EfficiencyHead (ft)20GPM406080100hpeff (%)hpeff (%)hpeff (%)hpeff (%)hpeff 7212584150865000––10075125721507720081Source: Bell & Gossett product selection software – Least expensive option is selectedVFD EfficiencyCalculations should assume a turndown percentage limit of 20 percent (at 12Hz) unless manufacturerspecifications indicate otherwise.Calculations involving VFD equipped fans, pumps, or compressors will account for VFD efficiency. Sinceefficiency varies with VFD speed, the efficiency at the most common operating speed will be used. The ServiceProvider will obtain equipment-specific VFD efficiency if available. Where that is not available, the ServiceProvider will use values shown in Table 14.17
Table 14. VFD EfficiencyDesign Speed, %Efficiency088209140946097809810098Heating and Cooling Equipment EfficienciesFor measures which result in a change in chiller efficiency (e.g. chilled water temperature reset), ServiceProviders will measure or trend chiller performance over multiple operating conditions. The largest availablerange of representative operating conditions from shoulder period (spring/fall) loading to peak summerconditions should be obtained.For measures which do not result in a change in the efficiency of the heating or cooling equipment, ServiceProviders will use manufacturer specified part load ratings for the equipment. Service Providers will include areference to the website or specific document source for the rated values used. When this information is notavailable, Service Providers will reference Table 15 or Table 16 where applicable. Part load efficiencies (IPLV)from Table 15 should be selected based on the approximate age of the building and the chiller type. Efficienciesfrom Table 16 should be selected for heating equipment based on the age of the building.District EnergyDistrict Energy is defined as chilled water, steam and/or hot water produced in a remote centralized locationand distributed via a network of pipes. The equipment used to produce District Energy is owned and operatedby another party, who sells District Energy to customer(s).District Energy Calculation Methodology1. Cost Savingsa. Cost savings for District Energy will be calculated based on incremental cost, similar to the electricity andnatural gas cost saving calculations for other Energy Conservation Measures (ECM).2. Energy Savingsa. Enwave Chicago Customers: Chilled water plant efficiency is assumed to be 0.58 kW/ton (excludes customerchilled water pumps).b.For Building to Building, or Building to Tenant District Energy Sales/Campus District Energy, please refer tothe guidance p
The following sources are listed in order of program preference beginning with the highest preference. 1.Picture or PDF copy of mechanical equipment schedules (as-built) 2.Pictures of equipment nameplates or equipment list compiled by the customer 3.Manufacturer's technical specifications or cut sheets that best match the equipment make/model Pl.