Transcription
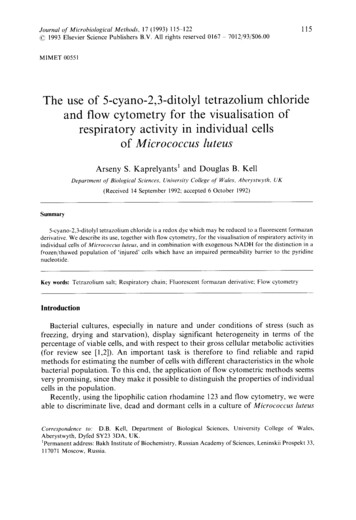
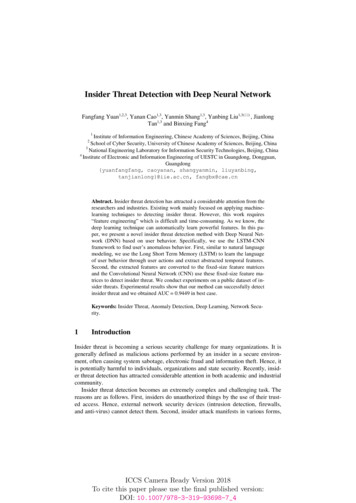
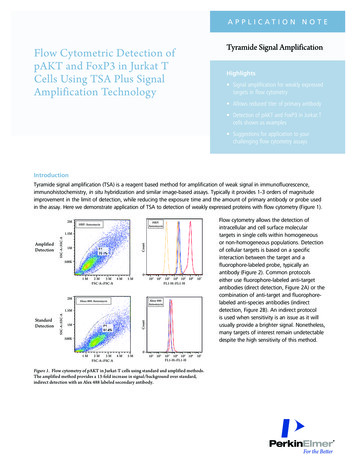
a p p l i c at i o n N o t eTyramide Signal AmplificationFlow Cytometric Detection ofpAKT and FoxP3 in Jurkat TCells Using TSA Plus SignalAmplification TechnologyHighlights Signal amplification for weakly expressedtargets in flow cytometry Allows reduced titer of primary antibody Detection of pAKT and FoxP3 in Jurkat Tcells shown as examples Suggestions for application to yourchallenging flow cytometry assaysIntroductionTyramide signal amplification (TSA) is a reagent based method for amplification of weak signal in immunofluorescence,immunohistochemistry, in situ hybridization and similar image-based assays. Typically it provides 1-3 orders of magnitudeimprovement in the limit of detection, while reducing the exposure time and the amount of primary antibody or probe usedin the assay. Here we demonstrate application of TSA to detection of weakly expressed proteins with flow cytometry (Figure 1).2MHRP:AnisomycinHRP: M500K1M2M2M3MFSC-A::FSC-A4M5M0101 102103 104 105 106FL1-H::FL1-H107103 104 105 106FL1-H::FL1-H107Alexa 488:AnisomycinAlexa 488: 500K1M2M3MFSC-A::FSC-A4M5M0101 102Figure 1. Flow cytometry of pAKT in Jurkat-T cells using standard and amplified methods.The amplified method provides a 13-fold increase in signal/background over standard,indirect detection with an Alex 488 labeled secondary antibody.Flow cytometry allows the detection ofintracellular and cell surface moleculartargets in single cells within homogeneousor non-homogeneous populations. Detectionof cellular targets is based on a specificinteraction between the target and afluorophore-labeled probe, typically anantibody (Figure 2). Common protocolseither use fluorophore-labeled anti-targetantibodies (direct detection, Figure 2A) or thecombination of anti-target and fluorophorelabeled anti-species antibodies (indirectdetection, Figure 2B). An indirect protocolis used when sensitivity is an issue as it willusually provide a brighter signal. Nonetheless,many targets of interest remain undetectabledespite the high sensitivity of this method.
Tyramide Signal Amplification (TSA ) has been successfullyused in imaging applications with cultured cells andtissue sections to multiply, often by orders of magnitude,fluorescent signals that otherwise fall under the detectionlimit of the assay. Signal amplification is generated by anenzyme that is conjugated to either the target-specific probeor more commonly to a secondary anti-species antibody.Horseradish peroxidase (HRP) is the catalyst for signalamplification. In the presence of peroxide, HRP oxidizesthe amplification reagent into a short-lived radical formthat reacts with macromolecules in close proximity to theenzyme, preferentially with tyrosine residues of proteins. Theamplification reagent can be conjugated to a fluorophoreor biotin. While the deposition of fluorophore-conjugatedamplification reagent directly amplifies the signal, biotinconjugates require subsequent incubation with fluorophoreconjugated streptavidin. Figure 2 illustrates how signalsare generated with the standard direct (A) and indirect(B) detection methods, and with fluorophore-conjugatedamplification reagent (C) or biotin-conjugated amplificationreagent (D).TSA has been successfully used in numerous cytogenetic andimaging applications (Bobrow et al., 2001). The use of TSAin flow cytometry is less exploited but bears great potentialfor hard to detect targets (Clutter et al., 2010). Thisapplication note provides guidelines for the use of TSA inflow cytometry applications and describes the optimizationof TSA-amplification protocols for two intracellular targetsthat have been deemed difficult to detect, phospho-AKT(pAKT) and FoxP3. The results further demonstrate theapplicability of TSA for flow cytometry and show that theamplification increases the net signal by several fold relativeto a signal produced with a standard indirect method.Guidelines for Developing Signal AmplificationProtocols for Flow CytometryWhen using signal amplification in flow cytometry, it iscritical to minimize non-specific interactions and optimizedilutions of all detection reagents. For best results, eachstep of the amplification protocol should be optimized foreach target.Figure 2. Antibody-based detection of cellular targets: standard vs. amplified approaches. In the standard model, the target is detected using a fluorophorelabeled anti-target antibody (direct detection; A) or an anti-target and fluorophore-labeled anti-species antibody (indirect detection; B). The fluorophoreshown in this model is Alexa 488 which is excited at 490 nm while fluorescence emission occurs at 520 nm (FL1-H). In the amplification model, the target isdetected using an anti-target and HRP-labeled anti-species antibodies. In the presence of peroxide, HRP oxidizes tyramide converting it into short-lived highlyreactive free radicals that covalently bind to cellular macromolecules in the vicinity of the target, preferentially to tyrosine residues of adjacent proteins. Signalamplification occurs through deposition of multiple labeled amplification reagent molecules, with direct measurement using fluorophore-labeled reagent(e.g. TSA-Plus-Fluorescein; C) or indirect measurement with fluorophore-labeled streptavidin in combination with biotin-labeled TSA (D). Excitation occurs at490 nm and emission at 520 nm (FL1-H).2
1. Fixing Cells and Inactivating Endogenous PeroxidasesFor the detection of intracellular targets, cells are fixedand endogenous peroxidases are inactivated. The keyparameters to control for reproducible results are: samplecollection, type, volume and concentration of fixationreagent, and fixation time. Cell culture conditions must becarefully controlled as well, as this could negatively affectsample preparation and target detection. Following thefixation of cells, inactivation of endogenous peroxidasesmay be required as residual activity could cause nonspecific background. Formaldehyde, paraformaldehyde andmethanol are common cell fixing reagents for flow cytometrysamples. Inhibition of endogenous peroxidase activity can beperformed with hydrogen peroxide or HCl. The inactivationof endogenous peroxidase is typically performed using H2O2concentrations ranging from 1 to 3 percent. We have foundthat fixing cells and inactivating endogenous peroxidases canbe done in one step using a mix of ice-cold methanol andH2O2. Jurkat cells can be fixed as follows for the detectionof pAKT: 1) remove culture media by centrifugation, 2)resuspend cells at a concentration of 4 10e6 cells/mLand gently mix in ice-cold methanol containing 3% H2O2,3) incubate cells at -20 C for at least 30 min. Fixed cellscan be stored at -20 C until use.2. Probing the TargetFixed cells first need to be permeabilized for the detectionof intracellular targets. Although methanol will permeabilizethe cells, we have found that, for pAKT detection, theaddition of a permeabilizing agent provided optimal results.Triton X-100 was the detergent of choice and was added tothe blocking reagent at a concentration of 0.1%. A blockingstep is critical to reduce the background from non-specificbinding of antibodies. A combination of PerkinElmer ’sHiBlock buffer supplemented with EDTA and 50% FBS(used to dilute the antibodies) gave the best results forpAKT detection. The concentration of the blocking reagentshas an impact on the detection signal. The presence ofendogenous biotin must be blocked by adding neutravidinto the blocking solution when TSA Plus Biotin amplificationreagent is used for target detection. As a general guideline,we also recommend testing several target-specific antibodiesand titers. As the signals are greatly amplified with TSA, theoptimal antibody titers are typically much lower than thoseneeded for a standard detection protocol.3. Amplifying and Detecting the SignalThe signal amplification step is initiated by incubating thecells with TSA amplification reagent. The amplificationreaction proceeds rapidly and is typically complete within10 minutes. We recommend titrating the amplificationreagent for optimal results. A thorough wash stepfollowing the amplification reaction is important tominimize background. In the case of TSA Plus Biotinamplification reagent, a detection reagent such asstreptavidin-phycoerythrin (streptavidin-PE) is addedafter amplification to generate a fluorescent signal.This reagent should also be titrated for optimal results.Samples can be read on any flow cytometer. The resultspresented herein were generated on an Accuri C6 flowcytometer and analyzed with FlowJo software.To simplify the protocol, several steps (i.e. fixation,permeabilization, peroxidase inactivation, blocking, biotinquenching) were combined during the optimization processresulting in a shorter protocol. Figure 3 provides a step bystep comparison of standard vs. amplified protocols beforeand after optimization.Figure 3. Standard and amplified flow cytometry sample preparation protocols before and after optimization. (Ab Antibody).3
In order to assess assay performance, several controls should be included in each experiment as shown in Table 1.Table 1. Suggested controls for the indirect amplified and standard detection methods.ControlReagents addedFlow cytometry signalDescription in graphsSpecific antibody bindinganti-target antibody anti-species HRP antibody amplification reagent detection reagentTarget-specific signalNon-specific signal:anti-target antibody anti-species antibody amplification reagent autofluorescence of cellsa-target Ab(pos ctrl 1)Non-specific antibodybindingnon-specific isotypic antibody anti-species HRP antibody amplification reagent detection reagentNon-specific signal:isotypic antibody anti-species antibody amplification reagent autofluorescence of cellsisotypic Ab(pos ctrl 2)Residual endogenousamplification reagentTSA catalyst detection reagentNon-specific signal:amplification reagent autofluorescence of cellsno Ab(neg ctrl 1)Indirect Amplified DetectionAutofluorescencecells onlyAutofluorescence of cellsautofluorescence(neg ctrl 2)Indirect Standard DetectionSpecific antibody bindinganti-target antibody anti-species Alexa 488 antibodyTarget-specific signalNon-specific signal:anti-target antibody anti-species antibody autofluorescence of cellsa-target Ab(pos ctrl 1)Non-specific antibody bindingNon-specific signal:isotypic antibody anti-species antibody autofluorescence of cellsisotypic Ab(pos ctrl 2)non-specific isotypic antibody anti-species Alexa 488 antibodyAutofluorescencecells onlyAutofluorescence of cellsautofluorescence(neg ctrl 2)Table 2 provides a summary of critical parameters tested while optimizing the protocols developed for amplified detection ofpAKT and FoxP3. The observations described below are based on the use of Jurkat T cells and findings may differ for othercell lines and targets.Table 2. Critical assay steps for TSA-amplified flow cytometric detection.Step 3Fixation and peroxidase inactivationRecommendation For the fixation step, it is important to preserve integrity of cells, improve sedimentation and reduce aggregation:this is usually accomplished with alcohol or paraformaldehyde (HCHO). A solution of methanol (MeOH) wasproven to be optimal in the assays developed. Better cell sedimentation and less aggregation were observed withMeOH while 3% HCHO in PBS pH 7.4 resulted in loss of cells during washes. Methanol-fixed cells can be stored at-20 C for future use.Peroxidase inactivation is essential to reduce non-specific background. The best additive to reduce endogenousperoxidase activities in cells (giving lowest background) is 3% H 2O2 in methanol. 0.5% NaN3 and 0.02 M HCl(in methanol) were found to be efficient as well.4
Step 4Permeabilization, Blocking, Biotin quenchingRecommendation Cell permeabilization is required to ensure target accessibility when working with intracellular targets: 0.1% TritonX-100 was successfully used for this step.Blocking reduces non-specific background and cell aggregation. Good blocking solutions are 10 mM EDTA inHiBlock Buffer*; 5% FBS in PBS pH 7.4; 0.5% Blocking Reagent*. Note that HiBlock and FBS may cause some cellaggregation, but were found to result in lower background signals.Biotin quenching with 0.1 mg/mL Neutravidin also helps reducing non-specific background.Steps 6 and 7Antibody IncubationRecommendation During incubation with antibodies, the goal is to improve specific antibody binding and reduce non-specific binding.The following parameters need to be optimized:Selection of antibody diluent: 50% FBS in PBS pH 7.4 or 0.5% Blocking Reagent* in PBS pH 7.4. We observed anincrease of specific signal and a slight increase of non-specific binding of secondary antibody with 50% FBS, but overall thesignal-to-background (S/B) ratio was higher.Antibody concentration (perform a titration experiment)Incubation period (perform a time-course, e.g. from 30 to 90 min) – critical for antibodies with low binding affinity.Step 10Amplification reagent (TSA, TSA Plus Biotin) additionRecommendation Amplification reagents might induce some non-specific binding; therefore it is crucial to reduce background signal asmuch as possible. To accomplish this, the following parameters have to be optimized:Selection of the Amplification reagent diluent: best results were obtained with 1X Plus Amplification Diluent*.Note: Other diluents tested (PBS, 1.5 M NaCl or 20 mM borate, 0.5-1 M NaCl (0.5% casein), Ficoll-Paque)resulted in lower background and specific signal compared to 1X Plus Amplification Diluent. High salt concentrationsamplify this effect as well as increase cell aggregation.Amplification reagent concentration (titrate from 0.1 to 50 µg/mL): 5 µg/mL (1:200 dilution of standard stocksolution) has been shown to be optimal.Step 12Detection reagent (Streptavidin-Fluorophore) additionRecommendation The two following parameters should be tested:Diluent formulation (usually wash buffer): 0.1% Tween-20, 0.1% BSA in PBS pH 7.4 (pAKT) orPermeabilization Buffer** (FoxP3)Detection reagent concentration (titrate from 0.5 to 50 µg/mL): 5 µg/mL has been shown to be optimal.WashesRecommendation Washes are performed to reduce non-specific background (especially due to amplification reagent binding).Always keep cells in permeabilized status to ensure penetration of wash buffer constituents into the cells.Recommended wash buffers are:Pre-TSA wash buffers:0.1% Tween-20, 0.1% BSA in PBS pH 7.4 (pAKT)Permeabilization Buffer** (FoxP3)Post-TSA wash buffers:0.5% dextran, 0.1% Tween-20, 0.1% BSA in PBS pH 7.4 (pAKT)Permeabilization Buffer** (FoxP3)Note: Additives (0.5 M NaCl, 10% dextran, 10% Ficoll-Paque, 2.5% pluronic), reducing agents (50 mM TCEP, 50 mMDTT, 5% β-mercaptoethanol) (in Tween/BSA/PBS buffer) and 3-6 M urea were also tested and resulted in a reductionof the non-specific background. However, the specific signal was impacted as well resulting in little or no amplification.The number of wash steps should be optimized to efficiently remove excess reagents (non-covalent binding). Notethat in the protocols shown here, the wash step between the antibodies could be omitted. However, this couldimpact the background for antibodies with poor specificity.Bold text chosen method/buffer for corresponding step* PerkinElmer reagent** eBioscience reagent5
Flow Cytometry Amplified Assays for pAKT and FoxP3 TargetsTwo intracellular targets, the cytoplasmic kinase phospho-AKT (pAKT), and the nuclear transcription factor FoxP3, bothexpressed in Jurkat T cells were detected using a standard indirect protocol and TSA-amplified protocol. To ensurerepresentative and reproducible results, only cells in exponential growth phase were used. Thus, optimization of theprotocols was carried out with minimal impact of cell culture on target expression. In addition, modulation of AKTphosphorylation status at Ser473 using a known inhibitor and inducer was carried out to validate that pAKT detectionand signal amplification were specific. Development assays were performed using pre-fixed cells stored at -20 C with theexception of cells treated with the AKT phosphorylation modulators, which were fixed and used immediately.Both the specific and the background absolute signals obtained were systematically greater with the amplified protocolthan with the standard indirect protocol. Signal-to-background (S/B) ratios were used to determine the fold amplificationto allow comparisons between the two methods. The signal (S) was generated with the target-specific antibody whilethe background (B) used to calculate the ratios was the signal generated with the isotypic control (refer to Table 1for definitions). For comparison purposes, standard and amplified protocols were performed in parallel. The net foldamplification generated with TSA, was calculated by dividing the S/B generated with the amplified protocol by the S/Bgenerated with the standard indirect protocol. Protocol parameters that positively affected this ratio were consideredimportant for protocol optimization.Detection of pAKTThe sample preparation protocol for flow cytometric detection of pAKT was developed according to the guidelinespresented in Table 2 resulting in the optimized procedure shown in Figure 4.Figure 4. pAKT detection with the signal amplification (HRP/TSA Plus Biotin) and indirect standard protocol (Alexa 488). (WB: Wash Buffer, DWB:Dextran supplemented Wash Buffer, FCM: flow cytometry).6
The experiments presented in this application note include the comparison of amplification reagents (Figure 5), titration(Figures 6 and 7) and modulation experiments (Figure 8).As shown in Figure 5, the TSA amplification protocol for the detection of pAKT produced a greater S/B than the standardindirect protocol. While TSA-Fluorescein (i.e. direct fluorescence labeling) resulted in the highest absolute fluorescencesignal, the S/B ratio obtained with TSA Plus Biotin/streptavidin-phycoerythrin (i.e. indirect fluorescence labeling) was foundto be significantly superior (103.9 versus 27.9). The TSA-Fluorescein reagent produced a net 4.8 fold S/B increase whilethe TSA Plus Biotin reagent produced a net 17.9 fold S/B increase over the standard indirect protocol. This experiment wascarried out using the optimized protocol (Figure 4). Fluorescein and phycoerythrin emit maximal fluorescence at 520 nm and575 nm, respectively and are therefore recorded in different channels; FL1-H for fluorescein and FL2-H for phycoerythrin.A)B)C)Figure 5. pAKT detection – Comparison of amplification reagents. The HRP amplification model was tested using 2 µg/mL amplification reagent (TSA-Fluoresceinand TSA Plus Biotin) and 9 µg/mL detection reagent (streptavidin-phycoerythrin; TSA Plus Biotin model), respectively. A) FlowJo dot plot analysis (specific signal);B) FlowJo fluorescence signal analysis (FL1-H, TSA-Fluorescein, Alexa 488; FL2-H, TSA Plus Biotin); C) Comparative analysis of fluorescence signals (FL1-H,FL2-H) and signal-to-background ratios for each model, S/B ratios obtained for each model versus the Alexa 488 reference model (fold increase HRP/Alexa 488).7
Two different detection reagents, Streptavidin-Phycoerythrin (SA-PE) and Streptavidin-Fluorescein (SA-Fluo) were compared ina titration experiment (0.5-10 µg/mL) while using TSA Plus Biotin at a fixed concentration (5 µg/mL) (data shown in Figure 6;SA-Fluo only). Fluorescence signals were recorded at 575 nm (FL2-H) for SA-PE and 520 nm (FL1-H) for SA-Fluo and Alexa488, respectively. In both cases, the fluorescence signal increased with the reagent concentration and maximal S/B ratioswere obtained at 5-10 µg/mL of reagent. Higher signals were detected with SA-Fluo. However, S/B ratios were approximately1.7 fold lower compared to SA-PE. Since Alexa 488 was the selected fluorophore in the standard indirect assay used forcomparison, the following experiments were carried out using SA-Fluo which has a similar fluorescence spectrum.A)B)C)Figure 6. pAKT detection (HRP/TSA Plus Biotin) – Streptavidin-Fluorescein titration. The detection reagent SA-Fluo was titrated at 0.5-10 µg/mL(5 µg/mL TSA Plus Biotin) (HRP/TSA Plus Biotin amplification model). A) FlowJo dot plot analysis (specific signal); B) FlowJo fluorescence signal analysis(FL1-H); C) Comparative analysis of fluorescence signals (FL1-H) and signal-to-background ratios, S/B ratios obtained for each SA-Fluo concentration versusthe Alexa 488 reference model (fold increase HRP/Alexa 488).8
In the final optimization experiment, TSA Plus Biotin was titrated to determine its optimal concentration for pAKT detectionin Jurkat cells (0.1-20 µg/mL) (Figure 7). Although fluorescence signal increased with the TSA Plus Biotin concentration, themaximum S/B ratio was determined to be 5 µg/mL (as previously used). The fold increase compared to the reference model(8.4) was slightly lower than shown in Figure 7 (11.4) which was due to variations of the S/B ratios of the reference assay.Finally, a modulation experiment was carried out to validate the specificity of the signal amplification response. Twomodulators were selected, BAG 956 and Anisomycin. BAG 956 is known to inhibit Thr308 and Ser473 phosphorylationon pAKT (Weisberg et al., 2008) and Anisomycin to activate multiple serine/threonine kinases and increase Ser473phosphorylation (Hemi et al., 2002). The effect of these drugs was expressed as S/B of treated cells divided by S/B of mocktreated (DMSO) or untreated (culture media) cells, respectively, to reflect fold signal increase or decrease.A)B)C)Figure 7. pAKT detection (HRP/TSA Plus Biotin) – TSA Plus Biotin titration. The amplification reagent TSA Plus Biotin was titrated at 0.1-20 µg/mL(HRP/TSA Plus Biotin amplification model). A) FlowJo dot plot analysis (specific signal); B) FlowJo fluorescence signal analysis (FL1-H); C) Comparativeanalysis of fluorescence signals (FL1-H) and signal-to-background ratios, S/B ratios obtained for each TSA Plus Biotin concentration versus the Alexa 488reference model (fold increase HRP/AL488).9
Cells were treated with 10 µM of each modulator at 37 C for 2 hours before proceeding with the sample preparationprotocol. Control samples were mock treated with DMSO (no modulator) or left untreated in culture media. The flowcytometry data of this experiment are shown in Figure 8 and confirm the specificity of pAKT detection. A significant signaldecrease was observed following BAG 956 treatment while a signal increase was observed in the presence of Anisomycin.In both cases, the assay window was markedly improved using the amplification protocol.These data show that the TSA-amplified protocol allows for better signal discrimination between samples treated withtarget modulators.A)B)C)D)Figure 8. pAKT detection (HRP/TSA Plus Biotin) – pAKT modulation. pAKT expression was modulated using a known inhibitor (BAG 956) and inducer(Anisomycin) as well as controls (DMSO, culture media) (incubation with 10 µM modulator, DMSO for 2 h at 37 C). A) FlowJo dot plot analysis (specificsignal); B) FlowJo fluorescence signal analysis (FL1-H); C) Comparative analysis of fluorescence signals (FL1-H) and signal-to-background ratios, S/B ratiosobtained for each modulation scenario versus the Alexa 488 reference model (fold increase HRP/AL488); D) Effect of drug on pAKT detection (S/B of treatedvs. untreated cells).10
Detection of FoxP3Initial studies demonstrated that the protocol optimized for pAKT was not optimal for FoxP3 (data not shown). Consistentwith the literature (Law et al., 2009) one of the most critical parameters was buffer selection for various processing steps.Different FoxP3 antibodies and buffer kits were tested and the anti-FoxP3 (clone PCH101; rat) and Permeabilization Bufferfrom eBioscience were selected for the final protocol as shown in Figure 9. The optimal secondary antibody was labeledwith DyLight 488, which emits at the same wavelength as Alexa 488 previously used for the pAKT assay (520 nm).Figure 9. FoxP3 detection with the signal amplification (HRP/TSA Plus Biotin) and indirect standard protocol (DyLight 488).11
The experiments shown here include antibody (Figure 10) and amplification reagent titration experiments (Figures 11 and 12).The first optimization experiments focused on the FoxP3 antibody incubation steps. Anti-FoxP3 and anti-rat antibodieswere prepared in Permeabilization Buffer supplied by eBioscience while adapting the incubation duration to the suppliersrecommendations. At the same time, to aid reagent penetration into the cells, Permeabilization Buffer was used to dilutethe detection reagent (Streptavidin-Fluorescein) as well as perform all wash steps. The titration of anti-FoxP3 antibody(0.2-1 µg/mL) resulted in the highest signal and S/B ratio at 1 µg/mL as shown in Figure 10 and therefore the followingexperiments were carried out at this concentration.A)B)C)Figure 10. FoxP3 detection – FoxP3 antibody titration. The HRP amplification model was tested using 0.2-1 µg/mL FoxP3 antibody, clone PCH101(eBioscience). A) FlowJo dot plot analysis (specific signal); B) FlowJo fluorescence signal analysis (FL1-H); C) Comparative analysis of fluorescence signals(FL1-H) and signal-to-background ratios for each model, S/B ratios obtained for each model versus the DyLight 488 reference model (fold increase HRP/DyLight 488).12
In the following experiment, Streptavidin-Fluo was titrated (0.5-50 µg/mL) to determine the concentration yielding the bestsignal and S/B ratio. TSA Plus Biotin was used at a fixed concentration of 5 µg/mL (Figure 11). While the signal continued toincrease with the detection reagent concentration, the highest S/B ratios were recorded at 2-10 µg/mL with a maximum of21.8 at 5 µg/mL. This concentration was therefore selected for the following optimization steps.A)B)C)Figure 11. FoxP3 detection (HRP/TSA Plus Biotin) – Streptavidin-Fluorescein titration. The detection reagent SA-Fluo was titrated at 0.5-50 µg/mL(HRP/TSA Plus Biotin amplification model). A) FlowJo dot plot analysis (specific signal); B) FlowJo fluorescence signal analysis (FL1-H); C) Comparativeanalysis of fluorescence signals (FL1-H) and signal-to-background ratios, S/B ratios obtained for each SA-Fluo concentration versus DyLight 488 referencemodel (fold increase HRP/DyLight 488).13
In the final experiment, the optimal TSA Plus Biotin concentration was determined in a titration experiment using 0.5-50 µg/mLamplification reagent (Figure 12). Again, fluorescence signals increased with the TSA Plus Biotin concentration, but themaximum S/B ratio was determined to be 5 µg/mL (as previously used). The fold increase in reference to the DyLight 488model (4.5) could be reproduced compared to the previous experiments indicating good assay robustness. In comparison,the signal using the TSA Plus Biotin amplified protocol was 21.8 fold above background. This is a net signal amplification of4.8 fold above the signal generated by the standard protocol.A)B)C)Figure 12. FoxP3 detection (HRP/TSA Plus Biotin) –TSA Plus Biotin titration. The amplification reagent TSA Plus Biotin was titrated at 0.1-20 µg/mL(HRP/TSA Plus Biotin amplification model). A) FlowJo dot plot analysis (specific signal); B) FlowJo fluorescence signal analysis (FL1-H); C) Comparativeanalysis of fluorescence signals (FL1-H) and signal-to-background ratio, S/B ratios obtained for each TSA Plus Biotin concentration versus DyLight 488reference model (fold increase HRP/DyLight 488).ConclusionsIn this study, we analyzed the performance of TSA Plus Biotin amplification reagent for the flow cytometric detection oftwo intracellular targets in Jurkat T cells, pAKT and FoxP3. We showed that the amplified system significantly improved thesignal and S/B ratio for both targets. A modulation experiment carried out for pAKT confirmed the specificity of the signalsgenerated. Signal amplification in flow cytometry applications allow for detection of targets expressed at low levels and thatmay escape detection with the standard staining method.14
To effectively apply signal amplification technology, the sample preparation protocol should be optimized for each targetCritical parameters were found to be, for the most part, the same as for a standard indirect protocol: fixation method, theselection of primary antibodies (for specificity), their concentration in the assay, the buffers used for reagent preparation aswell as washes between the incubation steps. While the pAKT protocol was optimized with buffers developed in house, theFoxP3 assay optimization focused on the use of commercially available antibodies and buffer pairs, showing compatibilityof TSA with different reagents. The amplified assay is a powerful solution for users with an interest in measuring theexpression of difficult to detect targets and for those needing to save rare and expensive antibodies.Materials and EquipmentProductCompanyProduct No.Jurkat cellsATCCTIB-152 RPMI Medium 1640 (1X)Invitrogen 11875Fetal Bovine SerumWisent 080150Akt1 phospho (pS473), clone EP2109Y (rabbit)EpitomicsRabbit IgG, whole moleculeJackson ImmunoResearchAnti-human FoxP3, clone PCH101 (rat IgG2a, K)eBioscience 14-4776Rat IgG2a K isotype controleBioscience14-4321Anti-rabbit IgG (goat), HRP labeledPerkinElmer, Inc.NEF812001EAAnti-rat IgG (goat), HRP labeledJackson ImmunoResearch112-035-167Alexa Fluor 488 goat anti-rabbit IgGInvitrogen DyLight 488 goat anti-rat IgGJackson ImmunoResearch 2118-1 011-000-003A-11008 112-485-167TSA Plus Biotin Kit with TSA Plus Biotin Amplification ReagentPerkinElmer, Inc.and 1X Plus Amplification DiluentNEL749A001KT orNEL749B001KTStreptavidin FluoresceinPerkinElmer, Inc.NEL720001EABAG 956Tocris 3606AnisomycinTocris 1290DimethylsulfoxideSigma-Aldrich Hydrogen peroxide solution (30%)Sigma-AldrichMethanolFisher ScientificD2650216763 AlphaLISA HiBlock Buffer
in flow cytometry is less exploited but bears great potential for hard to detect targets (Clutter et al., 2010). This application note provides guidelines for the use of TSA in flow cytometry applications and describes the optimization of TSA-amplification protocols for two intracellular targets that have been deemed difficult to detect .