Transcription
TEXAS HEALTHCARE TRANSFORMATION ANDQUALITY IMPROVEMENT RENEWAL EVALUATION1115 Medicaid Waiver Demonstration Renewalin Texas DY7–DY11Interim ReportFor internal use only. Please do not share this confidential report with anyone.David WashburnTodd LerouxMichael MorriseyBob OhsfeldtEva ShippChad SmithAbigail SpiegelmanAmber TruebloodBen UkertQi ZhengNikita WagleSophia AnyatonwuHye-Chung Kum**Corresponding author, please address correspondence to kum@tamu.edu.JANUARY 12, 2022SCHOOL OF PUBLIC HEALTHTHE TEXAS A&M UNIVERSITY
Texas 1115 Medicaid Waiver Demonstration Renewal Evaluation Interim ReportTABLE OF CONTENTSTexas healthcare Transformation and Quality Improvement Renewal Evaluation . 1I. Executive Summary . 1Background . 1Evaluation Questions. 2Delivery System Reform Incentive Payment (DSRIP) Findings. 3Uncompensated Care (UC) . 4Medicaid Managed Care (MMC). 5Quality-Based Payment Systems . 6Health Care System for the MLIU Population . 7Conclusions and Implications . 7II. The Delivery System Reform Incentive Payment (DSRIP) Program. 9Introduction. 9Methodology.10Key Findings.18Limitations .33Conclusions and Implications .35References .37III. Uncompensated Care .39Introduction.39Methodology.41Key Findings.44Limitations .48Conclusions and Implications .48References .50IV. Medicaid Managed Care.52Introduction.52Methodology.53Key Findings.57Limitations .71Conclusions and Implications .72References .74V. Quality-Based Payment Systems.76Introduction.76Methodology.76Key Findings.78Limitations .85Conclusions and Implications .85References .87VI. Health Care System for the MLIU Population.88Introduction.88Methodology.89Key Findings.91References .96VII. Plans for Summative Report .98Appendix A. Acronyms.101Appendix B. DSRIP Technical Details .1051. Hypothesis 1.1 Centralization Measure .1052. Hypothesis 1.2 Study Design.1053. Hypothesis 1.2 Sample.108Population Informatics Lab, The Texas A&M Universityi
Texas 1115 Medicaid Waiver Demonstration Renewal Evaluation Interim Report4. Full Results: Hypothesis 1.1 Collaboration among Providers .1145. Full Results: Hypothesis 1.2 Medicaid Clients with Diabetes .1266. Detailed Results: Hypothesis 1.3 Quality-Related Outcomes.1367. Unweighted Results for Hypothesis 1.3: Quality-Related Outcomes .147Appendix C. Uncompensated Care Technical Appendix .1501. Measuring UC Cost .1502. External Data Source Variables .1503. Detailed Results .151Appendix D. Medicaid Managed Care Technical Details .1691. Analyzing Annual Measures .1692. Full MMC Results .1713. Sensitivity Analysis .2014. Updated Measure 3.1.4 Definition.204Appendix E. Quality-Based Payment Systems Technical Details .2051. Applied APM Framework .2052. Detailed Results .206Appendix F. Health Care System for the MLIU Population Technical Details .2201. Budget Neutrality Methods Details.2202. Budget Neutrality Full Results.222Appendix G. Evaluation Design Plan Revision v5.1 .234Population Informatics Lab, The Texas A&M Universityii
Texas 1115 Medicaid Waiver Demonstration Renewal Evaluation Interim ReportLIST OF FIGURESFigure I.1 Demonstration Timeline Overview. 2Figure II.1 Texas’ 20 DSRIP Regional Healthcare Partnerships (RHPs) and RHP TierMap. .10Figure II.2 Collaboration between DSRIP Providers. .21Figure II.3 Collaboration between DSRIP and Non-DSRIP Providers.21Figure II.4 DSRIP Diabetes Claims Analysis Sample Flow Diagram. .23Figure II.5 Love Plot of Covariate Balance. .24Figure II.6 Overall Provider Achievement for A1-508 Rate of ED Visits for Diabetes. .27Figure II.7 Overall Provider Achievement for A2-509 Rate of ED Visits for CHF, Angina,and Hypertension. .27Figure II.8 Overall Provider Achievement for H2-510 Rate of Emergency DepartmentVisits for Behavioral Health and Substance Abuse. .28Figure II.9 Overall Provider Achievement C1-502 PQI 91 Adult Acute CompositeIndicator. .29Figure II.10 Overall Provider Achievement for D1-503 PDI 91 Child Acute CompositeIndicator. .29Figure II.11 Potentially Preventable Admissions Actual-to-Expected Ratios.30Figure II.12 Potentially Preventable Readmissions Actual-to-Expected Ratios.31Figure II.13 Potentially Preventable Complications Actual-to-Expected Ratios.32Figure II.14 Potentially Preventable ED Visits Actual-to-Expected Ratios.33Figure III.1 Overall UC Costs Trends. .44Figure III.2 Trends in Average Reimbursed UC Costs per Hospital. .45Figure III.3 Actual and Adjusted Overall UC Cost Growth Rate. .46Figure III.4 Actual and Adjusted Average UC Cost Growth Rate per Hospital. .47Figure IV.1 Medicaid Managed Care Timeline.52Figure IV.2 Example Interrupted Time Series Model. .57Figure IV.3 Preventive Dental Services (Measure 3.1.1). .59Figure IV.4 Adult Access to Preventive/Ambulatory Health Services (Measures 3.1.2). .60Figure IV.5 Children and Adolescent Access to Primary Care Services (Measures 3.1.3).60Figure IV.6 Newly Diagnosed with Depression (Measures 3.1.4). .61Figure IV.7 Utilization of Pharmacy Benefits (Measures 3.1.5).62Figure IV.8 Service Coordination Utilization (Measure 3.2.1). .63Figure IV.9 Clients with SMI/SED Receiving Targeted Case Management (Measure3.2.2). .64Figure IV.10 MBCC Clients Receiving Recommended Treatment (Measures 3.3.3). .65Figure IV.11 Rate of Tooth Decay and Symptoms of Depression (Measures 3.4.1 &3.4.3). .66Figure IV.12 Prevention/Pediatric Quality Overall Composite (Measures 3.4.4). .67Figure IV.13 Potentially Preventable Emergency Department Use (Measure 3.4.5).68Figure IV.14 Rate of Emergency Department visits for Substance Abuse (Measure3.4.6b). .70Figure IV.15 Client Satisfaction - NFQR (Measure 3.5.1). .71Figure V.1 Applied APM Framework. .77Figure V.2 Percentage of DSRIP Providers that Have APM Arrangements by DY. .78Figure V.3 Percentage of DSRIP Providers with any APM Arrangements, by ProviderType. .79Population Informatics Lab, The Texas A&M Universityiii
Texas 1115 Medicaid Waiver Demonstration Renewal Evaluation Interim ReportFigure V.4 Percentage of DSRIP Providers with APM Arrangements by APMFramework. .80Figure V.5 MCO Health Plans with APM Arrangements by APM Framework Annually.82Figure V.6 DSRIP Provider Survey Respondents’ Mean Likert Response Scores onwhether DSRIP Promoted the Use of APMs within the Organization. .83Figure VI.1 Total MLIU ED Visits and Potentially Preventable MLIU ED Visits. .92Figure VI.2 Display of ITS Model for Hypothesis 5.1. .93Figure VI.3 Total Expenditures.94Figure B.2.1 Performance Measurement Period Pre/Post-Index Dates forDSRIP/Comparison Clients. .107Figure B.3.1 DSRIP Diabetes Claims Analysis Sample Flow Diagram. .109Figure B.3.2 Propensity Score Distributions for Treatment and Control Samples. .112Figure B.4.1 Collaboration between DSRIP Providers.124Figure B.4.2 Collaboration between DSRIP and Non-DSRIP Providers. .124Figure B.4.3 Is Your Organization a Member of an HIE?.125Figure B.4.4 Which HIE Does Your Organization Participate In? .125Figure B.5.1 Distribution of 1-Year Medicaid Costs, DSRIP/Non-DSRIP Clients. .133Figure B.6.1 Change in Weighted Mean Rate: A1-508 Rate of ED Visits for Diabetes. .137Figure B.6.2 Overall Provider Achievement for A1-508 Rate of ED Visits for Diabetes.137Figure B.6.3 Provider Achievement by Percent Change Categories for A1-508 Rate ofED Visits for Diabetes.138Figure B.6.4 Change in Weighted Mean Rate: A2-509 Rate of ED Visits for CHF,Angina, and Hypertension. .139Figure B.6.5 Overall Provider Achievement for A2-509 Rate of ED Visits for CHF,Angina, and Hypertension. .140Figure B.6.6 Provider Achievement by Percent Change Categories for A2-509 Rate ofED Visits for CHF, Angina, and Hypertension.140Figure B.6.7 Change in Weighted Mean Rate: H2-510 Rate of Emergency DepartmentVisits for Behavioral Health and Substance Abuse. .141Figure B.6.8 Overall Provider Achievement for H2-510 Rate of Emergency DepartmentVisits for Behavioral Health and Substance Abuse. .142Figure B.6.9 Provider Achievement by Percent Change Categories for H2-510 Rate ofEmergency Department Visits for Behavioral Health and Substance Abuse. .142Figure B.6.10 Change in Weighted Mean Rate: C1-502 PQI 91 Adult Acute CompositeIndicator. .143Figure B.6.11 Overall Provider Achievement C1-502 PQI 91 Adult Acute CompositeIndicator. .144Figure B.6.12 Provider Achievement by Percent Change Categories C1-502 PQI 91Adult Acute Composite Indicator.145Figure B.6.13 Change in Weighted Mean Rate D1-503 PDI 91 Child Acute CompositeIndicator. .145Figure B.6.14 Overall Provider Achievement for D1-503 PDI 91 Child Acute CompositeIndicator. .146Figure B.6.15 Provider Achievement by Percent Change Categories for D1-503 PDI 91Child Acute Composite Indicator.146Figure B.7.1 Change in Unweighted Mean Rate: A1-508 Rate of ED Visits for Diabetes. .147Figure B.7.2 Change in Unweighted Mean Rate: A2-509 Rate of ED Visits for CHF,Angina, and Hypertension. .148Population Informatics Lab, The Texas A&M Universityiv
Texas 1115 Medicaid Waiver Demonstration Renewal Evaluation Interim ReportFigure B.7.3 Change in Unweighted Mean Rate: H2-510 Rate of Emergency DepartmentVisits for Behavioral Health and Substance Abuse. .148Figure B.7.4 Change in Unweighted Mean Rate: C1-502 PQI 91 Adult Acute CompositeIndicator. .149Figure B.7.5 Change in Unweighted Mean Rate: D1-503 PDI 91 Child Acute CompositeIndicator. .149Figure C.3.1 Hospitals in Sample Submitting UC Costs by Year. .153Figure C.3.2 Hospitals’ Profit Status, Size, UC Pool, and DSH Payment Trend. .154Figure C.3.3 Hospitals’ County Rural Status and Rider 38 Status. .155Figure C.3.4 Hospitals’ RHP and RHP Tier. .156Figure C.3.5 UC Reimbursement Rate by Hospital Profit Status, Size, DSH Status,Geography. .157Figure C.3.6 UC Reimbursement Rate by Hospital Rider 38 Status, UC Pool Status, andRHP Tier. .158Figure C.3.7 Adjusted Average UC Cost Growth by Hospital Profit Status. .161Figure C.3.8 Adjusted Average UC Cost Growth by Hospital Size. .162Figure C.3.9 Adjusted Average UC Cost Growth by Hospital DSH Status.162Figure C.3.10 Adjusted Average UC Cost Growth by Hospital Rural-Urban Status. .163Figure C.3.11 Adjusted Average UC Cost Growth by Hospital Rider 38 Status. .164Figure C.3.12 Adjusted Average UC Cost Growth by Hospital UC Pool. .165Figure C.3.13 Adjusted Average UC Cost Growth by Hospital RHP Tier.166Figure D.1.1 Example of Rolling Measure with 90-Day Look Back Period.169Figure D.1.2 Example ITS Model with Rolling Measure.170Figure E.1.1 Applied APM Framework. .206Figure E.2.1 Percentage of DSRIP Providers that Have APM Arrangements.207Figure E.2.2 Percentage of DSRIP Providers with APM Arrangements by Provider Type. .207Figure E.2.3 Percentage of DSRIP Providers with APM Arrangements by APMFramework. .208Figure E.2.4 Number of MCO Health Plans with APM Arrangements by APMFramework. .209Figure E.2.5 Number of MCO Health Plans having APM Arrangements by Provider Risk.209Figure E.2.6 Survey Respondents Participating in APMs. .210Figure E.2.7 Survey Respondents Planning to Participate in Other APMs in the Future.211Figure E.2.8 APMs Improve Patient’s Satisfaction of Care. .211Figure E.2.9 APMs Improve Quality of Care for Patients.212Figure E.2.10 APMs Improve Access to Health Care. .213Figure E.2.11 APMs Improve Population Health. .213Figure E.2.12 APMs Reduce Per-Capita Cost of Providing Health Care. .214Figure E.2.13 Health Care Providers are Satisfied with APMs. .215Figure E.2.14 Manage All Administrative Burden Associated with Participating in APMs. .216Figure E.2.15 Allocate Sufficient Time for Participating in APMs. .217Figure E.2.16 Sufficient Financial Capacity for Participating in APMs. .218Figure E.2.17 Data Infrastructure Necessary for Participating in APMs. .218Figure E.2.18 DSRIP Promoted the Use of APMs within the Organization. .219Figure F.2.1 Total Expenditures. .222Figure F.2.2 Total Expenditures–Annual Growth Rates.223Figure F.2.3 Annual Expenditures across all Eligible Groups Served. .224Figure F.2.4 Eligible Groups Served–Annual Growth Rates. .225Figure F.2.5 With Waiver Annual Expenditures by EGS Subcomponent. .226Population Informatics Lab, The Texas A&M Universityv
Texas 1115 Medicaid Waiver Demonstration Renewal Evaluation Interim ReportFigure F.2.6 Without Waiver Annual Expenditures by EGS Subcomponent. .227Figure F.2.7 Eligible Groups Served on a PMPM Basis. .228Figure F.2.8 Eligible Groups Served on a PMPM Basis–Annual Growth Rates. .229Figure F.2.9 Annual Expenditures across all Non-Eligible Groups Served. .231Figure F.2.10 Major Components of Non-Eligible Groups Served (WW). .232Figure F.2.11 Detailed Subcomponents of Non-Eligible Groups Served (WW). .233Population Informatics Lab, The Texas A&M Universityvi
Texas 1115 Medicaid Waiver Demonstration Renewal Evaluation Interim ReportLIST OF TABLESTable II.1 DSRIP Evaluation Question and Hypotheses. .10Table II.2 Survey Data Collection Schedule. .11Table II.3 H1.1 Collaboration among Providers Measures. .13Table II.4 Medicaid Clients with Diabetes Measures. .14Table II.5 H1.3 Quality-Related Outcomes Measures.15Table II.6 H1.4 Population Health Measures. .16Table II.7 Social Network Survey Response Rate (June–July 2020). .19Table II.8 Samples of PSM DSRIP and Non-DSRIP Clients by Measure. .25Table II.9 DID Truncated Regression Estimate of DSRIP UPC Effect. .25Table II.10 DID Logistic Regression Estimate of HbA1c Frequency Effect. .26Table II.11 Comparison of Initial and Final DSRIP Client Samples.34Table III.1 UC Evaluation Question and Hypotheses.41Table III.2 Uncompensated Care Cost Data.41Table III.3 Measure Definitions.42Table IV.1 MMC Evaluation Question and Hypotheses. .53Table IV.2 Pre- and Post-MMC Transition Periods Used in the Interim Report.54Table IV.3 Measurement Periods and Approach. .55Table IV.4 Sample Sizes: Number of Member Months by Year, Period, and Population. .58Table IV.5 Preventive Dental Services (Measure 3.1.1). .58Table IV.6 Service Coordination Utilization (Measure 3.2.1).63Table IV.7 Clients with SMI/SED Receiving Targeted Case Management (Measure3.2.2). .64Table IV.8 Rate of Tooth Decay (Measure 3.4.1). .66Table IV.9 Prevention/Pediatric Quality Overall Composite (Measures 3.4.4). .67Table IV.10 Potentially Preventable Emergency Department Use (Measure 3.4.5) .68Table IV.11 Rate of Emergency Department visits for Substance Abuse (Measure3.4.6b). .69Table V.1 APM Evaluation Question and Hypothesis. .76Table V.2 Measures and Description. .77Table V.3 DSRIP Survey Respondent Sample Size by RHP.83Table V.4 Perceived Barriers to Developing and/or Implementing APMs. .84Table V.5 Perceived Benefits to Developing and/or Implementing APMs. .85Table VI.1 Health Care System Evaluation Question and Hypotheses. .88Table VI.2 Measure Summary.89Table VI.3 Summary of ITS Results for Hypothesis 5.1.92Table B.3.1 Logistic Regression Treatment Assignment Model, DSRIP Treatment versusNon-DSRIP Comparison Client Episodes. .111Table B.3.2 Samples of Unmatched and PSM DSRIP and Non-DSRIP Clients.112Table B.3.3 Standardized Mean Difference Before and After PSM.113T
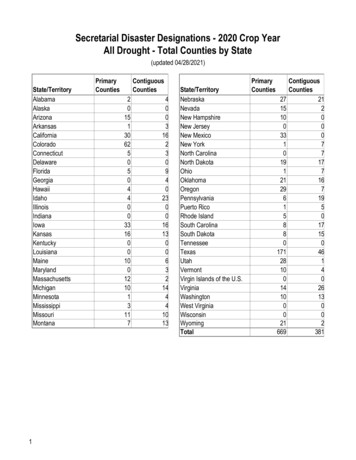
For Measure 1.4.1, Potentially Preventable Admissions (PPA), eight RHPs (40%) reported a decrease, one RHP (5%) reported no change, and 11 RHPs (55%) reported an increase in potentially preventable admissions between 2017 and 2018 (Figure II.11). Figure II.11 Potentially Preventable Admissions Actual-to-Expected Ratios. 1.8 1.6