Transcription
More info about this article: http://www.ndt.net/?id 141566th European Workshop onStructural Health Monitoring - We.2.B.4Wind Turbine Blade Fatigue Tests: LessonsLearned and Application to SHM SystemDevelopment S. G. TAYLOR, K. M. FARINHOLT, H. JEONG, J-K JANG,G. PARK, M. D. TODD, C. R. FARRAR and C. M. AMMERMAN ABSTRACTThis paper presents experimental results of several structural health monitoring(SHM) methods applied to a 9-meter CX-100 wind turbine blade that underwentfatigue loading. The blade was instrumented with piezoelectric transducers,accelerometers, acoustic emission sensors, and foil strain gauges. It underwentharmonic excitation at its first natural frequency using a hydraulically actuatedresonant excitation system. The blade was initially excited at 25% of its design load,and then with steadily increasing loads until it failed. Various data were collectedbetween and during fatigue loading sessions. The data were measured over multiplefrequency ranges using a variety of acquisition equipment, including off-the-shelfsystems and specially designed hardware developed by the authors. Modal response,diffuse wave-field transfer functions, and ultrasonic guided wave methods wereapplied to assess the condition of the wind turbine blade. The piezoelectric sensorsthemselves were also monitored using a sensor diagnostics procedure. This papersummarizes experimental procedures and results, focusing particularly on fatiguecrack detection, and concludes with considerations for implementing such damageidentification systems, which will be used as a guideline for future SHM systemdevelopment for operating wind turbine blades.INTRODUCTIONThe authors have been investigating several design parameters of structural healthmonitoring (SHM) techniques [1] and their performance [2], including ultrasonicguided wave propagation [3] and diffuse ultrasonic wave-field measurements [4], asmethods to monitor the health of a wind turbine blade using piezoelectric sensors. Theauthors have also proposed a multi-scale sensing approach [5, 6] in order to assess theinfluence of structural damage on the low-frequency dynamic response of a blade. InStuart Taylor, Engineering Institute, Los Alamos National Lab., NM, U.S.A.1License: http://creativecommons.org/licenses/by/3.0/
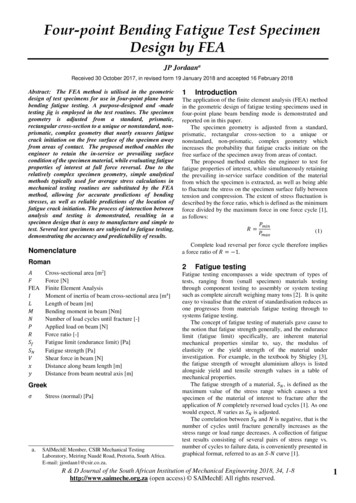
order to implement these systems in the field, compact sensor nodes, which theauthors have been developing [7-9], are necessary. To that end, prototype embeddedsensing hardware was tested alongside commercial data acquisition systems. With theproposed sensing strategy, a series of full-scale fatigue tests have been performed incollaboration with Sandia National laboratory (SNL) and the National RenewableEnergy Laboratory (NREL). These tests are a precursor for a planned full-scaledeployment of an SHM system on 9-meter CX-100 rotor blades to be flown in thefield in collaboration with SNL at the U.S. Department of Agriculture’s (USDA)Conservation and Production Research Laboratory (CPRL) in Bushland, Texas.Various methods were implemented using several data acquisition hardwaresystems. These methods, and oftentimes the hardware systems used, are generallydesigned for use either with ultrasonic guided waves, typically characterized by asingle wave ‘packet’, often a Gaussian-windowed sinusoid, or with diffuse wave-fieldmeasurements, in which a structure is excited with a broadband signal and its responseis recorded long past the initial transient response to the excitation. Analysis methodsapplied include energy methods, cross correlation methods, and time-domain transferfunction methods, such as auto-regressive (AR) models or auto-regressive withexogenous inputs (ARX) model-based methods. This paper presents a preliminaryanalysis of data collected in the course of the fatigue test. The techniques consideredare not necessarily optimal detectors, but are a sampling of techniques commonlyused in the literature for similar applications.TEST SETUPOverviewThe test structure employed was a 9-m CX-100 blade [10], originally designed byresearchers at SNL. The blade was manufactured according to standard specificationsfor the CX-100 blade, and it is shown mounted to the test fixture in Figure 1. The testfixture was a steel frame designed to approximate a fixed-free condition, andoscillatory loads were introduced into the blade using a hydraulically actuatedUniversal Resonant EXcitation (UREX) system operating at the blade’s firstresonance.Figure 1. CX-100 blade mounted on test stand.2
The fatigue test was conducted in the fall of 2011. In the fatigue test, the bladewas excited intermittently for 8.5 million cycles until 11/08/11, when a throughthickness fatigue crack surfaced on the leading edge side of the blade’s transitionalroot area. The area including the crack is shown in a photograph in Figure 2. Thesurfacing of this crack dramatically altered the dynamic characteristics of the blade,causing the blade’s first resonance to vary as a function of loading. However, theauthors believe that the damage that ultimately manifested itself as this externallyvisible crack was detectable using the methods applied in this paper as early as10/18/11, approximately three weeks prior to the catastrophic failure. In thediscussions to follow, the blade will be referred to as ‘healthy’ for the period prior to10/20/11, ‘damaged’ for the period between 10/20/11 and 11/8/11, and‘catastrophically damaged’ for the period after 11/8/11.Figure 2. Fatigue crack detail.Sensor LayoutThe low-pressure surface of the blade’s root area contained active sensing arrayscomposed of PZT patches in two configurations: an inner array and an outer array.The sensor arrays on the low-pressure surface of the blade’s root area are shownpictorially in the left portion of Figure 3. The inner array observed a 0.75-m diameterregion centered 1 m from the blade root, while the outer array observed a 2-melliptical region centered 1.5 m from the root.The high-pressure surface of the blade’s root area contained active sensing arraysin only one configuration, corresponding to the inner array on the low-pressure side.The transmission distances ranged from 0.37m to 0.5m, and the actuating patcheswere located 1 m from the blade root. The sensor arrays on the high-pressure surfaceof the blade’s root area are shown pictorially in the right-hand portion of Figure 3.Figure 3. CX-100 root area sensor array locations.3
Data Acquisition SystemsThe MD7 IntelliConnector [11], by Metis Design, was employed for ultrasonicguided wave analysis over transmission frequencies ranging from 50 kHz to 250 kHzat 25 kHz intervals, with a sampling frequency of 10 MHz. Two IntelliConnectorswere deployed to interrogate a 1-m diameter arrays on each side of the blade.A Bruel & Kjaer LASER data acquisition system was employed for diffuse wavefield measurements, actively interrogating the CX-100 blade with band-limited whitenose from 500 Hz to 40 kHz, with a sampling rate of 96 kHz. Its utility in damagedetection using diffuse wave field methods had previously been demonstrated usingsimulated damage in the laboratory [12].The Wireless Active Sensing Platform (WASP) developed by the authors is aprototype embedded sensor node deployed in order to assess its performance incomparison to commercial systems such as the LASER. Because the WASP’sfirmware was still in development at the start of the test, it was limited to an effective20 kHz bandwidth. As with the IntelliConnectors, two WASPs were deployed: oneeach to interrogate a 1-m diameter array on each side of the blade. For this test, theWASP was configured with a dedicated excitation channel so that an externalamplifier could be utilized to ensure a high signal-to-noise ratio.FATIGUE CRACK DETECTION RESULTSUltrasonic Guided WavesIntelliConnector DataIn this analysis, only the measurements using a 200 kHz excitation signal wereconsidered. For each dataset, the measured response data were match-filtered with theexcitation signal in order to reduce the effects of noise, and to discard any response toextraneous inputs. This step would also discard any nonlinear response. A residualwas computed by subtracting from each filtered waveform the baseline waveform thatresulted in the smallest norm. In computing residuals from the baseline data, onlymeasurements from earlier dates were considered. If the structure remainedunchanged, and the training data sufficiently sampled its environmental operatingspace, the residual would be noise. If the structure had changed, that change wouldmanifest itself as a measureable, deterministic signal.Because relative phase information is often of little use in guided waveapplications, the residual signal was enveloped by computing its instantaneousamplitude via the Hilbert transform. Using this enveloped signal, the normalizedresidual energy was computed as the ratio of the envelope energy and the energy ofthe baseline signal used to compute the residual. Dividing the data into ‘healthy’ and‘damaged’ groups based on the dates discussed above, histograms of the normalizedresidual energy were generated for each sensor path. The histograms were normalizedso that they represent discrete probability density functions (PDFs) with totalprobability of unity. Plots of these histograms are shown in Figure 4, along with aninset identifying the sensor paths and the location of the fatigue crack, which wasbetween the sensors for paths 3 and 4.4
The data for sensor paths 1, 2 and 4 indicate good separability between theunderlying states, while paths 3 and 5 indicate moderate separability. Paths 3 and 4were nearest the crack, and should have been expected to be most affected by it. Path1 was quite far from the path, but it lay along the blade’s carbon fiber spar cap, whichmay have acted as a wave guide to communicate effects of the underlying damagefrom the crack location.Sensor Path 2Sensor Path 1Sensor PathsDiscrete Probability Density152.521.510.501050246000.20.40.6Sensor Path 4Sensor Path 3Sensor Path ormalized Residual Energy0.51Figure 4. Ultrasonic guided wave normalized residual energy results.Diffuse Wave Field Transfer FunctionsWASP DataFor the analysis of the WASP data, which were obtained using a chirp excitation,an ARX model of order (12, 3) was fit to the data. The exogenous inputs wererequired because the excitation was not white noise, so the process could not bemodeled simply as autoregressive. Treating the model parameters as samples of amultivariate distribution, a covariance matrix was computed, and its eigenvectorswere used to compute the principal component loadings for each set of ARX modelparameters. In this case, the covariance matrix was computed using only the baselinedata, and the principle loads for all data were computed with respect to the baseline.Sorting the data into ‘healthy’ and ‘damaged’ groups based on the test date,histograms of the first principal component were generated, normalizing so that theyrepresent discrete PDFs with unity total probability. Plots of these histograms areshown in Figure 5, along with an inset identifying the sensor paths and the location ofthe fatigue crack, which was between the sensors for paths 3 and 4.There is very little separation in the data for paths 1, 2, and 5, but there is nearcomplete separation in the data for paths 3 and 4, which were physically nearest thecrack. This hardware and analysis method combination appears as though it is locallysensitive to structural changes when on or near a sensor path.5
Discrete Probability DensitySensor Path 121.51.5110.50.507890Sensor Path 3 7 6 5Sensor Path 5Sensor Path 41.52HealthyDamaged10.81.50.610.40.50.50.20Sensor PathsSensor Path 22 20 100004 6 8 10 12 14 1First Principal Component (x10 3)01Figure 5. WASP ARX-PCA results.LASER DataUsing data from the LASER system, cross-correlation (CC) coefficients werecomputed between newly measured diffuse wave-field frequency response functions(FRFs) and baseline FRFs. A scalar feature was taken as unity minus this CC value. Ifthe newly measured FRF was the same as the baseline, the feature value would bezero, but if the underlying structure changed (e.g. if damage had occurred), the featurevalue would increase. Dividing the features into ‘healthy’ and ‘damaged’ groupsbased on test date, normalized histograms for each sensor path were generated, andthey are plotted in Figure 6. There is moderate separability between the groups for allsensor paths. This hardware and analysis method combination appears to be generallysensitive to structural change, with somewhat increased sensitivity along the spar cap.FLIGHT TEST SETUPApplying lessons learned in the course of the CX-100 blade fatigue test studies, afull-scale CX-100 SHM system deployment is slated for spring 2012, to be conductedin collaboration with SNL at the USDA’s CPRL in Bushland, Texas. At the time ofthis writing, the instrumented blades are being prepared for mounting on the windturbine tower. While the instrumentation goal for the fatigue test blades was datacollection for analysis and learning purposes, the instrumentation on the flightdeployed blade is more targeted and streamlined. The arrays were furthermoreinstalled in the interior of the blade, in order to mitigate the possibility of damageduring flight. Two active arrays focus on the blade’s trailing edge and leading edge,respectively, one passive array is installed along the blade’s carbon-fibre spar cap,which extends down the length of the blade, and one active array mimics those6
assessed in this work, on the low-pressure side, inside the root area. While the utilityof the first three sensor array types is discussed elsewhere [5, 6], the root area array,will serve to monitor the blade for fatigue damage like that assessed in this work usingdata from earlier tests. A WASP unit, combined with several analysis methods,including the PCA technique presented above, will be employed for that purpose.During the fatigue tests, the semi-laboratory environment afforded the luxury of alarge impedance analyser; however, such luxury is not practical in the wind turbinehub. For that reason, the prototype WASP hardware has also been designed toperform impedance measurements to assess sensor condition. Sensor diagnosticmeasurements will be collected prior to each regular structural measurement in orderto guarantee that changes in measured responses are indicative of structural changes,rather than sensor failures.Sensor Path 1Sensor Path 2150Sensor Paths1000800Discrete Probability Density10060040050200000.020.04Sensor Path 3000.0050.01Sensor Path 4Sensor Path 200100100000.1 00.010.02 01 Cross Correlation0.010.02Figure 6. LASER FRF cross-correlation results.SUMMARYThe fatigue crack detection results of three hardware and analysis method pairshave been presented, all of which indicated reasonable ability to distinguish the‘healthy’ from the ‘damaged’ state of the wind turbine blade. Having demonstrated itsability to detect damage in the blade, the prototype WASP hardware will be deployedon an operational CX-100 wind turbine blade to monitor potential damage formationand collect sensor diagnostic measurements. Four targeted sensor arrays have beeninstalled in a CX-100 blade for this test, including an active array used to monitor theroot area of the blade for fatigue damage, and a passive array for correlating the effectof potential fatigue cracks to the global vibration response of the blade.7
ACKNOWLEDGEMENTSThis research was funded by the Department of Energy through the LaboratoryDirected Research and Development program at Los Alamos National Laboratory, aswell as by the Leading Foreign Research Institute Recruitment Program through theNational Research Foundation of Korea funded by the Ministry of Education, Scienceand Technology (2011-0030065). The authors would also like to acknowledge ScottHughes and Mike Desmond from National Renewable Energy Laboratory, and MarkRumsey and Jon White from Sandia National Laboratory for their support andguidance on this ][12]C. R. Farrar, and K. Worden, “An introduction to structural healthmonitoring,” Philosophical Transactions of the Royal Society A:Mathematical, Physical and Engineering Sciences, 365(1851), 303-315(2007).S. M. Kay, “Fundamentals of statistical signal processing, Volume II:Detection theory,” Upper Saddle River (New Jersey), 7, (1998).S. K. Seth, S. M. Spearing, and S. Constantinos, “Damage detection incomposite materials using Lamb wave methods,” Smart Materials andStructures, 11(2), 269 (2002).J. E. Michaels, and T. E. Michaels, “Detection of structural damage from thelocal temporal coherence of diffuse ultrasonic signals,” Ultrasonics,Ferroelectrics and Frequency Control, IEEE Transactions on, 52(10), 17691782 (2005).K. M. Farinholt, S. G. Taylor, G. Park et al., "Full-scale fatigue tests of CX100 wind turbine blades. Part I: testing." 8343, 83430P-8.S. G. Taylor, H. Jeong, J. K. Jang et al., "Full-scale fatigue tests of CX-100wind turbine blades. Part II: analysis." 8343, 83430Q-10.S. G. Taylor, K. M. Farinholt, E. B. Flynn et al., “A mobile-agent-basedwireless sensing network for structural monitoring applications,”Measurement Science and Technology(4), 045201 (2009).S. Taylor, K. Farinholt, G. Park et al., “Multi-scale wireless sensor node forhealth monitoring of civil infrastructure and mechanical systems,” SmartStructures and Systems, 6(5-6), 661-673 (2010).S. G. Taylor, J. Carroll, K. M. Farinholt et al., "Embedded processing forSHM with integrated software control of a wireless impedance device," SPIESmart Structures/NDE. 7979, 797904.D. Berry, [Design of 9-Meter Carbon-Fiberglass Prototype Blades: CX-100and TX-100] Sandia National Laboratories, Albuquerque, NM(2007).S. S. Kessler, C. T. Dunn, M. Borgen et al., [A Cable-Free Digital Sensor-Busfor Structural Health Monitoring of Large Area Composite Structures],(2009).K. Deines, T. Marinone, R. Schultz et al., [Modal Analysis and SHMInvestigation of CX-100 Wind Turbine Blade] Springer New York, (2011).8
The fatigue test was conducted in the fall of 2011. In the fatigue test, the blade was excited intermittently for 8.5 million cycles until 11/08/11, when a through-thickness fatigue crack surfaced on the leading edge side of the blade's transitional root area. The area including the crack is shown in a photograph in Figure 2. The