Transcription
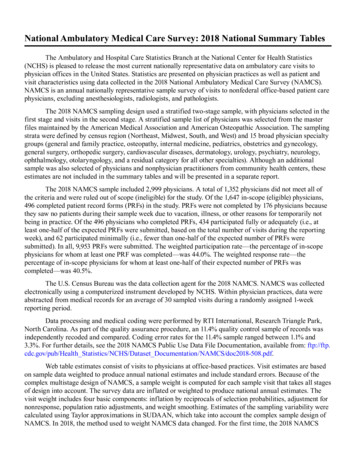
National Ambulatory Medical Care Survey: 2018 National Summary TablesThe Ambulatory and Hospital Care Statistics Branch at the National Center for Health Statistics(NCHS) is pleased to release the most current nationally representative data on ambulatory care visits tophysician offices in the United States. Statistics are presented on physician practices as well as patient andvisit characteristics using data collected in the 2018 National Ambulatory Medical Care Survey (NAMCS).NAMCS is an annual nationally representative sample survey of visits to nonfederal office-based patient carephysicians, excluding anesthesiologists, radiologists, and pathologists.The 2018 NAMCS sampling design used a stratified two-stage sample, with physicians selected in thefirst stage and visits in the second stage. A stratified sample list of physicians was selected from the masterfiles maintained by the American Medical Association and American Osteopathic Association. The samplingstrata were defined by census region (Northeast, Midwest, South, and West) and 15 broad physician specialtygroups (general and family practice, osteopathy, internal medicine, pediatrics, obstetrics and gynecology,general surgery, orthopedic surgery, cardiovascular diseases, dermatology, urology, psychiatry, neurology,ophthalmology, otolaryngology, and a residual category for all other specialties). Although an additionalsample was also selected of physicians and nonphysician practitioners from community health centers, theseestimates are not included in the summary tables and will be presented in a separate report.The 2018 NAMCS sample included 2,999 physicians. A total of 1,352 physicians did not meet all ofthe criteria and were ruled out of scope (ineligible) for the study. Of the 1,647 in-scope (eligible) physicians,496 completed patient record forms (PRFs) in the study. PRFs were not completed by 176 physicians becausethey saw no patients during their sample week due to vacation, illness, or other reasons for temporarily notbeing in practice. Of the 496 physicians who completed PRFs, 434 participated fully or adequately (i.e., atleast one-half of the expected PRFs were submitted, based on the total number of visits during the reportingweek), and 62 participated minimally (i.e., fewer than one-half of the expected number of PRFs weresubmitted). In all, 9,953 PRFs were submitted. The weighted participation rate—the percentage of in-scopephysicians for whom at least one PRF was completed—was 44.0%. The weighted response rate—thepercentage of in-scope physicians for whom at least one-half of their expected number of PRFs wascompleted—was 40.5%.The U.S. Census Bureau was the data collection agent for the 2018 NAMCS. NAMCS was collectedelectronically using a computerized instrument developed by NCHS. Within physician practices, data wereabstracted from medical records for an average of 30 sampled visits during a randomly assigned 1-weekreporting period.Data processing and medical coding were performed by RTI International, Research Triangle Park,North Carolina. As part of the quality assurance procedure, an 11.4% quality control sample of records wasindependently recoded and compared. Coding error rates for the 11.4% sample ranged between 1.1% and3.3%. For further details, see the 2018 NAMCS Public Use Data File Documentation, available from: ftp://ftp.cdc.gov/pub/Health Statistics/NCHS/Dataset Documentation/NAMCS/doc2018-508.pdf.Web table estimates consist of visits to physicians at office-based practices. Visit estimates are basedon sample data weighted to produce annual national estimates and include standard errors. Because of thecomplex multistage design of NAMCS, a sample weight is computed for each sample visit that takes all stagesof design into account. The survey data are inflated or weighted to produce national annual estimates. Thevisit weight includes four basic components: inflation by reciprocals of selection probabilities, adjustment fornonresponse, population ratio adjustments, and weight smoothing. Estimates of the sampling variability werecalculated using Taylor approximations in SUDAAN, which take into account the complex sample design ofNAMCS. In 2018, the method used to weight NAMCS data changed. For the first time, the 2018 NAMCS
weights were adjusted using Multipurpose Iterative Proportional Fitting (IPF). This is a calibration techniquethat simultaneously implements (1) calibration in multiple specified domains; (2) nonresponse adjustment; and(3) weight trimming, as part of a unified iteration cycle. Users should take caution when interpretingdifferences between the 2016 and 2018 estimates, as the method used to weight NAMCS data changed with2018 data. A report describing the new weighting methodology and comparing 2016 and 2018 estimates basedon the same weighting methodology is planned. Detailed information on the design, conduct, and estimationprocedures of 2018 NAMCS are discussed in the 2018 Public Use Data File Documentation.As in any survey, results are subject to sampling and nonsampling errors. Nonsampling errors includereporting and processing errors as well as biases due to nonresponse and incomplete response. In 2018, racedata were missing for 28.6% (unweighted) of records, and ethnicity data were missing for 27.8% (unweighted)of records. NCHS uses model-based single imputation for NAMCS race and ethnicity data. Race imputationis restricted to three categories (white, black, and other) based on research by an internal work group and onquality concerns with imputed estimates for race categories other than white and black. The imputationtechnique is described in more detail in the 2018 Public Use Data File Documentation. NAMCS diagnosisdata are coded according to the International Classification of Diseases, 10th Revision, Clinical Modification(ICD–10–CM). Three tables presenting estimates of primary diagnoses and injury diagnoses (Tables 13, 14,and 15) use ICD–10–CM codes. In 2015 and all previous years, the web tables presented diagnosis estimatesusing the International Classification of Diseases, Ninth Revision, Clinical Modification (ICD–9–CM)coding system. Because the ICD–9–CM and ICD–10–CM coding systems differ substantially, users shouldtake caution when comparing diagnosis estimates for 2018 with those for previous years.Proportion estimates are not presented or are flagged based on the procedure specified in “NationalCenter for Health Statistics Data Presentation Standards for Proportions.” For all estimates other thanestimates of proportions, the following approach is used: Visit estimates are not presented and are replaced byan asterisk (*) if they are based on fewer than 30 cases in the sample data. Visit estimates based on 30 or morecases include an asterisk if the relative standard error of the estimate exceeds 30%.Suggested citation: Santo L, Okeyode T. National Ambulatory Medical Care Survey: 2018 NationalSummary Tables. Available from: https://www.cdc.gov/nchs/data/ahcd/namcs summary/2018-namcs-web-tables-508.pdf.CS324562
National Ambulatory Medical Care Survey: 2018 National Summary TablesTable page 1 of 1Table 1. Physician office visits, by selected physician characteristics: United States, 2018Physician characteristicNumber of visits(standard error)in thousandsPercent distribution(standard error of percent)100.0 Number of visits per100 persons per year1–3(standard error of rate)All visits860,386 (37,935)267.1 (11.8)Professional identityDoctor of medicineDoctor of osteopathy803,404 (37,174)56,982 (7,561)93.4 (0.9)6.6 (0.9)249.4 (11.5)17.7 (2.3)440,155 (31,474)216,262 (19,037)203,969 (21,600)51.2 (2.3)25.1 (2.2)23.7 (2.3)136.6 (9.8)67.1 (5.9)63.3 (6.7)764,804 (37,461)95,582 (21,946)88.9 (2.4)11.1 (2.4)272.7 (13.4)229.4 (52.7)Specialty type4Primary careMedical specialtySurgical specialtyMetropolitan statusMSA5Non-MSA Category not applicable.1Visit rates are based on the July 1, 2018, set of estimates of the civilian noninstitutional population of the United States as developed by the U.S. Census Bureau, Population Division.2Population estimates by metropolitan statistical area definitions status are based on estimates of the U.S. civilian noninstitutional population as of July 1, 2018, from the 2018 National HealthInterview Survey, National Center for Health Statistics, compiled according to November 2009 Office of Management and Budget definitions of core-based statistical areas. icro.html for more about metropolitan statistical definitions.3For metropolitan statistical area, population denominators are different for each category and thus do not add to total population rate. For other variables, the denominator is the total population.4Specialty type is defined in the 2018 National Ambulatory Medical Care Survey Public Use Data File Documentation, available from: ftp://ftp.cdc.gov/pub/Health Statistics/NCHS/Dataset Documentation/NAMCS/doc2018-508.pdf.5MSA is metropolitan statistical area.NOTE: Numbers may not add to totals because of rounding.SOURCE: National Center for Health Statistics, National Ambulatory Medical Care Survey, 2018.U.S. Department of Health and Human Services Centers for Disease Control and Prevention National Center for Health Statistics
National Ambulatory Medical Care Survey: 2018 National Summary TablesTable page 1 of 1Table 2. Office visits, by selected physician practice characteristics: United States, 2018Physician practice characteristicsAll visitsNumber of visits(standard error)in thousandsPercent distribution(standard error of percent)860,386 (37,935)100.0 Employment (2.9)(1.2)(0.3)OwnershipPhysician or groupOther health care corporationOther hospitalMedical or academic health )(1.6)(0.7)(0.2)(0.6) Solo23–56–1011 or moreBlank1270,08988,158257,828169,74074,570 (32,765)(16,796)(34,176)(26,127)(14,510) 31.410.230.019.78.7 (3.4)(2.0)(3.6)(3.0)(1.7) Type of practiceSingle-specialty groupMultispecialty groupSoloBlank1379,907210,389270,089 (34,497)(29,302)(32,765) 44.224.531.4 (3.7)(3.2)(3.4) Office typePrivate practiceFreestanding clinic or urgicenterOther4781,598 (39,506)*57,085 (21,659)21,703 (6,275)90.8 (2.5)* 2.5 (0.7)Electronic medical recordsYes—all electronicYes—part paper and part 014.80.6Practice submits claims electronicallyYesNoBlank1748,277 (38,293)105,324 (25,660)*6,785 (3,330)Practice (0.4)87.0 (2.9)12.2 (2.9)0.8 (0.4) Category not applicable.* Estimate does not meet National Center for Health Statistics standards of reliability.1Blank may include missing, unknown, or “refused to answer the question” data.2Health maintenance organization.3Includes owners such as local government (state, county, or city) and charitable organizations.4Includes the following office types: HMO, nonfederal government clinic, mental health center, family planning clinic, and facultypractice plan.NOTE: Numbers may not add to totals because of rounding.SOURCE: National Center for Health Statistics, National Ambulatory Medical Care Survey, 2018.U.S. Department of Health and Human Services Centers for Disease Control and Prevention National Center for Health Statistics
National Ambulatory Medical Care Survey: 2018 National Summary TablesTable page 1 of 1Table 3. Office visits, by patient age and sex: United States, 2018Patient age and sexAll visitsNumber of visits(standard error) in thousands860,386 (37,935)Percent distribution(standard error of percent)100.0 Number of visits per 100 personsper year1 (standard error of rate)267.1 (11.8)Age (years)Under 15Under 11–45–1415–2425–4445–6465 and over65–7475 and 17.5)(11.8)(15.1)(17.9)(35.8)(31.6)(51.8)Sex and age (years)FemaleUnder 1515–2425–4445–6465–7475 and overMaleUnder 1515–2425–4445–6465–7475 and 8)(36.3)(72.6) Category not applicable.1Visit rates are based on the July 1, 2018, set of estimates of the civilian noninstitutional population of the United States as developed by the U.S. Census Bureau, Population Division.NOTE: Numbers may not add to totals because of rounding.SOURCE: National Center for Health Statistics, National Ambulatory Medical Care Survey, 2018.U.S. Department of Health and Human Services Centers for Disease Control and Prevention National Center for Health Statistics
National Ambulatory Medical Care Survey: 2018 National Summary TablesTable page 1 of 1Table 4. Office visits, by patient race and age, and ethnicity: United States, 2018Number of visits(standard error) in thousandsPercent distribution(standard error of percent)Number of visits per 100persons per year1(standard error of rate)All visits860,386 (37,935)100.0 267.1 (11.8)Race and age (years)2WhiteUnder 1515–2425–4445–6465–7475 and overBlack or African AmericanUnder 1515–2425–4445–6465–7475 and 9)Race, ethnicity, and age (years)2Hispanic or LatinoUnder 1515–2425–4445–6465–7475 and overNot Hispanic or LatinoWhiteUnder 1515–2425–4445–6465–7475 and overBlack or African AmericanUnder 1515–2425–4445–6465–7475 and 68.3)(49.4)Physician characteristic Category not applicable.1Visit rates are based on the July 1, 2018, set of estimates of the civilian noninstitutional population of the United States as developed by the U.S. Census Bureau, Population Division.2The race groups white, black or African American, and other include persons of Hispanic and not of Hispanic origin. Persons of Hispanic origin may be of any race. Starting with 2009 data, theNational Center for Health Statistics adopted the technique of model-based single imputation for National Ambulatory Medical Care Survey (NAMCS) race and ethnicity data. The race imputationis restricted to three categories (white, black, and other) based on research by an internal work group and on quality concerns with imputed estimates for race categories other than white andblack. The imputation technique is detailed in the 2018 NAMCS Public Use Data File Documentation, available from: ftp://ftp.cdc.gov/pub/Health Statistics/NCHS/Dataset Documentation/NAMCS/doc2018-508.pdf. For 2018, race data were missing for 32.0% of visits, and ethnicity data were missing for 31.0% of visits.3Other race includes visits by Asian, Native Hawaiian or other Pacific Islander, American Indian or Alaska Native persons, and persons with more than one race.NOTE: Numbers may not add to totals because of rounding.SOURCE: National Center for Health Statistics, National Ambulatory Medical Care Survey, 2018.U.S. Department of Health and Human Services Centers for Disease Control and Prevention National Center for Health Statistics
National Ambulatory Medical Care Survey: 2018 National Summary TablesTable page 1 of 1Table 5. Expected sources of payment at office visits: United States, 2018Number of visits(standard error)in thousands1Percent of visits(standard error of percent)All visits860,386 (37,935) Private insuranceMedicareMedicaid or CHIP2Medicare and Medicaid3No insurance4Self-payNo charge or charityWorkers’ compensationOtherUnknown or 884,94819,02953,241Expected source of 0.50.62.26.2(2.3)(1.6)(1.4)(0.3) (0.2)(0.2)(0.4)(1.5) Category not applicable.* Estimate does not meet National Center for Health Statistics standards of reliability.1Combined total of expected sources of payment exceeds “all visits,” and “percent of visits” exceeds 100%, because more thanone source of payment may be reported per visit.2CHIP is Children’s Health Insurance Program.3Visits in this category are also included in both the Medicare and Medicaid or CHIP or other state-based program categories.4Defined as having only self-pay, no charge, or charity as payment sources. The individual self-pay and no charge or charitycategories are not mutually exclusive.NOTE: Numbers may not add to totals because of rounding.SOURCE: National Center for Health Statistics, National Ambulatory Medical Care Survey, 2018.U.S. Department of Health and Human Services Centers for Disease Control and Prevention National Center for Health Statistics
National Ambulatory Medical Care Survey: 2018 National Summary TablesTable page 1 of 1Table 6. Primary care provider and referral status of office visits, by prior-visit status:United States, 2018Prior-visit status, primary careprovider, and referral statusAll visitsNumber of visits(standard error)in thousandsPercent distribution(standard error of percent)860,386 (37,935)PCP1Visit toVisit to non-PCP1,2Referred for this visitNot referred for this visitUnknown if referred3Unknown if PCP1 3,206)(25,726)(14,430)(24,934)(11,769)(7,624)100.0 9)Established patientAll visitsPCP1Visit toVisit to non-PCP1,2Referred for this visitNot referred for this visitUnknown if referred3Unknown if PCP1 visit2,3727,942 (36,411)84.6 ,787)(6,904)(3.0)(2.9)(1.5)(2.9)(1.3)(1.0)New patientAll visitsPCP1Visit toVisit to non-PCP1,2Referred for this visitNot referred for this visitUnknown if referred3Unknown if PCP1 visit2,3132,444 (9,262)15.4 1,324)(2.1)(2.2)(4.1)(3.8)(2.6)(1.0) Category not applicable.1PCP is patient’s primary care provider as indicated by a positive response to the question, “Are you the patient’s primary carephysician/provider?”2Referral status was only asked for visits to non-PCPs and visits with unknown PCP status. Among these visits, referral informationwas unknown for 16.1% of visits.3Unknown category includes blanks.NOTE: Numbers may not add to totals because of rounding.SOURCE: National Center for Health Statistics, National Ambulatory Medical Care Survey, 2018.U.S. Department of Health and Human Services Centers for Disease Control and Prevention National Center for Health Statistics
National Ambulatory Medical Care Survey: 2018 National Summary TablesTable page 1 of 1Table 7. Primary care provider and referral status, according to physician specialty: United States, 2018Visit to non-PCP1,2Physician specialtyTotalVisitto PCP1Referred by otherphysicianNot referred byother physicianUnknown ifreferred3Unknown ifPCP1 visit2,3Percent distribution (standard error of percent)All visits100.039.7 (2.8)18.5 (1.8)30.7 (2.7)7.8 (1.4)3.3 (0.9)Primary care specialtyMedical specialtySurgical specialty100.0100.0100.075.8 (3.4)1.6 (0.5)2.4 (1.0)* 33.5 (4.4)31.6 (4.1)12.0 (2.5)49.6 (5.6)50.8 (5.7)2.9 (0.8)14.6 (4.4)11.4 (2.7)* 0.6 (0.2)* Category not applicable.* Estimate does not meet National Center for Health Statistics standards of reliability.1PCP is patient’s primary care provider as indicated by a positive response to the question, “Are you the patient’s primary care physician/provider?”2Referral status was asked only for visits to non-PCPs and visits with unknown PCP status. Among these visits, referral information was unknown for 16.1% of visits.3Unknown category includes blanks.NOTE: Numbers may not add to totals because of rounding.SOURCE: National Center for Health Statistics, National Ambulatory Medical Care Survey, 2018.U.S. Department of Health and Human Services Centers for Disease Control and Prevention National Center for Health Statistics
National Ambulatory Medical Care Survey: 2018 National Summary TablesTable page 1 of 1Table 8. Continuity-of-care office visit characteristics, by specialty type: United States, 2018Specialty type1Continuity-of-care alspecialtiesSpecialty type1MedicalspecialtiesAllspecialtiesNumber of visits (standard error) in thousands860,386 (37,935)440,155 (31,474)203,969 (21,600)216,262 (19,037)Prior-visit status andnumber of visits in last 12 monthsEstablished patient2None1–2 visits3–5 visits6 or more visitsNew )SurgicalspecialtiesMedicalspecialtiesPercent distribution (standard error of percent)All 2)Primarycare100.0 0 4) Category not applicable.1Specialty types are defined in the 2018 Public Use File Documentation, available from: ftp://ftp.cdc.gov/pub/Health Statistics/NCHS/Dataset Documentation/NAMCS/doc2018-508.pdf.2Number of previous visits by established patients to responding physician in the last 12 months.NOTE: Numbers may not add to totals because of rounding.SOURCE: National Center for Health Statistics, National Ambulatory Medical Care Survey, 2018.U.S. Department of Health and Human Services Centers for Disease Control and Prevention National Center for Health Statistics100.0 .6)100.0 .2)
National Ambulatory Medical Care Survey: 2018 National Summary TablesTable page 1 of 1Table 9. Twenty leading principal reasons for office visits, by patient’s sex: United States, 2018Number of visits1(standard error)in thousandsPrincipal reason for visit and RVC code1TotalFemale2Male3Percent distribution (standard error of percent)All visits . . . . . . . . . . . . . . . . . . . . . . . . . . . . . . . . . . . . . . . . . . . . . . . . . . . Progress visit, not otherwise specified . . . . . . . . . . . . . . . . . . . . . . . . . . .General medical examination . . . . . . . . . . . . . . . . . . . . . . . . . . . . . . . . . .Postoperative visit . . . . . . . . . . . . . . . . . . . . . . . . . . . . . . . . . . . . . . . . . .For other and unspecified test results . . . . . . . . . . . . . . . . . . . . . . . . . . .Prenatal examination, routine . . . . . . . . . . . . . . . . . . . . . . . . . . . . . . . . . .Knee symptoms . . . . . . . . . . . . . . . . . . . . . . . . . . . . . . . . . . . . . . . . . . . . .Cough . . . . . . . . . . . . . . . . . . . . . . . . . . . . . . . . . . . . . . . . . . . . . . . . . . . .Medication, other and unspecified kinds . . . . . . . . . . . . . . . . . . . . . . . . .Hypertension . . . . . . . . . . . . . . . . . . . . . . . . . . . . . . . . . . . . . . . . . . . . . .Counseling, not otherwise specified . . . . . . . . . . . . . . . . . . . . . . . . . . . . .Gynecological examination . . . . . . . . . . . . . . . . . . . . . . . . . . . . . . . . . . . .Symptoms referable to throat . . . . . . . . . . . . . . . . . . . . . . . . . . . . . . . . . .Preoperative visit for specified and unspecified types of surgery . . . . . . .Disturbances of sleep . . . . . . . . . . . . . . . . . . . . . . . . . . . . . . . . . . . . . . . .Well-baby examination . . . . . . . . . . . . . . . . . . . . . . . . . . . . . . . . . . . . . . .Anxiety and nervousness . . . . . . . . . . . . . . . . . . . . . . . . . . . . . . . . . . . . .Diabetes mellitus . . . . . . . . . . . . . . . . . . . . . . . . . . . . . . . . . . . . . . . . . . .Stomach and abdominal pain, cramps and spasms . . . . . . . . . . . . . . . . .Diagnosed complications of pregnency and puerperium . . . . . . . . . . . . .Vision dysfunctions . . . . . . . . . . . . . . . . . . . . . . . . . . . . . . . . . . . . . . . . . .All other reasons . . . . . . . . . . . . . . . . . . . . . . . . . . . . . . . . . . . . . . . . . . . 200S135X105S100D205S545D735S3051865860,386 2,296)(2,292)(2,162)(1,481)(18,521)100.0 (0.3)(0.3)(0.2)(1.8)100.0 1.31.90.945.0(2.0)(0.7) (0.7)(0.2)(0.2)(0.2)(0.3)(0.4)(0.2)(2.0) Category not applicable.* Estimate does not meet National Center for Health Statistics standards of reliability.1Based on Reason for Visit Classification for Ambulatory Care (RVC), defined in the 2018 Public Use File Documentation available from: ftp://ftp.cdc.gov/pub/Health Statistics/NCHS/Dataset Documentation/NAMCS/doc2018-508.pdf.2Based on 507,122,000 visits made by females.3Based on 353,263,000 visits made by males.NOTE: Numbers may not add to totals because of rounding.SOURCE: National Center for Health Statistics, National Ambulatory Medical Care Survey, 2018.U.S. Department of Health and Human Services Centers for Disease Control and Prevention National Center for Health Statistics100.0 19.46.72.32.4 1.82.62.22.11.7 1.20.9*2.01.21.40.8*1.248.7(1.9)(1.0)(0.5)(0.8) (0.6)(0.5)(0.7)(0.6)(0.4) (0.4)(0.2) (0.5)(0.2)(0.4)(0.2) (0.3)(2.0)
National Ambulatory Medical Care Survey: 2018 National Summary TablesTable page 1 of 2Table 10. Provider-assessed major reason for office visit, by selected patient and visit characteristics: United States, 2018Patient and visit characteristicNumber of visits(standard error)in reventivecare1Unknownor blankPercent distribution (standard error of percent)All visits860,386 (37,935)100.026.4 (1.6)33.4 (2.1)6.5 (0.7)2.3 (0.6)6.2 (1.1)22.8 (1.8)2.4 2507,122 (25,524)353,263 (18,796)100.0100.026.3 (1.7)26.4 (1.9)30.1 (2.2)38.1 (2.5)6.4 (0.8)6.6 (0.8)2.6 (0.9)2.0 (0.4)6.8 (1.7)5.3 (0.6)25.1 (2.0)19.5 (2.4)2.6 (0.7)2.1 (0.5)WhiteBlack or African AmericanOther3722,966 (32,177)72,623 (7,358)64,796 (14,145)100.0100.0100.027.3 (1.6)18.4 (2.2)24.8 (3.4)34.2 (2.1)32.8 (4.1)24.9 (3.0)6.3 (0.6)8.2 (1.4)* 2.2 (0.5)* 1.1 (0.6)6.3 (1.1)8.1 (2.2)2.6 (1.1)21.3 (1.7)25.6 (4.0)36.7 (5.6)2.4 (0.6)1.9 (0.8)* Ethnicity2Hispanic or LatinoNot Hispanic or LatinoWhiteBlack or African )4.86.86.67.9*(0.9)(0.7)(0.7)(1.5) 1.32.52.3*1.1(0.4)(0.7)(0.5) (0.6)6.46.16.37.8*(1.6)(1.1)(1.0)(2.0) 52.42.1*(0.8)(0.6)(0.7)(0.9) Expected source(s) of payment4Private insuranceMedicareMedicare and Medicaid5Medicaid or CHIP6No 4.4(1.9)(1.8) (3.8)(2.1)(4.6)31.047.7*25.2*46.8(2.1)(3.2) (3.3) (5.9)6.97.116.46.8*4.1(0.8)(1.0)(4.7)(1.2) (1.0)1.52.2*1.5*1.2(0.2)(0.5) (0.5) (0.6)4.85.5*4.4*7.2(0.6)(0.9) (0.9) (1.7)25.4
physician offices in the United States. Statistics are presented on physician practices as well as patient and visit characteristics using data collected in the 2018 National Ambulatory Medical Care Survey (NAMCS). NAMCS is an annual nationally representative sample survey of visits to nonfederal office-based patient care
