Transcription
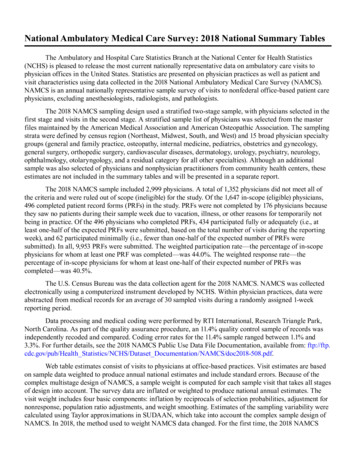
National Hospital Ambulatory Medical Care Survey:2018 Emergency Department Summary TablesThe Ambulatory and Hospital Care Statistics Branch of the National Center for Health Statistics (NCHS)is pleased to release the most current nationally representative data on ambulatory care visits to hospitalemergency departments (EDs) in the United States. Estimates are presented on selected hospital, patient,and visit characteristics using data collected in the 2018 National Hospital Ambulatory Medical Care Survey(NHAMCS). NHAMCS is an annual, nationally representative sample survey of visits to hospitals.The sampling frame for the 2018 NHAMCS was constructed from IQVIA’s Healthcare OrganizationServices (HCOS) database. NHAMCS uses a multistage probability design with samples of primary samplingunits (PSUs), hospitals within PSUs, and patient visits within emergency service areas (ESAs) of eachselected hospital. A total of 490 hospitals were selected for the 2018 NHAMCS, of which 378 were in scopeand had eligible EDs. Of these, 323 responded, yielding an unweighted ED response rate of 85.5%. A total of416 ESAs were identified from the EDs. Of these, 279 responded fully or adequately by providing forms forat least one-half of their expected visits, based on the total number of visits during the reporting period. In all,20,291 Patient Record forms (PRFs) were submitted electronically. The resulting unweighted ESA sampleresponse rate was 67.1%, and the overall unweighted two-stage sampling response rate was 57.3% (60.2%weighted).The U.S. Census Bureau was the data collection agent for the 2018 NHAMCS. NHAMCS data werecollected electronically using a computerized instrument developed by the Census Bureau. Census fieldrepresentatives completed a PRF for a sample of about 100 ED visits during a randomly assigned 4-weekreporting period. The content of the PRF may be viewed at: https://www.cdc.gov/nchs/ahcd/ahcd surveyinstruments.htm#nhamcs.Data processing and medical coding were performed by RTI International, Research Triangle Park, NorthCarolina. As part of the quality assurance procedure, a 13% quality control sample of ED survey recordswas independently keyed and coded. Coding error rates ranged from 0.1% to 0.9% for the ED sample. Forfurther details, see the 2018 NHAMCS public-use data file documentation at: set Documentation/NHAMCS/doc-ed18-508.pdf.Web table estimates are based on sample data weighted to produce annual national estimates and includestandard errors. The sample weight computed for each sample visit takes into account all stages of surveydesign. The survey data are inflated or weighted to produce unbiased national annual estimates. The visitweight includes three basic components: inflation by reciprocals of selection probabilities, adjustmentfor nonresponse, and population ratio adjustments. Estimates of the sampling variability were calculatedusing the Taylor series method in SUDAAN, which accounts for the complex sample design of NHAMCS.Detailed information on the design, conduct, and estimation procedures of 2018 NHAMCS are discussed inthe public-use data file documentation.As in any survey, results are subject to sampling and nonsampling errors. Nonsampling errors includereporting and processing errors as well as biases due to nonresponse and incomplete response. In 2018,race data were missing for 20.7% (unweighted) of ED records, and ethnicity data were missing for 20.5%(unweighted) of ED records. NCHS uses model-based single imputation for NHAMCS race and ethnicitydata. The race imputation, based on research by an internal work group, is restricted to three categories(white, black, and other) because of quality concerns with imputed estimates for race categories otherthan white and black. The imputation technique is described in more detail in the public-use data filedocumentation.U.S. Department of Health and Human Services Centers for Disease Control and Prevention National Center for Health Statistics
NHAMCS ED diagnosis data are coded according to the International Classification of Diseases, 10thRevision, Clinical Modification (ICD–10–CM). Five tables (Tables 11, 12, 16, 17, and 26) that presentestimates of primary diagnoses, injury diagnoses, and primary hospital discharge diagnoses use ICD–10–CMcodes and differ from pre-2016 Web tables presenting diagnosis estimates using the InternationalClassification of Diseases, 9th Revision, Clinical Modification (ICD–9–CM) coding system. Becausedifferences between the ICD–9–CM and ICD–10–CM coding systems are substantial, caution is advisedwhen comparing diagnosis estimates.Proportion estimates are not presented or are flagged based on the procedure specified in “National Centerfor Health Statistics Data Presentation Standards for Proportions,” available from: https://www.cdc.gov/nchs/data/series/sr 02/sr02 175.pdf. For all estimates other than estimates of proportions, the following approachis used: Visit estimates are not presented if they are based on fewer than 30 cases in the sample data, in whichcase only an asterisk (*) appears. Visit estimates based on 30 or more cases include an asterisk if the relativestandard error of the estimate exceeds 30%.Suggested citation: Cairns C, Kang K, Santo L. National Hospital Ambulatory Medical Care Survey:2018 emergency department summary tables. Available from: https://www.cdc.gov/nchs/data/nhamcs/web tables/2018 ed web tables-508.pdf.U.S. Department of Health and Human Services Centers for Disease Control and Prevention National Center for Health Statistics
National Hospital Ambulatory Medical Care Survey: 2018 Emergency Department Summary Tables3Table 1. Emergency department visits, by selected hospital characteristics: United States, 2018CharacteristicAll visitsNumber of visits(standard error)in thousands129,974 (7,280)Percent distribution(standard error)100.0 Number of visitsper 100 persons1(standard error)40.4 (2.3)OwnershipVoluntaryGovernmentProprietary82,619 (6,612)28,623 (4,953)18,732 (4,510)63.6 (4.2)22.0 (3.5)14.4 (3.3)25.6 (2.1)8.9 (1.5)5.8 (1.4)112,754 (7,517)17,220 (2,607)86.8 (2.1)13.3 (2.1)40.2 (2.7)41.3 (6.3)16.120.742.021.337.739.944.535.9Metropolitan status2–4MSANon-MSAGeographic 2.2)(3.7)(4.9)(4.3)(4.1)Teaching hospitalYesNo or blank525,999 (3,456)103,975 (7,722)20.0 (2.8)80.0 (2.8)8.1 (1.1)32.3 (2.4)50,146 (5,574)79,828 (7,404)38.6 (4.1)61.4 (4.1)15.6 (1.7)24.8 .110.19.8Trauma centerYesNo or 5) Category not applicable.1Visit rates for region are based on the July 1, 2018, set of estimates of the U.S. civilian noninstitutional population as developed by the U.S. Census Bureau, Population Division.2MSA is metropolitan statistical area.3Population estimates by MSA are based on estimates of the U.S. civilian noninstitutionalized population as of July 1, 2018, from the 2018 National Health Interview Survey, compiled according tothe February 2013 Office of Management and Budget definitions of core-based statistical areas. More information about MSA definitions is available from: o.html.4For MSA and geographic region, population denominators differ for each category and do not add to the total population rate. For other variables, the denominator is the total population.5Teaching status was unknown for 4.4% (weighted) of visits.6Winter is December 22 to March 19, spring is March 20 to June 20, summer is June 21 to September 22, and fall is September 23 to December 21.NOTE: Numbers may not add to totals due to rounding.SOURCE: National Center for Health Statistics, National Hospital Ambulatory Medical Care Survey, 2018.U.S. Department of Health and Human Services Centers for Disease Control and Prevention National Center for Health Statistics
National Hospital Ambulatory Medical Care Survey: 2018 Emergency Department Summary Tables4Table 2. Emergency department visits, by patient age, sex, and residence: United States, 2018Patient characteristicAll visitsNumber of visits(standard error)in thousands129,974 (7,280)Age groupUnder 15Under 11–45–1415–2425–4445–6465 and over65–7475 and overPercent distribution(standard error)100.0 Number of visitsper 100 persons1(standard error)40.4 .1)(2.0)(2.5)(4.7)ResidencePrivate1Nursing home2Homeless3OtherUnknown or an–rural classification4Large central metroLarge fringe metroMedium metroSmall metroMicropolitanNoncore 2*9.38.5(3.1)(2.3)(3.8) (2.0)(1.1) Sex and age group (years)FemaleUnder 1515–2425–4445–6465–7475 and overMaleUnder 1515–2425–4445–6465–7475 and over Category not applicable.* Estimate does not meet NCHS standards of reliability.1Visit rates for age group, sex, and private residence are based on the July 1, 2018, set of estimates of the U.S. civilian noninstitutional population developed by the U.S. Census Bureau,Population Division.2Visit rates for nursing home residents are based on the 2018 population denominators from the Centers for Medicare & Medicaid Services, 2018 Minimum Data Set Frequency Reports, availablefrom: Report.html.3Visit rates for the homeless are based on the January 2018 estimate of people who were without a home on a given night, as reported in The 2018 Annual Homeless Assessment Report (AHAR) toCongress, available from: .4For each record, county of residence was determined using patient zip code and then matched to the National Center for Health Statistics Urban–Rural Classification Scheme for Counties, availablefrom: https://www.cdc.gov/nchs/data access/urban rural.htm.NOTES: Numbers may not add to totals due to rounding. Visit estimates are not presented if they are based on fewer than 30 cases in the sample data, in which case only an asterisk is shown.Visit estimates based on 30 cases or more include an asterisk if the relative standard error of the estimate exceeds 30%. Proportion estimates are not presented if they are unreliable based on theprocedure specified in "National Center for Health Statistics Data Presentation Standards for Proportions" (available from: https://www.cdc.gov/nchs/data/series/sr 02/sr02 175.pdf), in which caseonly an asterisk is shown.SOURCE: National Center for Health Statistics, National Hospital Ambulatory Medical Care Survey, 2018.U.S. Department of Health and Human Services Centers for Disease Control and Prevention National Center for Health Statistics
National Hospital Ambulatory Medical Care Survey: 2018 Emergency Department Summary Tables5Table 3. Emergency department visits, by patient race, age, and ethnicity: United States, 2018Patient characteristicAll visitsNumber of visits(standard error)in thousands129,974 (7,280)Percent distribution(standard error)100.0 Number of visitsper 100 persons1(standard error)40.4 (2.3)2Race and age group (years)WhiteUnder 1515–2425–4445–6465–7475 and overBlack or African AmericanUnder 1515–2425–4445–6465–7475 and overOther3Ethnicity2Hispanic or LatinoNot Hispanic or LatinoWhiteBlack or African 2) Category not applicable.1Visit rates are based on the July 1, 2018, set of estimates of the U.S. civilian noninstitutionalized population as developed by the U.S. Census Bureau, Population Division.2The race groups white, black or African American, and other include persons of Hispanic and non-Hispanic origin. Persons of Hispanic origin may be of any race. For 2018, race data were missingfor 19.3% (weighted) of visits, and ethnicity data were missing for 20.5% (weighted) of visits. Starting with 2009 data, the National Center for Health Statistics has adopted model-based singleimputation for National Hospital Ambulatory Medical Care Survey (NHAMCS) race and ethnicity data. The race imputation is restricted to three categories (white, black, and other) based on researchby an internal work group and on quality concerns with imputed estimates for race categories other than white and black. The imputation technique is detailed in the 2018 NHAMCS public-use datafile documentation, available from: https://ftp.cdc.gov/pub/Health Statistics/NCHS/Dataset Documentation/NHAMCS/doc-ed18-508.pdf.3Includes the categories of Asian, Native Hawaiian or Other Pacific Islander, American Indian or Alaska Native, and persons with more than one race.NOTE: Numbers may not add to totals due to rounding.SOURCE: National Center for Health Statistics, National Hospital Ambulatory Medical Care Survey, 2018.U.S. Department of Health and Human Services Centers for Disease Control and Prevention National Center for Health Statistics
National Hospital Ambulatory Medical Care Survey: 2018 Emergency Department Summary TablesTable 4. Wait time at emergency department visits: United States, 2018Number of visits(standard error)in thousandsVisit characteristicAll visitsPercent distribution(standard error)129,974 (7,280)Time spent waiting to see a physician, APRN, orLess than 15 minutes15–59 minutes1 hour, but less than 2 hours2 hours, but less than 3 hours3 hours, but less than 4 hours4 hours, but less than 6 hours6 hours or moreNot applicableBlankTime spent in emergency departmentLess than 1 hour1 hour, but less than 2 hours2 hours, but less than 4 hours4 hours, but less than 6 hours6 hours, but less than 10 hours10 hours, but less than 14 hours14 hours, but less than 24 hours24 hours or moreBlank100.0 .8)Patient arrived in emergency departmentafter business hours2YesNoBlank74,549 (4,435)53,202 (3,126)2,223 (617)57.4 (0.6)40.9 (0.6)1.7 (0.5) Category not applicable.1APRN is advanced practice registered nurse. PA is physician assistant. The median wait time to see a physician, APRN, or PA was15.0 minutes; the mean wait time to see a physician, APRN, or PA was 35.7 minutes.2Business hours are defined as Monday through Friday, 8 a.m. to 5 p.m.NOTE: Numbers may not add to totals due to rounding.SOURCE: National Center for Health Statistics, National Hospital Ambulatory Medical Care Survey, 2018.U.S. Department of Health and Human Services Centers for Disease Control and Prevention National Center for Health Statistics6
National Hospital Ambulatory Medical Care Survey: 2018 Emergency Department Summary Tables7Table 5. Mode of arrival at emergency department, by patient age: United States, 2018Age group (years)Number of visitsin thousandsPatient's mode of arrivalTotal1AmbulanceOtherUnknown or blankPercent distribution (standard error)All visitsUnder 15Under 11–45–1415–2425–4445–6465 and over65–7475 and 33.426.739.1(0.8)(1.6)(1.8)(1.1) (1.1) (1.3) (0.9)(1.1)(0.8)* Estimate does not meet NCHS standards of reliability. Category not applicable.1Ambulance was the mode of arrival for 20,851,000 visits; other was the mode of arrival for 103,575,000 visits.NOTES: Numbers may not add to totals due to rounding. Visit estimates are not presented if they are based on fewer than 30 cases in the sample data, in which case only an asterisk is shown.Visit estimates based on 30 cases or more include an asterisk if the relative standard error of the estimate exceeds 30%. Proportion estimates are not presented if they are unreliable based on theprocedure specified in "National Center for Health Statistics Data Presentation Standards for Proportions" (available from: https://www.cdc.gov/nchs/data/series/sr 02/sr02 175.pdf), in which caseonly an asterisk is shown.SOURCE: National Center for Health Statistics, National Hospital Ambulatory Medical Care Survey, 2018.U.S. Department of Health and Human Services Centers for Disease Control and Prevention National Center for Health Statistics
National Hospital Ambulatory Medical Care Survey: 2018 Emergency Department Summary TablesTable 6. Expected source of payment at emergency department visits: United States, 2018Payment sourceAll visitsPrivate insuranceMedicaid or CHIP2 or other state-based programMedicareMedicare and Medicaid3No insurance4Self-payNo charge or charityWorker's compensationOtherUnknown or blankNumber of visits1(standard error)in thousandsPercent of visits(standard error)129,974 (7,280) 1.4)(2.1)(1.0)(0.3)(0.8)(0.8)(0.2)(0.1)(0.4)(2.5) Category not applicable.* Estimate does not meet NCHS standards of reliability.1Total exceeds"All visits" and percentage exceeds 100% because more than one source of payment may be reported per visit.2Children's Health Insurance Program.3Visits are also included in the "Medicaid or CHIP or other state-based program" and "Medicare" categories.4Defined as having only self-pay, no charge, or charity as payment sources.NOTES: Numbers may not add to totals due to rounding. Visit estimates are not presented if they are based on fewer than 30 casesin the sample data, in which case only an asterisk is shown. Visit estimates based on 30 cases or more include an asterisk if therelative standard error of the estimate exceeds 30%. Proportion estimates are not presented if they are unreliable based on theprocedure specified in "National Center for Health Statistics Data Presentation Standards for Proportions" (available from:https://www.cdc.gov/nchs/data/series/sr 02/sr02 175.pdf), in which case only an asterisk is shown.SOURCE: National Center for Health Statistics, National Hospital Ambulatory Medical Care Survey, 2018.U.S. Department of Health and Human Services Centers for Disease Control and Prevention National Center for Health Statistics8
National Hospital Ambulatory Medical Care Survey: 2018 Emergency Department Summary Tables9Table 7. Triage status of emergency department visits, by selected patient and visit characteristics: United States, 2018Patient and visit characteristicsNumber of visitsin thousandsTotalLevel 1(immediate)Level 2(emergent)Level 3(urgent)Level 4(semiurgent)Level 5(nonurgent)No triage1Unknownor blankPercent distribution (standard error)All visits129,974100.01.0 (0.2)10.9 (0.9)34.5 (2.0)21.9 (1.5)3.1 (0.5)6.0 (1.7)22.7 ,35257,622100.0100.00.8 (0.2)1.2 (0.3)9.6 (0.9)12.5 (1.1)36.5 (2.2)31.9 (1.8)21.5 (1.6)22.4 (1.5)2.6 (0.6)3.6 (0.6)6.2 (1.8)5.8 (1.6)22.8 (2.8)22.6 (2.8)Race2WhiteBlack or African AmericanOther388,70735,6395,628100.0100.0100.00.8 (0.2)1.4 (0.5)0.8 (0.3)11.1 (1.0)10.2 (1.1)13.6 (2.2)35.2 (2.0)32.3 (2.9)36.7 (3.0)21.3 (1.4)23.3 (2.6)23.0 (2.6)2.7 (0.5)3.8 (1.0)4.5 (0.9)5.8 (1.6)* * 23.2 (2.9)22.4 (3.7)17.0 100.0100.00.6 (0.3)1.0 (0.3)0.8 (0.2)(0.5)0.9 22.417.1Age group (years)Under 15Under 11–45–1415–2425–4445–6465 and over65–7475 and over(0.2)(0.6) (0.3)(0.2) (1.1)(1.4)(1.1)(1.6)(1.3) (1.4)(0.4)(0.5)(2.0)(0.7)(0.6)(0.9) (1.6)(1.0) (1.7)(2.0)(1.8) SexEthnicity and race2Hispanic or LatinoNot Hispanic or LatinoWhiteBlack or African 0.4)(1.0)(1.0)See footnotes at end of table.U.S. Department of Health and Human Services Centers for Disease Control and Prevention National Center for Health Statistics (1.7)(1.5) (3.6)(2.9)(3.2)(3.8)(3.7)
National Hospital Ambulatory Medical Care Survey: 2018 Emergency Department Summary Tables10Table 7. Triage status of emergency department visits, by selected patient and visit characteristics: United States, 2018—Con.Patient and visit characteristicsNumber of visitsin thousandsTotalLevel 1(immediate)Level 2(emergent)Level 3(urgent)Expected source of payment4Private insuranceMedicaid or CHIP5 orother state-based programMedicareMedicare and Medicaid6No insurance7Worker's compensationOtherUnknown or blankLevel 4(semiurgent)Level 5(nonurgent)No triage1Unknownor blank* 21.2 (3.5)Percent distribution (standard error)40,003100.01.0 (0.3)12.1 (1.3)39.1 (2.4)18.7 (1.4)2.1 0.7)(0.4)(1.7)(0.7) 4.4***7.0**(1.3) (2.8) .8)(3.6)(7.5)* Estimate does not meet NCHS standards of reliability. Category not applicable.1A visit in which the emergency service area (ESA) coded nursing triage as zero (admitted to hospital or treated immediately) or visit occurred in an ESA that does not conduct triage.2The race groups white, black or African American, and other include persons of Hispanic and non-Hispanic origin. Persons of Hispanic origin may be of any race. Starting with 2009 data, the National Center for Health Statistics has adopted model-basedsingle imputation for National Hospital Ambulatory Medical Care Survey (NHAMCS) race and ethnicity data. The race imputation is restricted to three categories (white, black, and other) based on research by an internal work group and on quality concerns withimputed estimates for race categories other than white or black. The imputation technique is detailed in the 2018 NHAMCS public-use data file documentation, available from: https://ftp.cdc.gov/pub/Health Statistics/NCHS/Dataset Documentation/NHAMCS/doc-ed18-508.pdf. For 2018, race data were missing for 19.3% (weighted) of visits, and ethnicity data were missing for 20.5% (weighted) of visits.3Includes the categories of Asian, Native Hawaiian or Other Pacific Islander, American Indian or Alaska Native, and persons with more than one race.4Total exceeds "All visits" because more than one source of payment may be reported per visit.5Children's Health Insurance Program.6Visits are also included in both the "Medicaid or CHIP or other state-based program" and"Medicare" categories.7Defined as having only self-pay, no charge, or charity as payment sources.NOTES: The 2018 Patient Record form (PRF) requested responses using a 1–5 scale. PRF responses were evaluated with reference to responses on the Ambulatory Unit Record, completed during induction, to the question, "How many levels are in thisemergency service area’s (ESA) triage system?" ESAs using 3- or 4-level triage systems had their responses rescaled to fit the 5-level system, such that for 3-level ESAs, responses of 1, 2, and 3 were recoded to 2, 3, and 4. For ESAs using a 4-level system,responses were recoded from 1–4 to 2–5. The rescaling method was determined in consultation with subject-matter experts and based on record analysis. Rescaling was required for about 0.3% of records, or 0.3% of records with nonmissing data. Triagelevel was imputed in years before 2012. Starting in 2012, triage level is not imputed. Numbers may not add to totals due to rounding. Visit estimates are not presented if they are based on fewer than 30 cases in the sample data, in which case only an asteriskis shown. Visit estimates based on 30 cases or more include an asterisk if the relative standard error of the estimate exceeds 30%. Proportion estimates are not presented if they are unreliable based on the procedure specified in "National Center for HealthStatistics Data Presentation Standards for Proportions" (available from: https://www.cdc.gov/nchs/data/series/sr 02/sr02 175.pdf), in which case only an asterisk is shown.SOURCE: National Center for Health Statistics, National Hospital Ambulatory Medical Care Survey, 2018.U.S. Department of Health and Human Services Centers for Disease Control and Prevention National Center for Health Statistics
National Hospital Ambulatory Medical Care Survey: 2018 Emergency Department Summary Tables11Table 8. Initial blood pressure measurements recorded at emergency department visits for adults, by selected patient characteristics: United States, 2018Initial blood pressure1Patient characteristicNumber of visitsin thousandsTotalNot high(SBP less than120 mmHg and DBP lessthan 80 mmHg)Prehypertension(SBP 120–139 mmHg orDBP 80–89 mmHg)Stage 2 hypertensionStage 1 hypertension(SBP greater than or equal(SBP 140–159 mmHg orto 160 mmHg or DBPDBP 90–99 mmHg)greater than 100 mmHg)Percent distribution (standard error)All visits295,703100.018.2 (0.5)33.8 (0.6)27.3 (0.6)20.7 5,00440,699100.0100.021.1 (0.8)14.3 (0.6)33.8 (0.8)33.7 (0.9)24.8 (0.7)30.6 (0.9)20.3 (0.8)21.4 (0.7)Race3WhiteBlack or African AmericanOther466,42325,6413,638100.0100.0100.017.9 (0.6)17.9 (1.0)26.6 (2.5)33.6 (0.7)34.8 (1.2)29.2 (2.3)28.2 (0.7)25.2 (0.8)24.5 (2.0)20.3 (0.7)22.1 (1.1)19.7 (2.5)Ethnicity and race3Hispanic or LatinoNot Hispanic or LatinoWhiteBlack or African e group (years)18–2425–4445–6465–7475 and )(1.2)(2.5)is systolic blood pressure. DBP is diastolic blood pressure. Three high blood pressure categories (with SBP greater than 120 or DBP greater than 80) are based on "The Seventh Report of the Joint National Committee on Prevention, Detection,Evaluation, and Treatment of High Blood Pressure" and correspond to prehypertensive, stage 1 hypertensive, and stage 2 hypertensive ranges. If SBP and DBP fall into two categories, the visit is included in the higher blood pressure category.2Visits by adults (aged 18 and over). Visits where blood pressure was taken represent 95.1% (standard error 0.9) of all emergency department visits made by adults.3The race groups white, black or African American, and other include persons of Hispanic and non-Hispanic origin. Persons of Hispanic origin may be of any race. For 2018, race data were missing for 18.8% (weighted) of adult visits, and ethnicity datawere missing for 20.2% (weighted) of adult visits. Beginning with 2009, the National Center for Health Statistics has adopted model-based single imputation for National Hospital Ambulatory Medical Care Survey (NHAMCS) race and ethnicity data. The raceimputation is restricted to three categories (white, black, and other) based on research by an internal work group and on quality concerns with imputed estimates for race categories other than white or black. The imputation technique is detailed in the 2018NHAMCS public-use data file documentation, available from: https://ftp.cdc.gov/pub/Health Statistics/NCHS/Dataset Doc
S Department o Healt and Human Services Centers or Disease Control and revention National Center or Healt Statistics National Hospital Ambulatory Medical Care Survey:
