Transcription
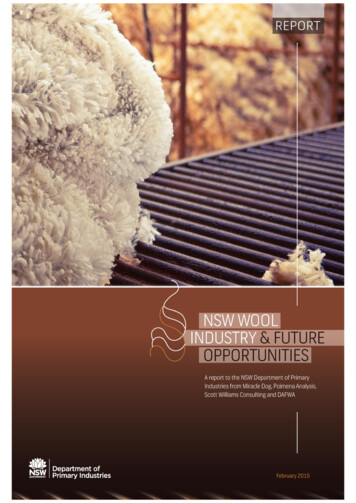
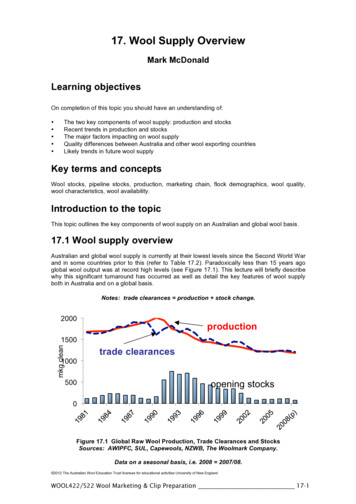
17. Wool Supply OverviewMark McDonaldLearning objectivesOn completion of this topic you should have an understanding of: The two key components of wool supply: production and stocksRecent trends in production and stocksThe major factors impacting on wool supplyQuality differences between Australia and other wool exporting countriesLikely trends in future wool supplyKey terms and conceptsWool stocks, pipeline stocks, production, marketing chain, flock demographics, wool quality,wool characteristics, wool availability.Introduction to the topicThis topic outlines the key components of wool supply on an Australian and global wool basis.17.1 Wool supply overviewAustralian and global wool supply is currently at their lowest levels since the Second World Warand in some countries prior to this (refer to Table 17.2). Paradoxically less than 15 years agoglobal wool output was at record high levels (see Figure 17.1). This lecture will briefly describewhy this significant turnaround has occurred as well as detail the key features of wool supplyboth in Australia and on a global basis.Notes: trade clearances production stock change.2000productionmkg clean1500trade clearances1000500opening stocks0Figure 17.1 Global Raw Wool Production, Trade Clearances and StocksSources: AWIPFC, SUL, Capewools, NZWB, The Woolmark Company.Data on a seasonal basis, i.e. 2008 2007/08. 2012 The Australian Wool Education Trust licensee for educational activities University of New EnglandWOOL422/522 Wool Marketing & Clip Preparation 17-1
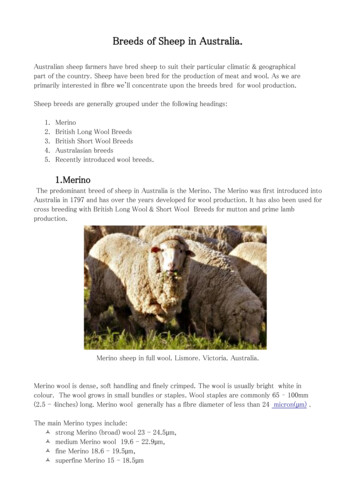
Notes – Topic 17 – Wool Supply Overview17.2 Wool supply componentsA significant characteristic of wool the commodity is the long marketing chain coupled with thelong production response (in terms of changing profile and quantity). This often leads to widelydiverging supply/demand conditions at various stages of this marketing chain and helps toexplain the price volatility of the product (see Figure 17.2). Wool supply can be divided into twokey components: Wool production StocksThe relative importance of each component will vary depending on the position in the marketingchain and the stage of the economic cycle.Figure 17.2 World Wool Production and Supply (mkg clean)Sources: The Woolmark Company, official statistics and industry bodies.Notes: (c) calendar year data 2006/07 2007.1989/901995/962005/06New Zealand724231452199327172301165286163China entinaSouth Africa94595137482848284629World Production67820074741445420123442312024241181Stock Changes (b)World er2006/072007/08f17.3 Wool productionWool production generally refers to the annual output of wool. The quantity and quality of eachannual clip will reflect: short term seasonal and price factors longer term breeding objectives and industry trends.As stated previously the later factor is often controlled by the former issues of season and price.In 2003 the current wool supply in Australia reflects the impact of the drought as well as thecontinued trend to finer wool production.The quality of production will also vary depending on seasons in particular. The incidence offaults in production (i.e. tenderness, colour, VM% and skin parasites) will usually be a reflectionon seasonal conditions. 2012 The Australian Wool Education Trust licensee for educational activities University of New England17-2 WOOL422/522 Wool Marketing & Clip Preparation
Notes – Topic 17 – Wool Supply OverviewIn comparison with other broadacre and intensive agricultural enterprises the Australian woolindustry has been slow in raising individual animal output. The wt/head in kgs has remainedaround the 4.3 kgs average for several decades. This lack of productivity improvement will be akey limiting factor in raising future annual production.Wool stocksThe long wool supply chain contains stocks at all points, which will vary depending on relevantsupply/demand factors. The early 1990’s were characterised by large stockpiles of wool held bythe major exporting countries. It took almost ten years to clear these stocks with resultantimpacts on the wool market (see Figure 17.3).However, stocks also exist on farm, and as top and fabric further down the marketing chain. Thequantities and qualities of supply chain stock will often move in a cyclic pattern reflecting theeconomic cycle from the major consuming countries. At least three complete cycles wereevident in world wool trade after the introduction of the reserve price scheme in the 1970’s, thelast of which was fatal to the scheme itself.Official stocks600Private 19992001200320052007Figure 17.3: Australian Wool Stocks ( mkg at 30 June)Source: WI, NCSWB, AWEX, The Woolmark CompanyWith the absence of the industry wide buffer stock price scheme the 1990’s were characterisedby large grower stocks both on farm and stored in brokers’ stores. These stocks have beenrapidly drawn down since the final stockpile wool was sold in 2002. These on farm stocks wereconcentrated in wheat/sheep properties across Australia in response to rising grain prices in themid to late 1990’s.It is likely that grower stocks will continue to provide the buffer for market conditions as theprocessing sector continues to minimise its inventories to minimise the market risk. Given thevolatility of the wool market this may well be the most economic response (ie the growersassume the stockholding risk).Other factorsWool supply is also related to other industry variables particularly employment andinfrastructure. Current capacity in most of the marketing chain is geared to accept up to 800 –900 m kg/pa from Australia. With current production and stocks (availability) at their lowest levelfor decades it is likely that further rationalisation of this infrastructure will occur in the short tomedium term. If this occurs then the resulting infrastructure reduced capability will then impacton the amount of annual availability that can be processed. At this stage there is still asignificant gap between the potential capacity and the required capacity. The availability of wool 2012 The Australian Wool Education Trust licensee for educational activities University of New EnglandWOOL422/522 Wool Marketing & Clip Preparation 17-3
Notes – Topic 17 – Wool Supply Overviewalso needs to be considered in relation to two other factors: Australia’s agricultural productive capacity the global textile market.Australian agricultural capacityThe land available for agricultural production in Australia has almost reached capacity. Withlimited clearance opportunities in the future and the continued encroachment by non-agriculturalcompetitors eg urban development, this capacity may well decline over time.Traditionally, Australian agricultural production has been dominated by the big three broadacreenterprises, beef, cropping and wool. Table 17.3 highlights the changes in relative productionfor these commodities over time. It is this second factor that generally drives the productionresponses detailed in Table 17.1 therefore any future increase in Australia’s wool production willbe at the expense of either beef or cropping in the mixed enterprise properties. This typically willonly occur if the price relativities favour a return to wool both in the short to medium term.Global textile marketWool is only a small player in the global textile market. From a peak of around 5-8% of the totalmarket post war this market share has declined to around 3% by the turn of the century.This relative drop in market share partially reflects the large increase in cotton and syntheticoutput since the 1960’s and more recently the significant decline in wool availability in the late1990’s. As such wool is increasingly becoming a nice specialised textile product largelyrestricted to the more expensive formal wear market segment.17.4 Wool supply: The Australian perspectiveThe supply of wool in Australia rarely stays in a similar pattern for long periods of times basedon historical analysis. If any trend is consistent it is this constant rescaling of production (eitherincreasing/decreasing) rather than stable periods of production (refer to Figure 17.4 and Tables17.4, 17.5).Currently Australian wool supply is undergoing a major restructure based on the followingdrivers: the ongoing response to the market failure of the early 1990’s and low returns for most of this decade.Better prices for the main broadacre alternatives eg cropping and beef cattle production,resulting in a large decrease in sheep numbers in these regionsA ten year trend towards finer wool productionA recent return to a higher percentage of sheep devoted to prime lamb productionThe main losers during this restructure have been wethers which have fallen from almost50% of the flock in the 1990’s to less than 30% currently. 2012 The Australian Wool Education Trust licensee for educational activities University of New England17-4 WOOL422/522 Wool Marketing & Clip Preparation
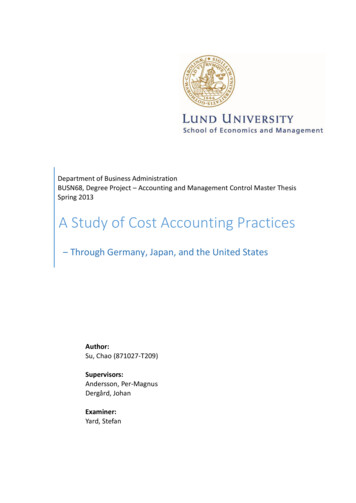
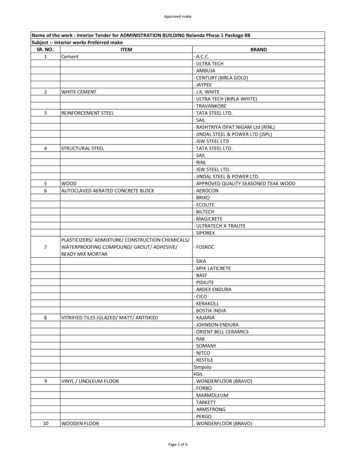
Notes – Topic 17 – Wool Supply OverviewWool production(mkg greasy)120010008006004002000Sheep numbers (million)WoolSheep200Lowest since1920150100500Figure 17.4 Australian Wool Production Continues to DeclineSources: ABS, AWI Wool Production Forecasting CommitteeThe Australian flock in 2003 is returning to a similar demographic structure evident during mostof the 1970’s. This includes a higher proportion of ewes devoted to fat lamb production and ahigher percentage of fine wool ( 19 micron). However, the later factor is overstated. Productionof fine wool has risen gradually during the 1990’s while total production has declined from 1,000mkg to an estimated 470 mkg in 2003/04. Therefore in percentage terms its proportion has risensignificantly at the expense of middle micron wools.The estimated 470m kg in 2003/04 will be the lowest annual output for almost 60 years and willcause serious supply shortages given the low stocks held throughout most of the pipeline.Paradoxically, the only area of oversupply is likely to exist for fine wool stocks, which have beenartificially boosted in the past twelve months due to drought affected hungerfine wool (refer toFigures 17.5, 17.6 and 17.7).160140mkg greasy equiv12010019.5 um & finer 126%% Increase 1992/93 to2007/08 306%806018.5 um & finer40200Figure 17.6 Declining Production of Australian Mid-Micron WoolSources: The Woolmark Company, AWTA, AWIWPFC. f forecast 2012 The Australian Wool Education Trust licensee for educational activities University of New EnglandWOOL422/522 Wool Marketing & Clip Preparation 17-5
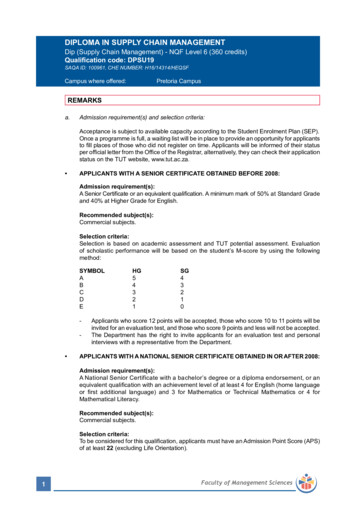
Notes – Topic 17 – Wool Supply Overview70020-25 ummkg greasy equiv600% decrease1992/93 to2007/0850040020-23 um300-68%200-65%1000Figure 17.5 Increasing Production of Australian Fine & Superfine WoolSources: The Woolmark Company, AWTA, AWIWPFC. f forecastmkg greasy equiv.2826242220181614121086420Western EuropeChina/ HKEast AsiaJan Jul Jan Jul Jan Jul Jan Jul Jan Jul Jan July Jan July Jan July Jan July Jan July Jan1998 1999 2000 2001 2002 2003 2004 2005 2006 2007 2008Figure 17.7 Australian Wool Exports (12 mma).Source: ABS, Woolmark. Note: Includes greasy, scoured, carbonised, tops noils andwaste. Data to January 2008. 2012 The Australian Wool Education Trust licensee for educational activities University of New England17-6 WOOL422/522 Wool Marketing & Clip Preparation
Notes – Topic 17 – Wool Supply OverviewOther factorsAs discussed previously environment, flock demographics and market conditions are the maindrivers of Australian wool supply over time. From a farmer’s perspective he can really onlycontrol the second factor and does it based on his viewpoint on the other factors.In terms of market conditions a large proportion of potential wool production is located ingeographic areas that are capable of multiple agricultural use eg cropping, other livestock andhorticulture. Therefore, the relative returns for these alternatives will be just as important asactual wool prices, eg grain prices, fat lambs, and beef. In the last twelve years thecomparatively higher returns for alternatives has been a primary driver in reducing Australia’swool clip. It is also important to remember that perceived future returns are just as important ascurrent prices when producers are making their production decisions.Therefore, the recent return to a higher proportion of ewes devoted to fat lamb productionreflects these basic market factors eg high lamb prices (refer to Table 16.4). However, thisrestructure of the flock will have ongoing impacts on the ability to increase apparel woolproduction in the future. Joining to terminal fat lamb sires restricts the ability of the national flockto renew its Merino base of wethers and ewes.Wool qualityThe quality of the Australian wool clip is an issue that will elicit different responses depending onyour position in the marketing chain. Analysis of the various wool parameters (i.e. faults, style,yields etc over time reveals a steady state with most annual changes reflecting environmentalconditions) (refer to Table 17.6).Examples of this include: higher percentage of tenderness faults during drought conditions higher VM and colour fault percentages during good seasons.Micron is not discussed in this section as it is a special wool characteristic that is the main focusof the majority of breeding programs. Suffice to say that it is the one wool characteristic that hasshown a significant trend (towards finer wool) over the last twelve years. Buyer opinion of thewool clip is more negative with many believing that the ‘quality’ of the clip has declined steadilyin recent years.Geographic location and flock demographicsWool production is undertaken in all Australian states with the exception of NT (refer to Table17.1). Generally production can be categorised into the following geographical models.Wheat / sheep zones. These areas are present in all states with the exception of Tasmania.The large decline in sheep numbers of the last decade has predominantly been in these areas.Traditionally, a higher proportion of wethers are run. Main use is in stubble control and forpasture rotation with cropping. WA and SA are the main states with this profile while NSW andVIC also have significant areas.High rainfall wool zones. These specialist production areas are characterised by a highproposition of wool / lamb only enterprises with most fine wool production coming from theselocations. The main areas are Western Victoria (Hamilton), Southern and New EnglandHighlands (Goulburn, Armidale) and Tasmania. These properties tend to be wool specific andtheir numbers have not declined significantly during the industry restructure of the 1990’s.Pastoral zone. Marginal pastoral areas characterised by low rainfall and larger farms. Thesesheep usually receive minimal attention and the quality of their wools is often compromised bythe environmental conditions eg more tender fault and dust penetration. QLD and parts of NSW,SA and WA are the main states with this profile. 2012 The Australian Wool Education Trust licensee for educational activities University of New EnglandWOOL422/522 Wool Marketing & Clip Preparation 17-7
Notes – Topic 17 – Wool Supply OverviewPrime lamb production. These zones are often similar to the high rainfall areas but have theenvironment best suited to prime lamb production. Victoria, Tasmania and parts of NSW are themain production zones with the lambs predominantly Merino/Terminal Sire. Note that largequantities of Merino or fist cross lambs are also produced in other production zones but lambingin these areas is secondary to wool production.The main features of each state’s production are listed below:QueenslandMainly pastoral based production of 21 – 25 microns. Quality is generally lower than otherEastern states’ wool from an almost 100% Merino flock base. Production from Queensland hasdeclined significantly since 1990 with the flock base the lowest since the early 1900’s.New South WalesNSW is the largest production state with a complete range of production from superfine wool tobroad pastoral clips ( 16 to 30 micron). Large declines in the wheat/sheep and beef/sheepzones in the last decade and a swing towards prime lamb production in the high rainfall areaswill continue to keep NSW production at a low base in the short to medium term. The flock baseis at its lowest since the late 1940’s.VictoriaThe largest range of wool types produced by any state is derived from Victoria. This affects theproduction base spread across fine wool, wheat/sheep, pastoral and fat lamb zones. Recenttrends include a move to more fine wool and prime lamb production. The production base is lessaffected than most other states but still the lowest in 25 years.TasmaniaTasmania is the specialist fine wool production state with a significant prime lamb component.Most production is in the sub 21 micron range but a return to increased prime lamb productionwill see this micron range expand. Sheep numbers are at their lowest level since the 1950’s.South AustraliaSA is principally pastoral zone and wheat/sheep zone production from a mainly Merino flock.There is a small pocket of lamb production in the South East corner of the state. SA has thebroadest micron profile of any state with most wool in the 22 – 26 micron band. There has beena large decline in numbers in the wheat/sheep zone over the last decade with the flock size thelowest since the 1950’s.Western AustraliaThere has been a significant decline in production over the last ten years as wheat/sheepproducers concentrated on cropping. WA is the largest live sheep export state based on aMerino flock producing 21-24 micron wool Quality tends to be lower than Eastern States due tosignificant dust/sand penetration. It has the lowest production base since the mid-1960’s after alarge increase in output in the 70-80’s, but it is the second largest production base in Australia.17.5 Wool supply: Overseas' profileThe supply and production of wool from outside of Australia has followed similar trends to recentAustralian experience. As Australia produces almost 70% of apparel wool exports on a globalbasis it is the major price and production influencing nation for this commodity. (Refer to table17.13).Non-Australian wool production can be categorised into two main components:1. Other wool exportersThe export trade in wool is dominated by four other nations after Australia, which representsaround 35% of total trade on a global basis. A brief description of each of these countries andtheir production characteristics is detailed below. 2012 The Australian Wool Education Trust licensee for educational activities University of New England17-8 WOOL422/522 Wool Marketing & Clip Preparation
Notes – Topic 17 – Wool Supply OverviewNew Zealand (refer to Table 17.7) New Zealand occupies a similar role to Australia in theexport and production of non-apparel wool eg carpet, furniture and office textiles. It is thedominant exporter of these products on the world market. This reflects the demographics of itsproduction base, which is predominately lamb/wool, plus a small but specialised fine wool ( 21micron) sector.The majority of New Zealand wool is in the 30 micron and broader range. In recent years therelative importance of the fine wool sector has increased both in terms of value and percentageof production while their middle micron band (25 – 30) has been the biggest loser in relativeimportance in recent times.NZ stockpiles were eliminated more rapidly than Australia’s after the early 1990’s marketcollapse but their wool supply trends have been similar to Australia’s since then. The ongoingability of NZ to increase supply in the medium term is increasingly being compromised by theloss of land to alternative production choices eg forestry, deer, dairy and beef cattle.South Africa (refer to Table 17.8)Production of wool in South Africa is tracking an identical path to Australia over the last tenyears. Its output has declined significantly due to poor seasons, low prices and the pressure foranimal protein from a growing population. The production profile of the South African clip issimilar to Australia’s in that it is predominately Merino wool in the 20 – 25 micron band.However, recent trends to dual-purpose meat breed sheep have affected the quality andquantity of Merino wool from this market South Africa operates a similar market structure toAustralia with just one auction centre based in Port Elizabeth.South AmericaArgentina and Uruguay are the two main wool producing and exporting nations in SouthAmerica. Both countries specialise in Corriedale wool production (23 – 27 micron) with smallerquantities of finer wool produced generally. Trends in production have been similar to Australiawith the reduction in output tending to occur quicker than in Australia throughout the 1990’s.2. Other wool producer (non-exporters)A quick reference to Table 17.2 will illustrate that Australian wool production and flock size isgradually losing its predominance in wool supply. In particular Chinese production has risensteadily in quantity if not quality over the last decade. Significant quantities of wool (generally ofthe non-apparel meat by-product variety) are produced by other nations. In general thisproduction is used locally with only limited quantities exported in competition to apparel woolexports.The trend in the medium term is likely to see Australia’s dominance in global wool supplydeclining as various nations maintain and enhance the quantity and quality of wool production.However, Australia’s position as the eminent supplier of apparel wool is unlikely to suffer giventhese trends due to the dominance of dual purpose meat/sheep animals in these non-exportingnations eg UK, Russia. 2012 The Australian Wool Education Trust licensee for educational activities University of New EnglandWOOL422/522 Wool Marketing & Clip Preparation 17-9
Notes – Topic 17 – Wool Supply OverviewTable 17.1 AUSTRALIAN SHEEP POPULATION BY STATES (million head)Source: ABS, AWI Australian Wool Production Forecasting Committee. Note: (a) low point of drought, (e) estimateSeasonN.S.WVIC.QLD.S.A.W.A.TAS.NT .24.00.1131.31978/79 82/8345.725.312.416.730.34.50.1135.01983/84 4.010.017.62.10.076.92009/10 (e)25.615.14.310.015.72.10.072.82010/11 (f)23.914.43.69.114.72.00.067.72011/12 (f)-------68.3 2012 The Australian Wool Education Trust licensee for educational activities University of New England17-10 WOOL422/522 Wool Marketing & Clip Preparation
Notes – Topic 17 – Wool Supply OverviewTABLE 17.2 WORLD SHEEP POPULATIONt (million New ZealandPakistanSouth 1.1378.31024.5Sources: Australian Bureau of Statistics, Australian Wool Production Forecasting Committee, Cape Wools SA,China Statistical Yearbook, Federacion Lanera Argentina, Food and Agriculture Organisation, NationalDepartment of Agriculture, South Africa, New Zealand Ministry of Agriculture and Forestry, SecretariadoUruguayo de la Lana, Statistics New Zealand, The Woolmark Company, UK Ministry of Agriculture, USDepartment of Agriculture, WoolmarkLast revised: 29/04/2008 2012 The Australian Wool Education Trust licensee for educational activities University of New EnglandWOOL422/522 Wool Marketing & Clip Preparation 17-11
Notes – Topic 17 – Wool Supply OverviewTable 17.3: Cattle and Sheep Population and Cropping Areas. Source: ABS.CattleSheepNumberNumberYear(million) Change 01.1Source: ABS Catalogue no 6.16.05.95.95.95.75.75.65.95.75.7Wheat .0%11.170-3.1%13.06717.0%13.3992.5% 2011 The Australian Wool Education Trust licensee for educational activities University of New England17-12 WOOL422/522 Wool Marketing & Clip Preparation
Notes – Topic 17 – Wool Supply OverviewTable 17.4 AUSTRALIAN WOOL PRODUCTION (million kg greasy)ABS, AWI Australian Wool Production Forecasting Committee, ABARE Note: Totals maynot add due to roundingShorn wool incl.CrutchingsDead and fellmongered plus woolon skinsTotal 5202005/06461495102006/07430474772007/08 e400474472008/09 f38545430Year 2012 The Australian Wool Education Trust licensee for educational activities University of New EnglandWOOL422/522 Wool Marketing & Clip Preparation 17-13
Notes – Topic 17 – Wool Supply OverviewTable 17.5 Australian Total Wool Production (a). Source: ABS, Catalogue No 7124.0a) Production of greasy wool shorn, dead and fellmontered and exported on skinsproduced by each of the states from 1901 to 1973 was compiled from data received fromgrowers. From 1974, the statistics show the amount of taxable wool received by brokersYearNSWVicQldSAWATasAustraliaand purchased by dealers from wool producers during financial years ending June 30. 2011 The Australian Wool Education Trust licensee for educational activities University of New England17-14 WOOL422/522 Wool Marketing & Clip Preparation
Notes – Topic 17 – Wool Supply .4182.2196.4209.5209.6237.6230.0240.9300.124
This topic outlines the key components of wool supply on an Australian and global wool basis. 17.1 Wool supply overview Australian and global wool supply is currently at their lowest levels since the Second World War and in some countries prior to this (refer to Table 17.2). Paradoxically less than 15 years ago global wool output was at record .