Transcription
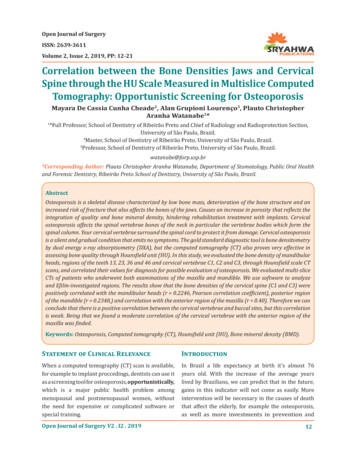
Open Journal of SurgeryISSN: 2639-3611Volume 2, Issue 2, 2019, PP: 12-21Correlation between the Bone Densities Jaws and CervicalSpine through the HU Scale Measured in Multislice ComputedTomography: Opportunistic Screening for OsteoporosisMayara De Cassia Cunha Cheade2, Alan Grupioni Lourenço3, Plauto ChristopherAranha Watanabe1**Full Professor, School of Dentistry of Ribeirão Preto and Chief of Radiology and Radioprotection Section,University of São Paulo, Brazil.2Master, School of Dentistry of Ribeirão Preto, University of São Paulo, Brazil.3Professor, School of Dentistry of Ribeirão Preto, University of São Paulo, Brazil.1watanabe@forp.usp.br*Corresponding Author: Plauto Christopher Aranha Watanabe, Department of Stomatology, Public Oral Healthand Forensic Dentistry, Ribeirão Preto School of Dentistry, University of São Paulo, Brazil.AbstractOsteoporosis is a skeletal disease characterized by low bone mass, deterioration of the bone structure and anincreased risk of fracture that also affects the bones of the jaws. Causes an increase in porosity that reflects theintegration of quality and bone mineral density, hindering rehabilitation treatment with implants. Cervicalosteoporosis affects the spinal vertebrae bones of the neck in particular the vertebrae bodies which form thespinal column. Your cervical vertebrae surround the spinal cord to protect it from damage. Cervical osteoporosisis a silent and gradual condition that emits no symptoms. The gold standard diagnostic tool is bone densitometryby dual energy x-ray absorptiometry (DXA), but the computed tomography (CT) also proves very effective inassessing bone quality through Hounsfield unit (HU). In this study, we evaluated the bone density of mandibularheads, regions of the teeth 13, 23, 36 and 46 and cervical vertebrae C1, C2 and C3, through Hounsfield scale CTscans, and correlated their values for diagnosis for possible evaluation of osteoporosis. We evaluated multi-sliceCTs of patients who underwent both examinations of the maxilla and mandible. We use software to analyzeand Efilm-investigated regions. The results show that the bone densities of the cervical spine (C1 and C3) werepositively correlated with the mandibular heads (r 0.2246, Pearson correlation coefficient), posterior regionof the mandible (r 0.2348,) and correlation with the anterior region of the maxilla (r 0.40). Therefore we canconclude that there is a positive correlation between the cervical vertebrae and buccal sites, but this correlationis weak. Being that we found a moderate correlation of the cervical vertebrae with the anterior region of themaxilla was finded.Keywords: Osteoporosis, Computed tomography (CT), Hounsfield unit (HU), Bone mineral density (BMD).Statement of Clinical RelevanceIntroductionWhen a computed tomography (CT) scan is available,for example to implant proccedings, dentists can use itas a screening tool for osteoporosis, opportunistically,which is a major public health problem amongmenopausal and postmenopausal women, withoutthe need for expensive or complicated software orspecial training.In Brazil a life expectancy at birth it’s almost 76years old. With the increase of the average yearslived by Brazilians, we can predict that in the future,gains in this indicator will not come as easily. Moreintervention will be necessary in the causes of deaththat affect the elderly, for example the osteoporosis,as well as more investments in prevention andOpen Journal of Surgery V2 . I2 . 201912
Correlation between the Bone Densities Jaws and Cervical Spine through the HU Scale Measured inMultislice Computed Tomography: Opportunistic Screening for Osteoporosistreatment, becoming a major public health problem.With an aging population, osteoporosis is increasinglybecoming a public health concern14 Osteoporosis istypically characterized by an age-related reduction inbone strength that predisposes affected individuals tolow-energy fractures. The osteoporosis is a skeletaldisease characterized by low bone mass, deteriorationof the bone structure, and an increased risk of fracture.In the spine, the incidence of osteoporotic vertebralfractures exceeds 1.4 million events annually.1Osteoporosis is a common disease with enormousimplications for affected individuals and society asa whole. Measurements obtained from computedtomography (CT) examinations obtained for otherreasons, may yield information regrading decreasedbone mineral density, without added expense to thepatient.20,21Early diagnosis is essential. However, the silentnature of osteoporosis delays diagnosis.2 Healthcareprofessionals should collaborate to create anopportunity for early detection, timely diagnosis, andappropriate treatment. In dentistry, early detectionis important because patients with osteoporosis maysuffer from higher failure rates of dental implants.Healthcare professionals should collaborate to createan opportunity for early detection, timely diagnosis,and appropriate treatment.In dentistry, early detection is important becausepatients with osteoporosis may suffer from higherfailure rates of dental implants.3 Dentists are commonlyconsulted by a large segment of the population. Dentalradiographs are used for diagnosis of conditionsaffecting teeth and jaws. These radiographs may offeran opportunity to detect osteoporosis and have beensuggested as a screening tool for the disease.4Dual X-ray absorptiometry (DXA) is currently thestandard for assessing osteopenia and osteoporosisor bone mineral density (BMD) and has been tightlycorrelated with fracture risk and treatment efficacy.5The use of Hounsfield unit (HU) from CT scanningto assess BMD of the vertebrae has recently beendescribed, and several subsequent studies exploringits utility in assessing fracture risk and prognosticsuccess.6 As described by Pickhardt et al., when CTscans are obtained for other clinical indications, theymay also be used for “opportunistic screening forosteoporosis.”7Anderson & Schreiber8, and Tay et al913concluded that the values shown in CT scans for lowbone mass diagnoses have a high correlation withthe values found in the DXA, and these two systemscan be used together, offering additional informationfor the early diagnosis of osteoporosis. Barngkgeiet al investigated the use of cone beam computedtomography (CBCT) for predicting osteoporosis basedon the cervical vertebrae CBCT-derived radiographicdensity (RD) using the CBCT-viewer program. Thisauthors finded a strongest correlation betweenthe C1 and C2 vertebrae RD values and the lumbarT-scores (r 0.747) and moderate correlations werefound between all cervical vertebrae radiographicdensity values and the femoral neck T-scores (r 0.5-0.6). So, this authors suggests that cervicalvertebrae CBCT-derived radiographic density valuescan predict osteoporosis status in menopausal andpostmenopausal women with use of the associatedCBCT-viewer program.6This can also be seen in the maxillomandibular region,most obviously in the mandible, with decreasedcortical thinning and inferior mandibular body, forexample. Rehabilitation through dental implants hasbeen a good alternative for the population worldwide,and this technique is evident in dentistryand is at itspeak in Brazil. The bone quality and bone quantityare factors considered fundamental in the diagnosticevaluation of this rehabilitation procedure toconsolidation of the bone-implant interface and thatcan influence surgical technique10,11. The classificationof bone quality proposed by Lekholm and Zarb12,which is mainly based on the subjective feeling of thesurgeon during drilling. So, numerous studies reportimplant treatment outcome by using other approachesto assess bone tissue before and during implanttreatment. To evaluate the bone mineral density of thepatient through DXA or HUare methods used beforeand after procedures to enable correct postoperativeresults13,14The use of Hounsfield units (HU) from CT scanningto assess regional BMD of the column has recentlybeen studied and the correlations between HU andbone mineral density have been established16, mainlybecause they are directly related to tissue attenuationcoefficients. The information provided by a simpleHU measurement can alert the treating physician todecreased bone quality, which can be useful in bothmedically and surgically managing these patientsOpen Journal of Surgery V2 . I2 . 2019
Correlation between the Bone Densities Jaws and Cervical Spine through the HU Scale Measured inMultislice Computed Tomography: Opportunistic Screening for Osteoporosiswith a view to implant procedures. As describedby Pickhardt et al., when CT scans are obtained forother clinical indications, they may also be used for“opportunistic screening for osteoporosis.” The CT iscurrently the only diagnostically justifiable imagingtechnique that allows at least rough conclusion aboutthe structure and density of the jaws bone, for assessingthe relative distribution of compact and cancellousbone. Modern radiology imaging software programsallow the calculation of the region of interest (ROI)on CT scans without any additional cost or poraryimplantology and it occurs in a primary and secondarylevel17. The primary implant stability can be definedas the “biometric stability immediately after implantinsertion”18, a mechanical phenomenon that is relatedto the local bone quality and quantity, to the implantgeometry (i.e., length, diameter, and type), and tothe placement technique used. The primary implantstability has always represented one of the essentialprerequisites for performing and maintainingosseointegration19, for it prevents micromovementand the formation of fibrous scar tissue at the time ofimplant loading.Osteoporosis being a systemic skeletal disease willalso affect bone density and bone structure in thejaws. Articles describing the use of dental radiographsfor diagnosing osteoporosis are given in severalreviews20,21,22. Reduced bone mass of the jaws ofosteoporotic subjects has been reported23,24,25,26,.Mandibular cortical width and shape have beenstudied in relation to osteoporosis27,28,29,30. Alveolarridge height has been studied as well31. With respectto the structure of the trabecular pattern on dentalradiographs some studies have explored the useof fractal dimension as a predictive parameter forosteoporosis27,32. Extensive morphologic analysisof the trabecular pattern on dental radiographs inrelation to osteoporosis is also described33,34.Thecorrelation between bone densitometry and UH withtomographic images may be a method of diagnosingpatients with mineral bone disease and assessing riskfactors for fracture.35According to Naitoh, there is astrong correlation between the BMD of the cervicalvertebrae and the lumbar vertebrae, also betweenthe BMD of the cervical vertebra and mandible.36Yet,abdominal CT images obtained for another reasonsOpen Journal of Surgery V2 . I2 . 2019could identify patients with osteoporosis BMDwithout additional radiation exposure or costs.37So, opportunistically we will evaluate aspects inherentto osteoporosis, correlating bone densities of sitesin the maxilla and mandible, and in the cervicalvertebrae, through computed tomography withmultislice CT(Hounsfiled scale).Materials and MethodsWe evaluated 79 multi-slice CTof patients whounderwent both examinations of the maxilla andmandible on radiology department.The images wereselected according to sex and age of patients, 35 malesand 44 females, all with over 40 years of age. Therewas no selection for the type of dentition (dentate oredentulous).Patients with diabetes, thyroid disorders, and bonediseases other than osteopenia or osteoporosis wereexcluded. None of the included women consumedexcess alcohol; only 2 (2.53%) were smokers, during,on average 20 years. None of participants had suffereda previous fracture in either the lumbar vertebrae orthe femoral neck. During the image acquisition ofthe maxilla and mandible, the regions of the cervicalvertebrae C1, C2, C3, were also scanned. To carryout this study, the research project was submitted tothe Research Ethics Committee of FOUSP (School ofDentistry of São Paulo), and approved.These studies were performed in helical multi sliceCT scanner Somatom Volume Zoom Siemens-brandwindow to 16 channels in bone tissue sections with1.0 mm and time image reconstruction 16 images/ second, the unit operates at 50KW. The imageswere acquired in DICOM format. In software e-film(eFilm,version 1.5.3, Merge Healthcare, Milwaukee,WI) and standardized for each region to be analyzedsize 0.1 sq.cm area in the center of each section andconsider the values of mean and standard deviation.All values were given in Hounsfield units, HU. Thevalues were based on the table of values for bonetissue Hounsfield units for the classification of normaldensity, high density or low density, which may still beclassified as osteopenia or osteoporosis.Analysis of the CBCT ScansIn general for the tomographic technique theangulations of selected slices were adjusted manuallyto reduce the differences in head position amongpatient sample.14
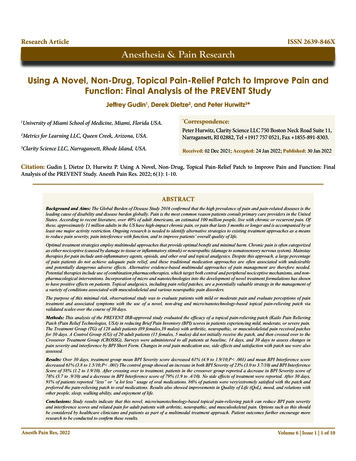
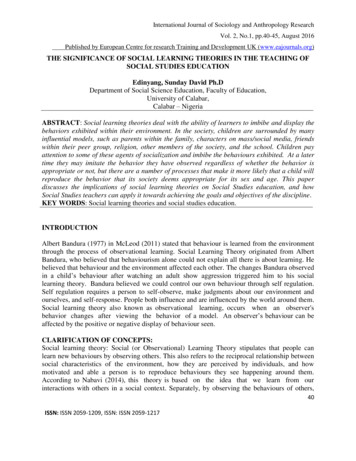
Correlation between the Bone Densities Jaws and Cervical Spine through the HU Scale Measured inMultislice Computed Tomography: Opportunistic Screening for OsteoporosisOne examiner, a PhD candidate in Oral Radiology with8 years’ experience, carried out the aforementionedanalysis of CT scans. This analysis was repeatedfor a randomly selected subsample of 8 CT images(about 10% of the overall study sample) to establishintraexaminer agreement. The following areas of eachpatient were measured: Cervical vertebrae: C1, C2,C3, in the mandible: mandibular heads and ascendingbranches D and E, regions of the teeth 46,36 and inthe maxilla: regions of the teeth 13,23. The softwaregenerates images of axial, sagittal and coronalsections. The window showing the axial section showstwo orientation lines showing the location of the axillaand coronal section. For each anatomical structureanalyzed, a cut type was used, depending on whatbest showed the area of interest. In the axial sections,densities were not measured, only the anatomicalstructure and the reference cut were located. Forexample, for the regions of ascending branches ofthe mandible were made in the coronal sections, inthe regions of the vertebrae, the sagittal cut was used(figures 1-2).Figure 1. E-film software window. In the axial cut there are 2 guidelines that show the sagittal and coronal sections.In the sagittal section are the regions of the cervical vertebrae C1, C2, C3 and the region of the tooth 13 and in thecoronal the ascending branches, where the measurements were made (above right).The coronal section shows themeasurements on the heads of the mandible (bottom left).Figure 2. E-film software window. In axial cut there are 2 guidelines that show the sagittal and coronal sections.The coronal section shows the measurements on The coronal sectionshows the measurements in the regions of theteeth 36 and 46.15Open Journal of Surgery V2 . I2 . 2019
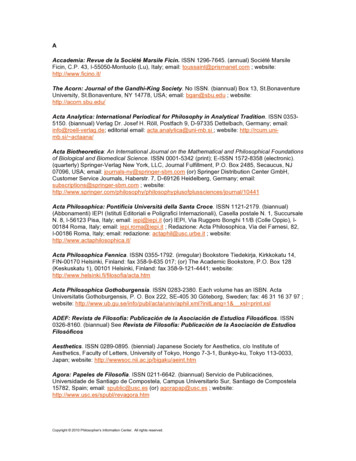
Correlation between the Bone Densities Jaws and Cervical Spine through the HU Scale Measured inMultislice Computed Tomography: Opportunistic Screening for OsteoporosisReliability of HU MeasurementsResultsWhen the regions of interest had been selected onthe CT images the selection procedure was repeatedthe same day until each region of interest had beenselected 5 times. No efforts were spent to rememberthe exact position of the regions. Similarly, when 5regions of interest were selected for each site on CTimages had been selected, the procedure was repeatedthree times on the same day. The measurements havebeen normalized to account for the variation of thesize of the regions of interest. All samples were storedon hard disk and subjected to a sequence of automaticmeasurement procedures. The measurements weregrouped into simple, geometric, topological anddirectional measurements.Most of the individuals studied are in the age rangeof 55 to 60 years, and it is possible to verify that themean age was 58 years (40-84 y.o). The women wereaged between 55 and 60 years, and the mean agepresented was 58 years. The men examined were inthe age range of 55 to 60 years, and the mean age was57.8. The bone density data (HU) presented normalcharacteristics for the spine, heads and mandibularbody. For the mandibular branch, and maxilla, thebone density data (HU) showed non-normalitycharacteristics.Statistical AnalysesThe data are presented as mean and standarddeviation. All analyzes were performed in the MedCalcprogram (Ostend, Belgium). Normality was evaluatedfor each outcome of the study after wich descriptiveanalysis were performed as appropriated includingestimators such as as means, standard deviations,medians and quartiles (first quartile -Q1 and thirdquartile -Q3). Correlations were analyzed usig thePearson coefficient values 0.05 were considered asstatiscally significant.The strength of correlation was considered weak,medium, and Strong when correlation coefficientvalues were (0.2 r 0.4), (0.4 r 0.7) and (r 0.7),respectively. Correlation coefficient values rangingbetween (0 r 0.2) were regarded as showing nocorrelation.24The bone densities of the spine (C1 and C3) werepositively correlated with the mandibular heads (r 0.23), posterior region of the mandible (r 0.23)(teeth 36 and 46), and strongest with the anteriorregion of the maxilla (r 0.40) (teeth 13 and 23), asshown in table 1.Table 1. Correlation between the C1 e C3 vertebrae means (Hounsfeld scales) with means in different maxillofacial regions.Ascending ramusMandibular headsMédia 36 e 46Anterior regions of the maxilarR2T testP .16r: Pearson correlation coefficient; R2: coefficient of determination.The cervical vertebrae C1, C2, and C3 had an averagedensity (in units of Housnfield (HU) values of 222, 258and 393 respectively. In ascending ramus observedthat mean the individuals involved in the analysishad an average bone density of 102 HU to branchDand 91 HU for branchE.In the mandibular heads,wefind that on average bone density of the head D of allindividuals in the analysis was 292 HU and averageOpen Journal of Surgery V2 . I2 . 20192.023.800.05 0.0001bone density for head E was 303.49 HU. For maxillomandibular regions, we found that the average bonedensity of the tooth 46 was 181 HU; tooth 36 was 173HU; tooth 13 was 378 HU and the tooth 23 was 349HU. You can also notice that half of the individuals hadlower bone density to 158 HU to tooth 46; 138 HU fortooth 36, 338 HU for tooth 13 and 353 for tooth 23, asshow the table 2.16
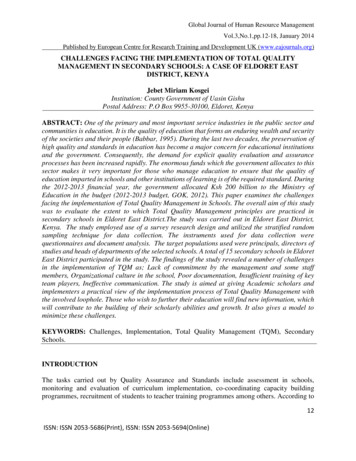
Correlation between the Bone Densities Jaws and Cervical Spine through the HU Scale Measured inMultislice Computed Tomography: Opportunistic Screening for OsteoporosisTable2. Descriptive measures (HU) of variables C1, C2 and C3, Brach D and E, Mandibular heads D and E, anddental regions teeth: 36, 46, 13, and 23.MeanSDCV (%)MinMaxC122214364-48591C225815961-16703C3 Branch D Branch E Head D Head E Tooth46 Tooth36 Tooth13 Tooth 8-99-9-13499410188097556956247559211092SD: Standard deviation; CV: Coefficient of variation.Furthermore, we could verify that the male individuals in the various sites measured.present a greater amplitude than the femaleCorrelation of the Variables amongindividuals for the analysis in the C1 vertebra, in theAll the Individuals under Analysismandibular branches (116,17 CV for females and282,93 CV for male), and in the regions of the teeth The table 3 shows the value of the correlation13 and 23 (179,73 CV for females and 237,84 CV for between the variables under analysis consideringmale). Already the means of the bone density in the all individuals in general, that is, without taking intomasculine sex, are generally larger than in the female, account the gender.Table 3. Individual Pearson correlation coefficient between variables with all individuals.C1 C2 C3 Branch D Branch E Head D Head E Tooth 46 Tooth 36 Tooth 13 Tooth23C11 0.26 0.39 0.170.230.110.190.220.190.120.37C210.37 250.120.060.220.38Branch D10.510.160.080.290.370.270.19Branch E10.10-0.070.390.430.190.24Head D10.76-0.08-0.180.090.09Head E1-0.11-0.070.260.27Tooth 4610.700.270.47Tooth 3610.390.39Tooth 1310.65Tooth 231Analyzing Table 2, we can verify how strong or not the Discussioncorrelation between the variables is for all individuals.Dental radiographs showing mandibular or maxillaryNote that the variables that have a strong correlationbone may also be used for the diagnosis of boneare the variables Head D and Head E that correlaterelated diseases. Osteoporosis is a bone-relatedwith a correlation coefficient of 0.76. There are alsodisease with increasing prevalence due to increasingthe variables Tooth 46 and Tooth 36 that correlateage of the population. The general dental practitionerwith a correlation of 0.7, and of the variables Toothmight fulfill the same role with respect to osteoporosis13 and Tooth 23 with a correlation of 0.65. All theseas with other diseases in the oral region, for example,correlations are indicated as a strong correlation.oral cancer21. By recognizing the disease in its earlyAlthough slightly lower, the correlation of the variablesphase and referring the patient to a specialist, theramus was also positive and moderate (r 0.51).dentist could opportunistly help the patient greatlyIt is important to note that there are variables that to increase the chances for a cure and a normal life,present a mean correlation as Branch E and Tooth and help society to control the financial burden that36, whose correlation coefficient between them is is associated with osteoporosis.We found only a weak0.43, and Tooth 46 and Tooth 23, which present a negative correlation of C3 densities with age, similarcorrelation coefficient of 0.47. On the other hand, the to what occurred when we verified the correlationvariables that did not correlate with each other were of mean densities of C1, C2 and C3 with age. Thethe variables C3 and BranchD, C3 and Branch E, with genus also showed a weak negative correlation whencompared to the cervical vertebrae.correlation coefficient of 0.03 and -0.02 respectively.17Open Journal of Surgery V2 . I2 . 2019
Correlation between the Bone Densities Jaws and Cervical Spine through the HU Scale Measured inMultislice Computed Tomography: Opportunistic Screening for OsteoporosisThe ability of the cervical spine to bear weight, movein 6 degrees of freedom, and provide passage forvascular and neural structures makes it the mostcomplex articular system in the body. Much likebone in other parts of the spine, the cervical spineis affected by physiological processes such as agingand degeneration. In other parts of the spine, whenfractures related to aging occur, the risk of futurefractures increases.7As the population of the developedworld ages, it is likely that fractures associated withaging will become more common. The effect of agingis readily demonstrated in the cervical spine. Aspeople get older and their bone density decreases,fractures of the C-2 vertebra, in particular, increase infrequency.8,9,10(ROC) of about 0.8. However, most researchersconcluded that these correlations do not yet enablethe clinical use of dental radiographs for screeningof osteoporosis19,20,21,23,33,34. Therefore we envisage theuse of CT, through the HU. Therefore, we envisage theuse of CT, through the Hounsfield Scale, seeking to finda positive correlation between the cervical vertebraeand buccal sites, opportunistically, since these examsbecame routine for the dental evaluation for theplacement of implants.The currently most accepted method for measuringbone mass is Dual X-ray Absorptiometry (DXA orDEXA), gold pattern at the lumbar spine, forearm,heel or total body2. Although formal dual-energy x-rayabsorptiometry (DXA) scanning is recommendedfor all women aged 65 years and all men aged 70 years, less than 33% of women and 5% of menundergo screening after fractures caused by a lowvelocity mechanism.15 Given the increase in comorbidconditions associated with increasing age, imaging isperformed frequently.Early diagnosis of osteoporosis by bone densitymeasurements allows proper management ofosteoporosis to reduce the risk of fractures and therisk of tooth loss11,12,19,20,21,22. Bone strength reflectsthe integration of bone mineral density (BMD) andbone quality, so osteoporosis must be detected andtreated early to avoid fragility and fractures1,2,13.Brazil has more than 25 million edentulous peopleand has implantodontology as a strong possibility ofrecovering buccal health, even considering the socioeconomic problems of this huge country.One of the main factors to which this phenomenon hasbeen attributed is osteoporosis.2 In terms of absolutefrequency, cervical spine fractures are more commonin the elderly than in younger adults. As osteoporosisis a slowly progressing disease with about annualbone loss between 1–5%, with the accuracy error ofDXA techniques is 3–15% and the precision error is1–3%2,15,16,17. High costs would be required to examineall patients in the DXA risk group. Therefore, thereis a need for alternative methods and of severalhealth professionals that can help on a large scaleto monitor the skeletal status and to detect earlysigns of osteoporosis so as to select individuals forfurther BMD testing and possible treatment, even ifopportunistically.The correlations between osteoporosis andradiological measurements in dental radiographsare comparable with those reported for commonlyused clinical screening instruments for osteoporosissuch as the Osteoporosis Self-assessment Tool orthe Simple Calculated Osteoporosis Risk Estimationwith area under receiver operating characteristicsOpen Journal of Surgery V2 . I2 . 2019The cervical vertebrae (C1, C2 and C3) can be measuredopportunistically in CT examinations for evaluation ofimplants, and we found a mean density of 222, 258and 393HU, respectively.The mandibular condyles we find that on average bonedensity for the right condyles (RC) of all individuals inthe analysis is 291 HU and average bone density forleft condyle (LC) is 303 HU. Maxilla and mandibularregions average bone density is 182 HU to 46 toothand 173 HU to 36 tooth, for tooth 13 is 378 HU andthe tooth 23, 349 Hu. We must remember that thesingular or complex geometry of the cervical vertebraeprovides multiple locations where load may be appliedto each vertebra, either through articulating jointsurfaces or through muscle and ligament attachments.The asymptomatic neck is capable of a wide varietyof movements. So, it is clear that the anatomicalstructures that comprise the cervical vertebrae areroutinely subjected to diverse combinations of load.Computed tomography (CT) is considered the methodof choice for study of bone structures, one of itsmain advantages is three-dimensional informationpresented in a series of thin slices of the internalstructure of the study, where the resulting informationdoes not suffer by superposition anatomicalstructures8,18,37. Tay et al., 20129, correlated the values 18
Correlation between the Bone Densities Jaws and Cervical Spine through the HU Scale Measured inMultislice Computed Tomography: Opportunistic Screening for Osteoporosisof bone density by Dual Energy X-ray Absorptiometry(DXA) with the values of the bone densities of CT andconcluded that there is a strong correlation betweenthe values assessed by two methods and they can beused together to diagnose osteoporosis. Anderson andSchreiber 20118, evaluated 25 patients, mean age of71.3 years, with DXA and CT of the lumbar spine andwas obtained correlation of the values and concludedthat there is a strong correlation between the twoosteoporosis diagnostic methods.In our study wefound some positive correlation between the cervicalvertebrae and sites in the maxilla and mandible, aswas the case of the C3 vertebrae with the tooth regionof the tooth 23 (0.38).According to the classification of Lekholm and Zarb12,the Bone type 4 ( 200HU) requires a meticuloussurgical technique. We finded this value to mandibularregions average bone density is 182 HU to 46 toothand 173 HU to 36 tooth. Probably these regions wouldbe edentulous regions of the alveolar ridge, beingalso atrophic. An important threshold based on thesestudies is an HU value of less than 120, which indicateslikely bone insufficiency and suggest the need forfurther investigation.18 Pickhardt et al7 compared CTderived HU to DXA using the ROC analysis to determinecutoff values that optimize sensitivity and specificity.The results in a series of 1867 patients was that an HUthreshold of 160 or less at L-1 was 90% sensitive fordistinguishing osteoporosis from osteopenia, while anHU value of 110 was 90% specific. We have values coseto these in region of ramus (D and E), but we knowthat this region is practically, only cortical practically,very different from the region of the alveolar bordersor of the vertebrae. So much so that the correlationof the cervical vertebrae was poor in highlight to theregion of the Branch. Despite the positive correlationwe found from the cervical vertebrae to this posteriorregion of the mandible, it is low (r 0,23).While futurestudies are needed to answer this question in thecolunn, local HU values have been used in the field ofdentistry for implant planning.The DXA is used to quantify and qualify the bonedensity in the hip bone, femur, forearm and alsowhen the jaw for evaluation of localized osteoporosis,showing that the disease is systemic bone by being invarious places on the bones of the body6,7,8,9 and CTproved as efficient as the DXA for diagnosis of bonedensities in different bones in the body. Lee et al, 20133519valuated the lumbar spine 128 women who had CTand D
and Efilm-investigated regions. The results show that the bone densities of the cervical spine (C1 and C3) were positively correlated with the mandibular heads (r 0.2246, Pearson correlation coefficient), posterior region of the mandible (r 0.2348,) and correlation with the anterior region of the maxilla (r 0.40). Therefore we can