Transcription
Michael MooreAndreas SchrimpfVladyslav orgvladyslav.sushko@bis.orgDownsized FX markets: causes and implications1For the first time in 15 years, FX trading volumes contracted between two consecutive BISTriennial Surveys. The decline in trading by leveraged institutions and “fast money” traders, anda reduction in risk appetite, have contributed to a significant drop in spot market activity. Moreactive trading of FX derivatives, largely for hedging purposes, has provided a partial offset. ManyFX dealer banks have become less willing to warehouse risk and have been re-evaluating theirprime brokerage business. At the same time, new technologically driven non-bank players havegained firmer footing as market-makers and liquidity providers. Against this backdrop, FX tradingis becoming increasingly relationship-driven, albeit in an electronic form. Such changes in thecomposition of market participants and their trading patterns may have significant implicationsfor market functioning and FX market liquidity resilience going forward.JEL classification: C42, C82, F31, G12, G15.This article explores the evolution of trading volumes and structural shifts in theglobal foreign exchange (FX) market, drawing on the 2016 Triennial Central BankSurvey of Foreign Exchange and Derivatives Market Activity (in short, “the Triennial”).Central banks and other authorities in 52 jurisdictions participated in the 2016 survey,collecting data from close to 1,300 banks and other dealers.For the first time since 2001, global FX trading declined between two consecutivesurveys. Global FX turnover fell to 5.1 trillion per day in April 2016, from 5.4 trillionin April 2013 (Graph 1, left-hand panel). In particular, spot trading fell to 1.7 trillionper day in April 2016, from 2.0 trillion in 2013. In contrast, trading in most FXderivatives, particularly FX swaps, continued to grow. In addition, a number ofemerging market economy (EME) currencies gained market share, most notably therenminbi.2Part of the decline in global FX activity can be ascribed to less need for currencytrading, as global trade and capital flows have not returned to their pre-Great1The authors thank Claudio Borio, Alain Chaboud, Benjamin Cohen, Dietrich Domanski, RobertMcCauley, Hyun Song Shin, Christian Upper, Philip Wooldridge and Laurence Wright for usefulcomments and suggestions. We are grateful to Angelo Ranaldo for sharing data on FX marketliquidity. We also greatly appreciate the feedback and insightful discussions with numerous marketparticipants at major FX dealing banks, buy-side institutions, electronic market-makers, retail brokersand electronic trading platforms. We are also grateful to Denis Pêtre and Tsvetana Spasova forcompiling the underlying data and Amy Wood and Ingomar Krohn for excellent research assistance.The views expressed are those of the authors and do not necessarily reflect those of the BIS.2See BIS (2016a) for the preliminary statistical release of the 2016 Triennial results, including details ofFX turnover across currency pairs, instruments, counterparties and trading locations.BIS Quarterly Review, December 201635
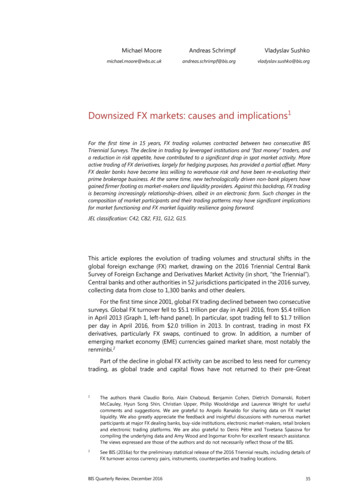
Global foreign exchange turnoverGraph 1Turnover by instrument1FX turnover relative to gross daily capital flows2USD trn9598TotalFX swaps010407SpotOutright forwards101316Options andother productsRatioUSD trn540543543303225212010150959801040710Total FX turnover as share of (lhs):3Current account flows3Current, capital and financial account flows1316Total FXturnover1(rhs)Adjusted for local and cross-border inter-dealer double-counting, ie “net-net” basis; daily averages in April. 2 Gross daily capital flows areestimated by dividing the annual sum of inflows and outflows by 365. 3 Current, capital and financial account flows for 2016 are estimatedby extrapolating the average annual growth for 2014 and 2015.1Sources: IMF, International Financial Statistics; BIS Triennial Central Bank Survey; authors’ calculations.Financial Crisis (GFC) growth rates (Graph 1, right-hand panel). However, conventionalmacroeconomic drivers alone cannot explain the evolution of FX volumes or theircomposition across counterparties or instruments. This is because fundamentaltrading needs only account for a fraction of transactions. Instead, the bulk of turnoverreflects inventory risk management by reporting dealers, their clients’ tradingstrategies and the technology used to execute trades and manage risks.This special feature examines these structural factors and changes in tradingpatterns underpinning global FX activity. Some major takeaways are as follows. Thecomposition of participants changed in favour of more risk-averse players. Thegreater propensity to transact FX for hedging rather than risk-taking purposes bythese investors has led to a decoupling of turnover in most FX derivatives from thatin spot and options trading. Patterns of liquidity provision and risk-sharing in FXmarkets have also evolved. The number of dealer banks willing to warehouse riskshas declined, while non-bank market-makers have gained a stronger footing asliquidity providers, even trading directly with end users. These shifts have beenaccompanied by complementary changes in trade execution methods. Marketstructure may be slowly shifting towards a more relationship-based form of trading,albeit in a variety of electronic forms.The rest of the article is organised as follows. The first section focuses on thechanging composition of FX market participants and its implications for theconfiguration of the main FX instruments. The second section discusses the changingpatterns of liquidity provision, the growth of electronic non-bank market-makers andnew forms of risk-sharing in wholesale FX markets. The third section looks at theassociated changes in trade execution methods, which appear to be gravitatingtowards relationship-based electronic trading models. The conclusion highlightssome implications for policy and financial stability.36BIS Quarterly Review, December 2016
The changing composition of FX marketsThe past three years have seen large shifts in FX market activity, in terms of bothparticipants and instruments (Table 1). Hedge funds, non-financial end users andsmaller banks have reduced their market presence. In contrast, institutional investorshave increased their participation, notably for hedging purposes. And certainalgorithmic strategies primarily based on speed have reached a saturation point.These shifts have contributed to the decoupling of FX spot trading from activity inmost FX derivatives.Trends in FX market participationParticipation in FX markets has shifted towards less leveraged and more risk-averseparticipants. A first indication of such a shift is that trading involving institutionalinvestors, such as insurance companies and pension funds, grew by a third between2013 and 2016 (Table 1). These types of long-term investors tend to exhibit lowertolerance for foreign currency risk in their portfolios and use FX markets to hedgesuch risks. Indeed, their FX swap trading volume rose by approximately 80% to morethan a quarter of a trillion US dollars per day in 2016.Global FX market turnover in April 2016, by counterparty and instrumentTable 1Net-net basis,1 daily averages in April 2016Turnover in 20162013–16 changeUSD bn2013–16 percentagechange5,070–290–5Reporting dealers2,120502Other financial institutions2,560–250–9Non-reporting banks1,110–160–13Institutional investors80019032Hedge funds and principal trading 02032,3801406Currency options250–80–24Currency swaps803052Global FX marketBy counterpartyOf which:Non-financial customersBy instrumentSpotOutright forwardsFX swaps1Adjusted for local and cross-border double-counting. Turnover and absolute change rounded.Sources: BIS Triennial Central Bank Survey; authors’ calculations.BIS Quarterly Review, December 201637
Box ADrivers of aggregate FX turnoverThe macroeconomic backdrop has pointed to a moderation of the underlying demand for (spot) FX trading. Globaltrade (as a share of GDP) and global capital flows have fallen since 2013. Hence, global FX turnover has actually heldup well relative to gross current, capital and financial account trading needs (Graph 1, right-hand panel). Trading withnon-financial customers has dropped by about 20% (Table 1), another sign pointing to a decline in FX transactionsassociated with global trade.The overall fall in turnover conceals important nuances about the evolution of FX turnover between the 2013 and2016 Triennials. To see this, we follow Bech (2012) and Bech and Sobrun (2013) and compute measures ofbenchmarked FX volumes using a combination of sources, including the more frequent FX surveys conducted byregional foreign exchange committees, information from major electronic trading platforms and CLS settlementvolumes. The higher-frequency perspective reveals an even more pronounced drop in trading activity. FX activityactually peaked in September 2014, at 6.5 trillion per day (Graph A, left-hand panel). Volumes fell off steeplythereafter, to less than 5 trillion per day in November 2015, before recovering somewhat by April 2016.Evolution of benchmarked foreign exchange volumes at higher frequency1Net-net basis,2 in trillions of US dollar equivalentsGraph ATotal volumes1011Spot volumes³121314Final benchmarked seriesTriennial SurveyIntermediate benchmarked 0.041011USD/JPY (lhs)1213141516AUD/USD (rhs)The dashed vertical lines indicate the dates when Triennial Surveys were conducted; the solid vertical lines indicate key policy announcementsin April 2013 (Bank of Japan quantitative easing), June 2013 (May/June US taper tantrum and news about WM/Reuters fix), October 2014(Bank of Japan quantitative easing expansion) and January 2015 (removal of Swiss franc peg).Benchmarked series are calculated using the technique described in Bech (2012) and Bech and Sobrun (2013). The CLS data are seasonallyadjusted before the benchmarking technique is applied; semiannual data refer to April and October observations. 2 Adjusted for local andcross-border inter-dealer double-counting. 3 Based on breakdowns by currency pair from the foreign exchange committees in Australia,London, New York, Singapore and Tokyo.1Sources: Foreign exchange committee surveys; CLS; CME; EBS; Hotspot FX; Thomson Reuters; BIS Triennial Central Bank Survey; BIScalculations.Several factors, some due to central bank policy measures, seem to have led to this pattern. The previous Triennialtook place amid heightened FX activity against the background of policy easing by the Bank of Japan in April 2013(Rime and Schrimpf (2013)). FX trading then continued to rise until June 2013. This was the month when attentionturned to the London 4 pm WM/Reuters fixing scandal. The same month coincided with the “taper tantrum”, whenexpectations mounted that the US Federal Reserve would begin tapering its asset purchases. Trading volumesrebounded again in the second half of 2014, against the background of further easing by the ECB, including theintroduction of negative policy rates, and an expansion of the Quantitative and Qualitative Monetary Easing (QQE)programme by the Bank of Japan that October. Indeed, major policy innovations by the Bank of Japan appeared totrigger heightened trading activity in the JPY/USD currency pair and related crosses, such as AUD/USD (Graph A, righthand panel). This, in turn, contributed to spikes in total global FX market activity.38BIS Quarterly Review, December 2016
Aggregate volumes were also driven by the interaction of several macroeconomic developments with the microdrivers discussed in the text. The outsize price moves in the wake of the Swiss National Bank’s abandonment of theSwiss franc’s peg against the euro on 15 January 2015 sent shockwaves through the prime brokerage industry, causingprime brokers to raise fees and cut clients. This has further reduced participation by hedge funds and other leveragedplayers in FX markets, as they have already been experiencing low returns. Some banks also cut their businessexposures to retail margin brokerage, which affected market access for retail aggregators. High-frequency trading(HFT) firms were also faced with tighter FX market access from the decline in prime brokerage as well as from variousmeasures to curb HFT activity which were put in place by major FX trading venues beginning in mid-2013. All thesedevelopments had a disproportionate impact on spot trading, because the above-mentioned market participants seekreturns by taking open currency positions or, in the case of HFT, focus on the most liquid instruments.By contrast, trading in FX swaps rose because of the increase in currency hedging activity by long-terminstitutional investors, as they rebalanced their international portfolios on the back of central bank quantitative easingprogrammes. Similarly, FX liquidity management among dealer banks increased, as money market rates and lendingspreads in major currencies diverged, which also contributed to the rise in FX swap turnover.Second, and particularly striking, FX turnover via prime brokers3 fell sharplycompared to 2013 – by 22% overall, and by close to 30% in spot markets (Graph 2,left-hand panel).The drop in prime brokerage reflects a combination of factors. On the supplyside, banks have been reassessing the profitability of their prime brokerage businessPrime brokerage volumes, the Swiss franc shock and trading by hedge funds andPTFs1Prime-brokered turnover byinstrument22013SpotFX swapsOutright forwardsShare of hedge funds and PTFs1, 2, 4CHF/EUR trading volumes3USD trnCHF/EURGraph 2USD trn equivalentsPer 00.045.00.20.80.022.50.00.60.002016Currency swapsOptions10 11 12 13 14 15 16Lhs:Trading volumes (rhs):CHF/EUR spotSpotFX swapsOutright forwards0.0SpotOther instruments20132016The shaded areas in the centre panel indicate subperiods in May/June 2010 (SNB abandons earlier interventions) and in 2012 and 2013(repeated interventions to defend the 1.20 exchange rate floor); the vertical lines indicate September 2011 and January 2015 (SNB decisionson the CHF/EUR rate).PTFs principal trading firms. 2 Adjusted for local and cross-border inter-dealer double-counting, ie “net-net” basis; daily averages inApril. 3 Trading activity as reported by CLS, not seasonally adjusted. 4 As a percentage of turnover in particular FX instruments inApril 2013 and April 2016.1Sources: CLS; Datastream; BIS Triennial Central Bank Survey; authors’ calculations.3For definitions of technical terms, see the glossary in BIS (2016b).BIS Quarterly Review, December 201639
in the wake of post-GFC regulatory reforms, low overall profitability and deleveragingpressures. A number of major prime brokers raised capital requirements, introducedtighter admission procedures and raised fees. In addition, the prime brokerageindustry was jolted by the outsize price moves following the Swiss National Bank’sdecoupling of the Swiss franc from the euro on 15 January 2015 (Graph 2, centrepanel), with FX dealer banks taking further steps to mitigate risks associated with FXprime brokerage. Interviews confirm that prime brokers have focused on retaininglarge-volume clients, such as large principal trading firms (PTFs) engaged in marketmaking (see below), while shedding retail aggregators, smaller hedge funds and somehigh-frequency trading (HFT) firms.On the demand side, reduced trading by hedge funds and PTFs has been a keydriver behind the drop in prime-brokered activity (Graph 2, right-hand panel). Hedgefund returns have been under pressure post-crisis, with assets under managementfalling further after the Swiss franc shock (Graph 3, left-hand panel).4 The fall in PTFactivity, in turn, largely reflects the saturation of HFT strategies focused on aggressivefast trade execution and short-term arbitrage.5 The introduction of “speed bumps”in the form of latency floors by major inter-dealer platforms made such strategiesless attractive (see below).Hedge fund and PTF1 trading activity, and retail FX tradingAssets under management of selectmacro hedge funds2Hedge fund and PTF1 FX trading bylocation3USD bn1301%4%9094%92%503002 04 06 08 10 12 14 16Estimated size of global retail spot FXtradingUSD trnUSD bn0.53750.43000.32250.21500.1754%11070Graph 34%00.020132016UK and USHong Kong SAR, Japan and SingaporeRest10 11 12 13 14Platform survey:Retail platformsRetail trading oninstitutional es1PTF principal trading firm. 2 US dollar global macro hedge funds excluding those with a commodity and discretionary thematicfocus. 3 Total FX trading adjusted for local and cross-border inter-dealer double-counting, ie “net-net” basis; share of FX trading adjustedfor local inter-dealer double-counting, ie “net-gross” basis. 4 Adjusted for local and cross-border inter-dealer double-counting, ie “net-net”basis; daily averages in April.Sources: Finance Magnates; Hedge Fund Research; Markets Committee survey of trading platforms, 2016; BIS Triennial Central Bank Survey;authors’ calculations.4Global macro hedge funds have been faced with low FX volatility and an appreciation of typical carrytrade funding currencies (that is, those with low interest rates), such as the Swiss franc and Japaneseyen. At the same time, some traditional carry investments (high interest rate currencies such as theAustralian dollar, as well as several EME currencies, such as the Mexican peso), have seen significantdepreciation pressures.5See also Markets Committee (2011) for an analysis of HFT trading in FX markets and MarketsCommittee (2016) for a discussion of algorithmic trading in fixed income markets.40BIS Quarterly Review, December 2016
While declining in the aggregate, hedge fund and PTF activity has also beenincreasingly shifting towards Asian financial centres, albeit from a very small base(Graph 3, centre panel). Specifically, FX trading by hedge funds and PTFs in Londonand New York dropped by 50% and 10%, respectively, but rose by 88% in HongKong SAR, more than doubled in Singapore and tripled in Tokyo. Combined, Asianfinancial centres now account for 4% of trading by hedge funds and PTFs, comparedwith 1% in 2013. In part, this shift reflects the increased liquidity of Asian currencies,inducing PTFs to co-locate closer to the corresponding trading venues.The retail brokerage segment was particularly affected by bouts of extremevolatility because retail traders are typically offered very high leverage against smallinitial margin requirements. Retail margin brokers were thus particularly exposed tolosses stemming from the volatility that followed the removal of the Swiss franc’s pegto the euro. As a result, some major FX dealing banks scaled down their businessexposure to retail brokerage platforms. This, in turn, led retail aggregators toincreasingly seek access to FX trading venues via a “prime-of-prime” relationship,whereby they are prime-brokered by a non-dealer bank, which is itself primebrokered by an FX dealing bank. This migration of retail FX trading to venues at arm’slength from FX dealer banks has contributed to the decline in spot trading classifiedas retail-driven in the Triennial (Graph 3, right-hand panel).Implications for FX market activity across instrumentsThe decline in leverage and risk aversion also affected activity across FX instruments.On the one hand, the decline in FX trading by leveraged players and “fast money”traders, such as hedge funds and certain types of PTFs, contributed to adisproportionate fall in turnover in spot and FX options (Table 1). Their tradingstrategies often generate returns by taking directional exposures to currencymovements using spot and options contracts. Similarly, HFT strategies tend to focuson spot trades because of the standardisation and liquidity of the instruments.On the other hand, trading in derivatives used for FX funding by banks and forhedging by institutional investors and corporates actually increased. Most notably,turnover in FX swaps, the most actively traded instrument, rose by a further 6%(Table 1). Trading in (longer-dated) currency swaps also saw a significant pickup,albeit from a relatively low base (see also Box B for a description of similar shifts inrenminbi trading).FX swap trading rose more in jurisdictions where measures of the underlying FXhedging needs of banks and corporates were the largest (Graph 4, centre panel).Major currency areas that eased monetary policy further in 2015 and 2016, such asthe euro area and Japan, experienced a particularly steep rise in FX swap turnoveragainst the US dollar (Graph 4, left-hand panel). This is consistent with rising demandfor FX swaps as investors seek returns in higher-yielding currencies, and borrowersseek funding in lower-yielding currencies. Similarly, the turnover in FX swaps showsclose association with currency risk hedging costs, as proxied by the cross-currencybasis (Graph 4, right-hand panel), pointing again to the demand push for FX swapsfrom currency hedgers.66See Borio et al (2016) for an analysis of FX hedging demand and the cross-currency basis anomaly.BIS Quarterly Review, December 201641
FX swap turnover and demand push from currency hedgingTotal volumes by currency pair1Hedging demand andFX swap trading2, 3Graph 4Hedging costs and FX swap trading2USD trn JPYCHF16GBP EURCADCHFNOKNZDDKKAUD0.250.00SEK–0.2502040Change in FX swap turnover, 2013–16 (%)SEKNZDAUD0GBP–20CADNOK–40CHF EUR–60DKKJPY–80Two-year cross-currency basis,April 2016 average (bp)0.75Bank and corporate net forwardUSD position, Q1 2016 (bn)JPY0.802040Change in FX swap turnover, 2013–16 (%)GBPThe dashed vertical lines in the left-hand panel indicate the dates when Triennial Surveys were conducted.Benchmarked series are calculated using the technique described in Bech (2012) and Bech and Sobrun (2013). The CLS data are seasonallyadjusted before the benchmarking technique is applied; semiannual data refer to April and October observations. 2 Adjusted for local andcross-border inter-dealer double-counting, ie “net-net” basis. 3 Bank hedging of US dollar assets via FX swaps estimated as the differencebetween gross consolidated US dollar assets and liabilities of BIS reporting banks in each currency jurisdiction; corporate hedging demandproxied by outstanding debt securities liabilities denominated in the respective currencies issued by non-financial corporates headquarteredin the US (reverse yankee bonds).1Sources: Borio et al (2016); foreign exchange committee surveys; Bloomberg; CLS; EBS; Thomson Reuters; BIS debt securities statistics,international banking statistics and Triennial Central Bank Survey; BIS calculations.New mechanisms of liquidity provisionDealer banks have been adjusting their business models to their reduced capacity towarehouse risk and tighter limits on proprietary trading. In the process, a handful oftop-tier dealer banks have consolidated their position as liquidity providers,attracting further customer flows, including from other banks. At the same time, thesetop FX dealer banks have also faced increasing competition from non-bank electronicmarket-makers. The composition of the latter has shifted away from those pursuingmore aggressive latency-driven trading strategies to more passive strategies basedon market-making. As a result, these firms have expanded their business to becometop liquidity providers in FX markets.Bifurcation of banks’ role in FX market-makingAmong dealer banks, there has been further bifurcation between the few large banksthat remain willing to take risks onto their balance sheets as principals and otherinstitutions that have moved to an agency model. The top-tier dealer banks thatintermediate the lion’s share of customer flows have maintained their position aslarge flow internalisers (Box C), price-makers and liquidity providers. By contrast,many other banks are increasingly acting simply as conduits, effectively sourcingliquidity from the largest dealers and passing it on to their clients. Thus, thewarehousing of inventory risk falls onto the top-tier FX dealers.42BIS Quarterly Review, December 2016
Box BThe rise and financialisation of the renminbiRenminbi turnover has approximately doubled every three years over the past decade and a half (Graph B, left-handpanel). Total daily turnover has reached over 200 million or 4% of global FX turnover. This makes the Chinese currencythe eighth most traded currency in the world, overtaking the Mexican peso and only slightly behind the Swiss francand Canadian dollar.Along with the rise in the overall trading of the renminbi, its use as a financial instrument and to back financialrather than trade transactions has also increased. In the past, most of the limited turnover was in spot transactions.The Triennial reveals that spot now amounts to less than half of total turnover, while the share of FX swap trading hasreached 40%. Associated with this, trading among financial institutions is now much more prevalent, while the shareof renminbi trading with non-financial customers has declined steeply, from 19% in 2013 to 8% in 2016 (Graph B,centre and right-hand panels). However, the prominent role of the CNY/USD pair has not changed: 95% of renminbitrading is against the US dollar, and there is no serious liquidity in any other CNY pairs.The rise of the renminbi comes with greater financialisationNet-net basis,1 daily averages in AprilTurnover by instrumentGraph B2013 turnover by counterpartyUSD bn2016 turnover by counterpartyPer centPer X swapsOutright forwards120168%0.5%0.3% 4%OptionsCurrency swapsCNY/USDAdjusted for local and cross-border inter-dealer double-counting.Reporting dealersNon-financial customers2Other financial institutions:Non-reporting banksInstitutional investors2Hedge funds and PTFsOfficial sector financialinstitutionsPTFs principal trading firms.Sources: BIS Triennial Central Bank Survey; authors’ calculations.Renminbi trading volumes are growing rapidly, and the currency is becoming more financialised. The share ofderivative compared with spot trading, and of financial compared with non-financial counterparties, are approachingthat of well established and liquid currencies. Also, according to McCauley and Shu (2016), in line with RMBinternationalisation, trading in offshore deliverable RMB forwards increased significantly, while that in non-deliverableforwards declined since the last survey. However, there are still impediments to the renminbi becoming a trulyinternational currency. In addition to the low liquidity outside the CNY/USD pair, these include capital controls, thewedge between the offshore and onshore exchange rates, and ineligibility for CLS settlement. At the same time, therapid growth of renminbi trading and the development of the associated financial markets (Ehlers et al (2016)) suggestthat these hurdles may be cleared faster than might be expected.Recent survey data underline this increasing bifurcation. On the one hand, thenumber of banks accounting for 75% of FX turnover has declined further since thelast Triennial (Graph 5, left-hand panel). On the other hand, the share of inter-dealertrading has picked up for the first time since the 1995 survey (Table 1 and Graph 5,BIS Quarterly Review, December 201643
Bank dealers under pressureIn per centGraph 5Banks in top trading jurisdictionsaccounting for 75% of FX turnover1, 2Inter-dealer trading as share of totalFX 1316Share of trading by top dealers41520980104SpotFX swaps07101316Outright forwards98010407Top five banks101316Top 12 banksAustralia, Brazil, Denmark, France, Germany, Hong Kong SAR, Japan, Singapore, Sweden, Switzerland, the United Kingdom and the UnitedStates. 2 Spot, outright forwards and FX swaps. 3 Adjusted for local and cross-border inter-dealer double-counting, ie “net-net” basis;daily averages in April. 4 Based on Euromoney rankings.1Sources: Euromoney Foreign Exchange Survey 2016; BIS Triennial Central Bank Survey; authors’ calculations.centre panel). Taken together, these developments indicate that liquidity flowsfrom a handful of top-tier FX dealer banks to the other banks.This type of inter-dealer trading between core and periphery is very differentfrom the classic “hot potato” trading of inventory imbalances, which used to be themain driver of trading growth among dealers. The hot potato trading of FX inventoryimbalances, as described by Lyons (1997), Evans and Lyons (2002) and Killeen et al(2006), refers to dealer banks trading anonymously with each other via inter-dealerbrokers (see below). Nowadays, major FX dealers can stream prices on secondaryvenues or respond to requests for quote from other banks.Electronic non-bank market-makers emerge as liquidity providersNew technologies have enabled non-bank market participants to gain ground asmarket-makers and liquidity providers. While previously focused on HFT strategies,these electronic non-bank market-makers are becoming some of the largest liquidityproviders on primary trading venues and have been making inroads in direct etrading with customers.7 When non-banks appeared in the Euromoney magazinerankings for the first time this year, their share was already 6% of the market-makersegment. And, given that most non-bank market-makers do not disclose their tradingvolumes, their actual market share is probably higher. In contrast, the share of topdealer banks in total FX trading with clients fell sharply (Graph 5, right-hand panel).744The diverse set of non-bank electronic market-makers includes XTX Markets, Virtu Financial, CitadelSecurities, GTS and Jump Trading. These market-makers’ trading volume is captur
For the first time since 2001, global FX trading declined between two consecutive surveys. Global FX turnover fell to 5.1 trillion per day in April 2016, from 5.4 trillion in April 2013 (Graph 1, left-hand panel). In particular, spot trading fell to 1.7 trillion per day in April 2016, from 2.0 trillion in 2013. In contrast, trading in most FX