Transcription
Morbidity and Mortality Weekly ReportVital Signs: Postpartum Depressive Symptoms and Provider Discussions AboutPerinatal Depression — United States, 2018Brenda L. Bauman, MSPH1; Jean Y. Ko, PhD1; Shanna Cox, MSPH1; Denise V. D’Angelo, MPH1; Lee Warner, PhD1; Suzanne Folger, PhD1;Heather D. Tevendale, PhD1; Kelsey C. Coy, MPH1; Leslie Harrison, MPH1; Wanda D. Barfield, MD1Introduction: Perinatal depression is a complication of pregnancy that can result in adverse maternal and infant outcomes.Screening to identify pregnant and postpartum women with depressive symptoms is recommended to provide diagnosis,treatment, and follow-up care to reduce poor outcomes.Methods: CDC analyzed 2018 data from the Pregnancy Risk Assessment Monitoring System to describe postpartumdepressive symptoms (PDS) among women with a recent live birth and to assess whether health care providers askedwomen about depression during prenatal and postpartum health care visits, by site and maternal and infant characteristics.Results: Among respondents from 31 sites, the prevalence of PDS was 13.2%, ranging from 9.7% in Illinois to 23.5% inMississippi. The prevalence of PDS exceeded 20% among women who were aged 19 years, were American Indian/AlaskaNative, smoked during or after pregnancy, experienced intimate partner violence before or during pregnancy, self-reporteddepression before or during pregnancy, or whose infant had died since birth. The prevalence of women reporting that ahealth care provider asked about depression during prenatal care visits was 79.1% overall, ranging from 51.3% in PuertoRico to 90.7% in Alaska. The prevalence of women reporting that a provider asked about depression during postpartumvisits was 87.4% overall, ranging from 50.7% in Puerto Rico to 96.2% in Vermont.Conclusions and Implications for Public Health Practice: The prevalence of self-reported PDS varied by site andmaternal and infant characteristics. Whether providers asked women about perinatal depression was not consistent acrosssites. Provision of recommended screenings and appropriate referrals for diagnosis, treatment, and follow-up care canensure early and effective management of depression to reduce adverse maternal and infant outcomes.IntroductionMental health conditions are common complications inpregnancy (1) and an underlying cause for approximately 9%of pregnancy-related deaths (2). Postpartum depression isassociated with lower rates of breastfeeding initiation, poorermaternal and infant bonding, and increased likelihood ofinfants showing developmental delays (3). Left untreated,postpartum depression can adversely affect the mother’s healthand might cause sleeping, eating, and behavioral problems forthe infant; when effectively treated and managed, both motherand child benefit (4).Professional and clinical organizations have issued recommendations to address perinatal (i.e., during and after pregnancy) depression. The United States Preventive Services TaskForce (USPSTF) recommends that all adults be screened fordepression, including pregnant and postpartum women (5),and that clinicians provide or refer pregnant and postpartumwomen who are at increased risk for perinatal depressionto counseling interventions (6). The American College ofObstetricians and Gynecologists (ACOG) recommends thatobstetric care providers screen patients for depression and anxiety symptoms at least once during the perinatal period and alsoconduct a full assessment of mood and emotional well-beingduring the comprehensive postpartum visit (7). If a patient isscreened for depression and anxiety during pregnancy, additional screening should also occur during the comprehensivepostpartum visit (7). The American Academy of Pediatrics alsorecommends that routine screening for maternal postpartumdepression be integrated into well-child visits (8).USPSTF has noted that identifying women at increased riskfor perinatal depression and determining ways to improve thedelivery of interventions represent evidence gaps that warranthigh-priority efforts (9). Women with postpartum depressivesymptoms (PDS) are at increased risk for postpartum depression and require further evaluation to determine whether theymeet the criteria for having a depressive disorder (4). To informthese evidence gaps, CDC used data from the PregnancyRisk Assessment Monitoring System (PRAMS) to examinethe prevalence of self-reported PDS and whether a healthcare provider inquired about depression during prenatal andpostpartum health care visits.MethodsPRAMS collects site-specific, population-based data on selfreported maternal behaviors and experiences before, during,and shortly after pregnancy. From each of the 50 continuouslyUS Department of Health and Human Services/Centers for Disease Control and PreventionMMWR / May 15, 2020 / Vol. 69 / No. 19575
Morbidity and Mortality Weekly Reportparticipating sites, a stratified, random sample of women witha recent live birth (singleton and multiple births) is selectedmonthly from birth certificate files, and these women aresurveyed 2–6 months postpartum (average 4 months) usinga standardized protocol and questionnaire (10). Annually,PRAMS data for each site are weighted for sampling design,nonresponse, and noncoverage to produce data representativeof the site’s birth population for the year.Data from 31 PRAMS sites* that had weighted responserates 55% in 2018 were included in this analysis. Data wereobtained from the infant’s birth certificate and survey questions.† Self-reported PDS were ascertained by categorizingfive responses (“always,” “often,” “sometimes,” “rarely,” and“never”) from the following two questions adapted from thePatient Health Questionnaire-2 screening instrument (11):1) “Since your new baby was born, how often have you feltdown, depressed, or hopeless?” and 2) “Since your new babywas born, how often have you had little interest or little pleasurein doing things?” Women responding “always” or “often” toeither question were classified as experiencing PDS. Womenwho had prenatal and postpartum health care visits were askedwhether health care providers had inquired about depressionduring these visits. Health care provider inquiry about depression during prenatal care visits was ascertained by the percentage of women responding “yes” to the question “During anyof your prenatal care visits, did a doctor, nurse, or health careworker ask you if you were feeling down or depressed.” Healthcare provider inquiry about depression during postpartum visitswas assessed by the percentage of women responding “yes” tothe question, “During your postpartum checkup, did a doctor, nurse, or other health care worker ask if you were feelingdown or depressed.”The weighted prevalence and 95% confidence intervalsfor self-reported PDS and health care provider inquiry aboutdepression during prenatal and postpartum visits were calculated overall and by site. Chi-squared tests of independencewere used to examine the distribution of both PDS and healthcare provider inquiry about depression by selected maternalcharacteristics (age, race/ethnicity, education level, maritalstatus, participation in the Special Supplemental NutritionProgram for Women, Infants, and Children [WIC] duringpregnancy, health insurance at delivery,§ and number of previous live births) and behaviors and experiences (smoking statusduring the last 3 months of pregnancy or the postpartumperiod, experience of intimate partner violence before or during pregnancy, and self-reported depression before or duringpregnancy). Chi-squared tests of independence were examinedfor PDS only for selected maternal characteristics (breastfeeding initiation and duration and having a health care providerask about depression during prenatal and postpartum visits)and infant characteristics (infant’s gestational age at birth andinfant vital status at survey completion). Subgroup differencesin PDS and health care provider inquiry about depressionduring prenatal and postpartum visits were ascertained using95% confidence interval¶ estimates of the weighted prevalence.CDC tested for linear trends in aggregate estimates of PDSfrom 2012 to 2018 among 16 continuously reporting sites**and linear trends in health care providers asking about depression during prenatal and postpartum visits from 2016 to 2018for 22 continuously reporting sites,†† using logistic regression,adjusting for site. All statistical analyses were conducted usinga SAS (version 9.4; SAS Institute) complex survey module toaccount for the PRAMS sampling design.ResultsAmong respondents from 31 PRAMS sites, the prevalence ofself-reported PDS was 13.2%, ranging from 9.7% (Illinois) and10.3% (Massachusetts) to 19.4% (West Virginia) and 23.5%(Mississippi) (Table 1). Among 16 continuously reporting sites,a small but statistically significant annual percentage pointincrease of 0.22% (p-value 0.05) in PDS was observed from2012 to 2018. PDS prevalence varied by selected demographicand other maternal characteristics (Table 2). Prevalence was§* The 31 sites include Alaska, Colorado, Connecticut, Delaware, Georgia, Illinois,Kansas, Kentucky, Louisiana, Maine, Massachusetts, Michigan, Minnesota,Mississippi, Missouri, Nebraska, New Jersey, New Mexico, New York City,North Dakota, Pennsylvania, Puerto Rico, Rhode Island, South Dakota, Utah,Vermont, Virginia, Washington, West Virginia, Wisconsin, and Wyoming.† Variables obtained from infant’s birth certificate include maternal age, race/ethnicity, education level, marital status, WIC participation during pregnancy,health insurance at delivery, number of previous live births, and infantgestational age at birth. Variables obtained from survey include smoked cigarettesduring last 3 months of pregnancy, smoked cigarettes postpartum, any intimatepartner violence before or during pregnancy, breastfeeding duration, infantvital status at survey completion, self-reported depression before pregnancy,self-reported depression during pregnancy, health care provider asked aboutdepression during prenatal visits, health care provider asked about depressionduring postpartum visits, and postpartum depressive symptoms.576MMWR / May 15, 2020 / Vol. 69 / No. 19Health insurance at delivery coded in order of priority: “Private (PrivateInsurance, Champus/Tricare)”; “Medicaid (Medicaid)”; and “None (Self-Pay,Indian Health Service).” “Other Gov” or “Other” were excluded because thesewere non-Medicaid, state-specific plans.¶ To provide general guidance on the statistical differences, 95% confidence intervals(CIs) for the prevalence were compared across groups, with an emphasis onidentifying differences (i.e., nonoverlap of CIs) between categories within theselected variables. This typically conservative approach might fail to note differencesbetween estimates more often than formal statistical testing. Overlap between CIsdoes not necessarily mean that there is no statistical difference between estimates.** The 16 sites include Alaska, Delaware, Illinois, Maine, Massachusetts,Missouri, New Jersey, New Mexico, New York City, Pennsylvania, Utah,Vermont, Washington, West Virginia, Wisconsin, and Wyoming.†† The 22 sites include Alaska, Colorado, Connecticut, Delaware, Illinois,Louisiana, Maine, Massachusetts, Michigan, Missouri, New Jersey, NewMexico, New York City, Pennsylvania, Rhode Island, Utah, Vermont, Virginia,Washington, West Virginia, Wisconsin, and Wyoming.US Department of Health and Human Services/Centers for Disease Control and Prevention
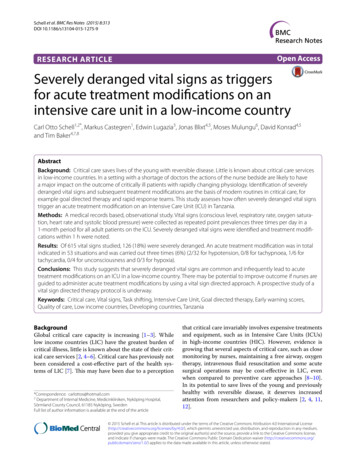
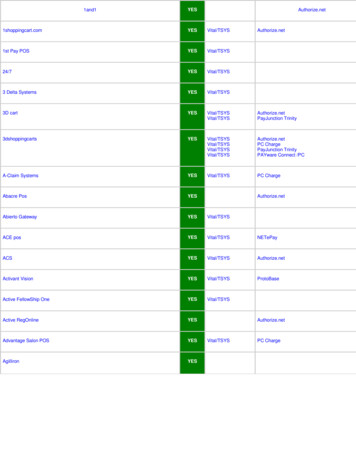
Morbidity and Mortality Weekly Reporthigher among women aged 19 and 20–24 years, those whowere non-Hispanic black (black), non-Hispanic AmericanIndian/Alaska Native (American Indian/Alaska Native) ornon-Hispanic Asian/Pacific Islander (Asian/Pacific Islander),who had completed 12 years of education, and were notmarried (includes living with partner), than among those aged25–34 and 35 years, who were non-Hispanic white (white)or Hispanic, had completed 12 years of education and weremarried. Prevalence was also higher among women who hadparticipated in WIC during pregnancy, had Medicaid at delivery, smoked cigarettes during the last 3 months of pregnancyor postpartum, breastfed their infants for 8 weeks, had experienced intimate partner violence before or during pregnancy,self-reported depression before or during pregnancy, or whoseinfant had died since birth, compared with women who hadnot participated in WIC, had private health insurance, hadnot smoked during the last trimester or postpartum, breastfedtheir infants for 8 weeks, had not experienced intimate partner violence, had not experienced depression before or duringpregnancy, and whose infant was alive at the time of the survey.PDS prevalence exceeded 20% among women aged 19 years,American Indians/Alaska Natives, women who smoked duringor after pregnancy, experienced intimate partner violence ordepression before or during pregnancy, or whose infant haddied since birth.Nearly all women (99.2%) received prenatal care; 79.1%of those who received prenatal care reported being asked by ahealth care provider about depression during pregnancy. Theprevalence of health care provider inquiry about depressionduring prenatal visits varied by site, ranging from 51.3%(Puerto Rico) and 69.4% (Mississippi) to 90.6% (Minnesota)and 90.7% (Alaska) (Table 3).The percentage of women who reported that a health careprovider asked about depression during prenatal visits washigher among respondents aged 19 and 20–24 years thanamong those aged 25 years, and was higher among thosewho were black, Hispanic, American Indian/Alaska Native,or non-Hispanic other (other) than among respondents whowere white or Asian/Pacific Islander. Prevalence was alsohigher among those who had 12 years of education, were notmarried, had participated in WIC, had Medicaid at delivery,smoked cigarettes during the last trimester of pregnancy, orself-reported depression before or during pregnancy comparedwith those who had 12 years of education, were married, hadnot participated in WIC, had private or no health insurance,had not smoked during the last trimester of pregnancy, orhad not experienced depression before or during pregnancy(Table 4). Among 22 continuously reporting sites, the prevalence of health care provider inquiry about depression duringprenatal visits increased significantly during 2016–2018, fromTABLE 1. Prevalence of self-reported postpartum depressivesymptoms among women with a recent live birth, 31 sites —Pregnancy Risk Assessment Monitoring System (PRAMS), 2018SiteAll 31 anMinnesotaMississippiMissouriNebraskaNew JerseyNew MexicoNew York CityNorth DakotaPennsylvaniaPuerto RicoRhode IslandSouth DakotaUtahVermontVirginiaWashingtonWest VirginiaWisconsinWyomingNo.*Postpartum depressivesymptoms %† (95% 619951,2228481,1261,10068198853813.2 (12.6–13.8)14.8 (12.2–17.3)11.1 (8.8–13.3)11.7 (9.6–13.7)13.1 (10.7–15.5)13.6 (10.4–16.7)9.7 (7.9–11.4)14.7 (11.6–17.7)14.0 (10.7–17.2)15.9 (13.3–18.6)10.9 (8.2–13.5)10.3 (8.4–12.2)16.4 (14.2–18.5)10.6 (8.5–12.7)23.5 (20.5–26.6)13.7 (11.2–16.3)12.1 (9.5–14.7)11.2 (9.3–13.0)15.3 (13.2–17.4)15.5 (13.2–17.7)11.7 (9.1–14.3)14.7 (12.0–17.4)10.8 (8.3–13.3)12.3 (9.9–14.6)13.0 (10.7–15.3)14.7 (12.3–17.0)10.7 (8.5–12.9)13.5 (10.1–16.8)11.4 (9.2–13.5)19.4 (15.9–22.9)10.5 (8.0–12.9)15.7 (12.0–19.5)Abbreviation: CI confidence interval.* Unweighted sample size.† Weighted percentage.76.2% to 79.3% (p 0.05), with an average annual percentagepoint increase of 1.5% (data not shown).Overall, 90.1% of women attended a postpartum visit,among whom 87.4% reported being asked by a health careprovider about depression during the visit. The percentage ofwomen reporting that their health care provider asked aboutdepression during a postpartum visit varied by site, rangingfrom 50.7% (Puerto Rico) and 73.1% (New York City) to95.9% (Minnesota) and 96.2% (Vermont) (Table 3). Thereported percentage of having a health care provider ask aboutdepression during a postpartum visit was higher among womenaged 19 years (compared with women aged 20–24, 25–34 or 35 years), who were white, American Indian/Alaska Native, orother (compared with those who were Asian/Pacific Islander),and among those who self-reported depression before or duringpregnancy (Table 4). Among 22 continuously reporting sites,the prevalence of health care provider inquiry about depression during the postpartum visit increased significantly fromUS Department of Health and Human Services/Centers for Disease Control and PreventionMMWR / May 15, 2020 / Vol. 69 / No. 19577
Morbidity and Mortality Weekly ReportTABLE 2. Prevalence of self-reported postpartum depressivesymptoms among women with a recent live birth, by selectedcharacteristics — Pregnancy Risk Assessment Monitoring System(PRAMS), 31 sites,* 2018TABLE 2. (Continued) Prevalence of self-reported postpartumdepressive symptoms among women with a recent live birth, byselected characteristics — Pregnancy Risk Assessment MonitoringSystem (PRAMS), 31 sites,* 2018Postpartum depressivesymptoms(N 32,659)†%§ (95% CI)Postpartum depressivesymptoms(N 32,659)†%§ (95% CI)CharacteristicAge group (yrs)¶ 1920–2425–34 35Race/Ethnicity¶White, non-HispanicBlack, non-HispanicHispanicAmerican Indian/Alaska Native, non-HispanicAsian/Pacific Islander, non-HispanicOther, non-HispanicEducation level (yrs)¶ 1212 12Marital status¶MarriedNot married**WIC participation during pregnancy¶YesNoHealth insurance at delivery¶PrivateMedicaidNoneNo. of previous live birthsFirst birthSecond or later birthSmoked cigarettes during last 3 mos of pregnancy¶YesNoSmoked cigarettes postpartum¶YesNo22.2 (18.8–25.6)17.8 (16.3–19.4)11.9 (11.2–12.6)10.8 (9.7–12.0)11.4 (10.7–12.1)18.2 (16.5–19.9)12.0 (10.8–13.2)22.0 (17.7–26.3)19.2 (16.6–21.7)16.3 (13.1–19.5)17.8 (15.8–19.7)16.2 (14.9–17.5)11.2 (10.6–11.9)11.0 (10.3–11.6)16.9 (15.9–17.9)17.0 (15.9–18.0)11.2 (10.6–11.9)10.1 (9.5–10.8)17.2 (16.3–18.2)13.2 (10.0–16.3)13.2 (12.3–14.1)13.2 (12.5–13.9)22.3 (19.7–24.8)12.4 (11.9–13.0)21.5 (19.4–23.6)12.2 (11.6–12.8)84.1% to 88.0% (p 0.05) during 2016–2018, with an averageannual percentage point increase of 1.8% (data not shown).DiscussionIn this survey of women with a recent live birth from 31PRAMS sites, approximately one in eight reported experiencing postpartum depressive symptoms since their infant’sbirth; PRAMS responses are reported an average of 4 monthspostpartum, which suggests persistence of these symptoms.The observed variation in PDS by PRAMS sites and selectedcharacteristics is similar to that found in previous reports usingPRAMS data (12). Differences in the prevalence of PDS bysite might reflect differences in the distribution of risk factors,such as low socioeconomic status (13). In some subgroups,approximately 20% of women reported PDS, including those578MMWR / May 15, 2020 / Vol. 69 / No. 19CharacteristicAny intimate partner violence before/during pregnancy¶,††Yes33.1 (28.7–37.4)No12.5 (11.9–13.0)Breastfeeding duration¶Breastfed 8 wks11.8 (11.1–12.4)Breastfed 8 wks15.6 (14.2–17.0)Never breastfed14.0 (12.3–15.6)Infant gestational age at birth (wks)¶Preterm ( 37)17.1 (15.5–18.8)Term ( 37)12.8 (12.2–13.4)Infant vital status at survey completion¶Alive13.0 (12.4–13.5)Deceased48.7 (39.3–58.1)Self-reported depression before pregnancy¶Yes28.7 (26.7–30.7)No10.6 (10.1–11.2)Self-reported depression during pregnancy¶Yes34.3 (32.2–36.5)No9.9 (9.4–10.5)HCP asked about depression during prenatal visit¶Yes12.7 (12.0–13.3)No14.5 (13.2–15.8)HCP asked about depression during postpartum visit¶Yes12.3 (11.6–12.9)No14.3 (12.5–16.0)Abbreviations: CI confidence interval; HCP health care provider;WIC Special Supplemental Nutrition Program for Women, Infants, and Children.* Alaska, Colorado, Connecticut, Delaware, Georgia, Illinois, Kansas, Kentucky,Louisiana, Maine, Massachusetts, Michigan, Minnesota, Mississippi, Missouri,Nebraska, New Jersey, New Mexico, New York City, North Dakota,Pennsylvania, Puerto Rico, Rhode Island, South Dakota, Utah, Vermont,Virginia, Washington, West Virginia, Wisconsin, and Wyoming.† Unweighted sample size.§ Weighted percentage.¶ p 0.05 from chi-squared test of independence.** Includes single status or living with partner.†† Includes intimate partner violence from current husband/partner orex-husband/ex-partner.aged 19 years, who were American Indian/Alaska Native,smoked cigarettes during pregnancy or postpartum, experienced intimate partner violence before or during pregnancy,or self-reported depression before or during pregnancy.Women with postpartum depression are more likely to havea diagnosis of depression either before or during pregnancy(14). In this analysis, the percentage of women with PDS wassimilarly higher among those who self-reported depressionbefore or during pregnancy; this might reflect the continuumof the condition across the preconception and perinatal period.This study used an adaption of two items from the PatientHealth Questionnaire-2, an evidence-based tool used to screenfor current depressive symptoms. If the criteria for positivesymptomology are met using this tool in clinical practice,US Department of Health and Human Services/Centers for Disease Control and Prevention
Morbidity and Mortality Weekly ReportTABLE 3. Prevalence of health care providers asking about depressionduring prenatal and postpartum visits as reported by women witha recent live birth — Pregnancy Risk Assessment Monitoring System(PRAMS), 31 sites, 2018TABLE 4. Prevalence of health care providers asking about depressionduring prenatal and postpartum visits as reported by women witha recent live birth, by selected characteristics — Pregnancy RiskAssessment Monitoring System (PRAMS), 31 sites,* 2018Health care providers asked aboutdepression %† (95% CI)Health care providers asked about depression%* (95% CI)SiteAll 31 anMinnesotaMississippiMissouriNebraskaNew JerseyNew MexicoNew York CityNorth DakotaPennsylvaniaPuerto RicoRhode IslandSouth DakotaUtahVermontVirginiaWashingtonWest VirginiaWisconsinWyomingPrenatal visit(n 32,619)†Postpartum visit(n 29,187)†79.1 (78.4–79.7)90.7 (88.5–92.8)82.5 (79.9–85.0)73.5 (70.3–76.6)85.1 (82.5–87.6)79.1 (75.3–82.9)82.2 (79.9–84.5)77.9 (74.6–81.2)69.7 (65.3–74.1)70.8 (67.4–74.2)90.5 (88.1–92.8)82.7 (80.1–85.3)83.4 (81.2–85.6)90.6 (88.7–92.5)69.4 (66.1–72.7)77.9 (74.9–81.0)86.3 (83.6–89.0)71.6 (68.8–74.4)89.1 (87.3–90.9)71.2 (68.4–73.9)89.6 (87.2–92.0)81.4 (78.6–84.2)51.3 (47.3–55.3)83.9 (81.4–86.4)87.1 (84.6–89.6)69.5 (66.3–72.8)89.6 (87.6–91.7)77.0 (73.0–81.1)84.8 (82.2–87.4)78.6 (74.8–82.3)85.8 (82.8–88.9)80.2 (76.1–84.3)87.4 (86.9–88.0)94.2 (92.4–96.0)93.0 (91.2–94.8)89.8 (87.6–92.1)88.7 (86.2–91.1)85.8 (82.3–89.2)91.7 (90.0–93.4)85.2 (82.3–88.2)85.4 (81.8–88.9)75.0 (71.7–78.4)95.5 (93.8–97.3)93.6 (91.9–95.2)88.6 (86.6–90.5)95.9 (94.5–97.3)76.9 (73.8–80.1)85.2 (82.4–88.0)89.8 (87.4–92.3)84.8 (82.5–87.1)93.7 (92.2–95.2)73.1 (70.2–76.0)94.1 (92.1–96.2)90.7 (88.4–93.0)50.7 (46.1–55.2)91.8 (89.9–93.7)95.0 (93.4–96.7)87.3 (84.8–89.7)96.2 (94.9–97.6)90.3 (87.2–93.3)91.1 (89.1–93.2)82.4 (78.7–86.1)90.9 (88.2–93.6)85.9 (82.2–89.7)Abbreviation: CI confidence interval.* Weighted percentage.† Unweighted sample size.the patient should receive further assessment to determinewhether a diagnosis of major depressive episode is warranted(4). Identifying women with PDS should be complementedwith adequate systems to ensure needed diagnosis, treatment,and follow-up (5). One study from the National Survey ofDrug Use and Health indicated that past-year major depressiveepisodes are common in both pregnant (7.7%) and nonpregnant (11.1%) females of reproductive age (15). Furthermore,regardless of pregnancy status, as many as 60% of thesepersons did not receive a clinical diagnosis and only one halfreceived treatment (15). To optimize the health of women andinfants, postpartum care should become an ongoing process,with services and support tailored to each woman’s individualneeds. The comprehensive postpartum visit should includea full assessment of physical, social, and psychological wellbeing. Women with chronic medical conditions should beCharacteristicPrenatal visits Postpartum visit(n 32,619)§(n 29,187)§Age group (yrs)¶,** 1986.9 (84.0–89.7) 91.3 (89.4–93.3)20–2483.2 (81.7–84.7) 87.8 (86.4–89.2)25–3478.6 (77.7–79.5) 87.4 (86.7–88.2) 3574.9 (73.3–76.6) 86.4 (85.1–87.7)Race/Ethnicity¶,**White, non-Hispanic76.7 (75.8–77.6) 88.1 (87.3–88.8)Black, non-Hispanic85.5 (84.0–87.0) 86.8 (85.2–88.4)Hispanic81.8 (80.4–83.2) 86.2 (84.8–87.5)American Indian/Alaska Native, non-Hispanic 91.5 (88.2–94.8) 92.2 (88.3–96.1)Asian/Pacific Islander, non-Hispanic74.6 (71.8–77.5) 83.0 (80.6–85.5)Other, non-Hispanic82.8 (79.6–86.1) 91.4 (88.5–94.3)Education level (yrs)¶ 1284.4 (82.6–86.2) 87.7 (85.9–89.6)1283.2 (81.9–84.6) 87.1 (85.8–88.4) 1276.5 (75.7–77.4) 87.4 (86.8–88.1)Marital status¶Married75.8 (74.9–76.7) 87.2 (86.5–87.9)Not married††84.5 (83.5–85.5) 87.9 (86.9–88.8)WIC participation during pregnancy¶Yes84.1 (83.0–85.1) 88.2 (87.3–89.1)No76.4 (75.6–77.3) 87.1 (86.4–87.8)Health insurance at delivery¶Private75.2 (74.3–76.2) 87.2 (86.5–88.0)Medicaid84.3 (83.3–85.2) 87.9 (87.0–88.8)None77.3 (73.2–81.4) 86.9 (83.4–90.4)No. of previous live births**First birth78.4 (77.3–79.5) 88.4 (87.5–89.2)Second or later birth79.5 (78.7–80.3) 86.9 (86.2–87.6)Smoked cigarettes during last 3 mos of pregnancy¶Yes83.7 (81.4–86.1) 87.7 (85.2–90.1)No78.7 (78.0–79.4) 87.5 (86.9–88.0)Smoked cigarettes postpartumYes87.9 (85.9–89.9)N/ANo87.5 (86.9–88.1)Any intimate partner violence before/during pregnancy§§Yes80.5 (76.9–84.2) 85.9 (82.4–89.3)No79.0 (78.3–79.7) 87.6 (87.0–88.1)Self-reported depression before pregnancy¶,**Yes86.2 (84.7–87.7) 90.5 (89.0–91.9)No77.9 (77.2–78.7) 87.0 (86.4–87.7)Self-reported depression during pregnancy¶,**Yes85.5 (83.9–87.1) 90.7 (89.3–92.2)No78.1 (77.4–78.8) 87.0 (86.4–87.6)Abbreviations: CI confidence interval; N/A not applicable; WIC SpecialSupplemental Nutrition Program for Women, Infants, and Children.* Alaska, Colorado, Connecticut, Delaware, Georgia, Illinois, Kansas, Kentucky,Louisiana, Maine, Massachusetts, Michigan, Minnesota, Mississippi, Missouri,Nebraska, New Jersey, New Mexico, New York City, North Dakota,Pennsylvania, Puerto Rico, Rhode Island, South Dakota, Utah, Vermont,Virginia, Washington, West Virginia, Wisconsin, and Wyoming.† Weighted percentage.§ Unweighted sample size.¶ p 0.05 from chi-squared test of independence for the prenatal period.** p 0.05 from chi-squared test of independence for the postpartum period.†† Includes single status or living with partner.§§ Includes intimate partner violence from current husband/partner orex-husband/ex-partner.US Department of Health and Human Services/Centers for Disease Control and PreventionMMWR / May 15, 2020 / Vol. 69 / No. 19579
Morbidity and Mortality Weekly ReportSummaryWhat is already known about this topic?Perinatal depression is a complication of pregnancy associatedwith poor maternal and infant health outcomes. Universalscreening of pregnant and postpartum women for depressionis recommended.What is added by this report?Although 13% of surveyed women with a recent live birthreported depressive symptoms during the postpartum period,one in five did not report a health care provider asking aboutdepression during prenatal visits and one in eight reported theywere not asked about depression during postpartum visits.What are the implications for public health practice?Health care provider screening of all women in the perinatalperiod can increase identification of women at risk for depression and provision of care or referral for appropriate diagnosisand treatment.counseled regarding the importance of timely follow-up withtheir obstetrician–gynecologist or primary care provider forongoing coordination of care (16).The prevalence of inquiry about depression by a health careprovider was higher during postpartum than prenatal visits,both overall and in 21 (68%) of 31 participating sites. Theemphasis in ACOG recommendations for a full assessment ofmood and emotional well-being in the postpartum period (7)and less evidence of the benefit of screening pregnant versuspostpartum women for depression (5) might explain some ofthese differences. Although universal screening for depressionis recommended for pregnant and postpartum women (6,7),variation was seen in the percentage of women who reportedbeing asked about depression by the characteristics assessed.Despite the observed increase in the percentage of health careproviders asking women about depression over time, one ineight women with a live birth in 2018 reported not beingasked about depression during a postpartum visit, and one infive did not report being asked at a prenatal visit. Health careproviders can provide timely perinatal depression educationto women and family members or other support persons.§§Health systems can implement quality improvement throughscreening and linkage to care for depression during both theprenatal and postpartum periods (17).Variation in site-based estimates of the percentage of healthcare providers who asked about depression might be relatedto differences in state initiatives to increase provider capacityand link women to care. For example, state-based 175(17)30001-1/fulltext.580MMWR / May 15, 2020 / Vol. 69 / No. 19such as the Massachusetts Child Psychiatry Access Programfor Moms aim to increase the capacity of obstetric providersto address perinatal depression in health care settings (18).The Health Resources
self-reported depression during pregnancy, health care provider asked about depression during prenatal visits, health care provider asked about depression during postpartum visits, and postpartum depressive symptoms. care provider inquiry about depression by selected maternal characteristics (age, race/ethnicity, education level, marital