Transcription
First Quarter 2021 ResultsEarnings Call
Disclaimer: Forward Looking Statements and Use ofNon-GAAP InformationThis presentation includes statements concerning Blue Apron Holdings, Inc. and its future expectations, plans and prospects that constitute "forward-looking statements" within themeaning of the Private Securities Litigation Reform Act of 1995. For this purpose, any statements contained herein that are not statements of historical fact may be deemed to beforward-looking statements. In some cases, you can identify forward-looking statements by terms such as "may," "should," "expects," "plans," “forecasts,” "anticipates," "could," "intends,""target," "projects," "contemplates," "believes," "estimates," "predicts," "potential," or "continue," or the negative of these terms or other similar expressions. Blue Apron has based theseforward-looking statements largely on its current expectations and projections about future events and financial trends that it believes may affect its business, financial condition andresults of operations. These forward-looking statements speak only as of the date of this presentation and are subject to a number of risks, uncertainties and assumptions including,without limitation, the company achieving its expectations with regards to its expenses and net revenue and its ability to grow adjusted EBITDA and to achieve or maintain profitability, thecontinued sufficiency of the company’s cash resources, the company’s need for additional financing, its ability to effectively manage expenses and cash flows, and its ability to remain incompliance with the financial and other covenants under the company’s indebtedness; its ability to sustain the increased demand resulting from the COVID-19 pandemic and thecompany’s growth strategy, and to retain new customers; its ability, including the timing and extent, to sufficiently manage costs and to fund investments in operations from cash fromoperations or additional financings in amounts necessary to continue to support the execution of the company’s growth strategy; its ability, including the timing and extent, to successfullyexecute the company’s growth strategy, cost-effectively attract new customers and retain existing customers, continue to expand its direct-to-consumer product offerings and continue tobenefit from the implementation of operational efficiency practices; changes in consumer behaviors that could lead to declines in demand, both as the COVID-19 pandemic’s impact onconsumer behavior tapers, particularly as a result of fewer restrictions on dining options, and as a COVID-19 vaccine becomes widely available in the United States, and/or if consumerspending habits are negatively impacted by worsening economic conditions; any material and adverse impact of the COVID-19 pandemic on the company’s operations and results,including as a result of the company’s inability to meet demand due to loss of adequate labor, whether as a result of heightened absenteeism or challenges in recruiting and retention orotherwise, prolonged closures, or series of temporary closures, of one or more fulfillment centers and supply chain or carrier interruptions or delays; its ability to attract and retain qualifiedemployees and key personnel in sufficient numbers; its ability to effectively compete; its ability to maintain and grow the value of the company’s brand and reputation; its expectationsregarding, and the stability of, its supply chain, including potential shortages or interruptions in the supply or delivery of ingredients, as a result of COVID-19 or otherwise; its ability tomaintain food safety and prevent food-borne illness incidents and its susceptibility to supplier-initiated recalls; its ability to accommodate general changes in consumer tastes andpreferences or in consumer spending; its ability to comply with modified or new laws and regulations applying to its business; risks resulting from its vulnerability to adverse weatherconditions, natural disasters and public health crises, including pandemics; its ability to obtain and maintain intellectual property protection; and other risks more fully described in thecompany’s Annual Report on Form 10-K for the year ended December 31, 2020 filed with the SEC on February 23, 2021 and the company’s Quarterly Report on Form 10-Q for the quarterended March 31, 2021 filed with the SEC on May 6, 2021, and in other filings that the company may make with the SEC in the future. The company assumes no obligation to update anyforward-looking statements contained in this presentation as a result of new information, future events or otherwise.This presentation also includes adjusted EBITDA, which is a non-GAAP financial measure that is not prepared in accordance with, nor an alternative to, financial measures prepared inaccordance with U.S. generally accepted accounting principles (“GAAP”). In addition, this non-GAAP financial measure is not based on any standardized methodology prescribed byGAAP and is not necessarily comparable to similarly-titled measures presented by other companies. A reconciliation of this measure to the most directly comparable GAAP measure isincluded in the Appendix to this presentation.Certain data in this presentation was obtained from various external sources, and neither the company nor its affiliates, advisors, or representatives make any representation as to theaccuracy or completeness of that data or any commitment to update such data after the date of this presentation. Such data involve risks and uncertainties and are subject to change2based on various factors.
First Quarter 2021Business Highlights
Linda Findley KozlowskiPresident and Chief Executive Officer4
Net revenue for the first quarter of 2021 increased 27% year over year to 129.7million driven, in part, by the continued execution of the company’s growth strategy,including through product innovationFirst Quarter2021Business Highlights Key customer metrics’ year-over-year growth continued in the first quarter as AverageOrder Value grew 7% to 62, the highest reported level since prior to 2015; Ordersper Customer rose 15% to 5.4 and Average Revenue per Customer increased 22% to 331 (1), (2), (3) Net loss improved 4.4 million, or 22%, year over year in the first quarter to (15.7)million; adjusted EBITDA decreased 5% year over year to (6.1) million (4)1 We define Average Revenue per Customer as our net revenue from our meal, wine and market products sold on our e‑commerce platforms in a given reportingperiod divided by the number of Customers in that period.2 We define Orders Per Customer as the number of Orders in a given reporting period divided by the number of Customers in that period. Orders is defined as thenumber of paid orders by our Customers across our meal, wine and market products sold on our e-commerce platforms in any reporting period, inclusive of ordersthat may have eventually been refunded or credited to customers. We determine our number of Customers by counting the total number of individual customerswho have paid for at least one Order from Blue Apron across our meal, wine or market products sold on our e-commerce platforms in a given reporting period.3 We define Average Order Value as our net revenue from our meal, wine and market products sold on our e-commerce platforms in a given reporting period dividedby the number of Orders in that period.4 Adjusted EBITDA is defined as net income (loss) before interest income (expense), net, other operating expense, benefit (provision) for income taxes, depreciationand amortization and share-based compensation expense. See appendix for reconciliation of net income (loss) to Adjusted EBITDA.5
Business Highlights Over the Last Two YearsProduct Offered more choices and flexibility, with the ability to order more Blue Apron each week Have more variety, with 35 weekly options compared to 17 weekly options in January 2019 Launched new products (including Meal Prep, Premium and Wellness recipes) and new customizationoptions Announced Add-ons, which allows customers to add an appetizer, side dish, and dessert to a box eachweekOperations Further reduced food waste at our fulfillment centers with improved planning and forecasting processes,all while enhancing the variety and quality of ingredients Lowered our packaging costs while making Blue Apron boxes more sustainable Continued to optimize fulfillment center operations by better leveraging labor, packing, and equipmentMarketing Rebuilding the full marketing function with significant opportunity ahead Continued to lean into partnerships to help attract new customers and retain current ones6
First Quarter 2021Financial Results
Randy GrebenChief Financial Officer8
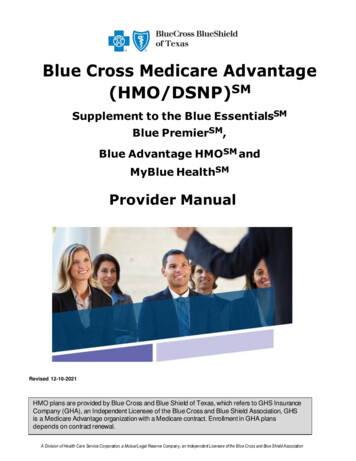
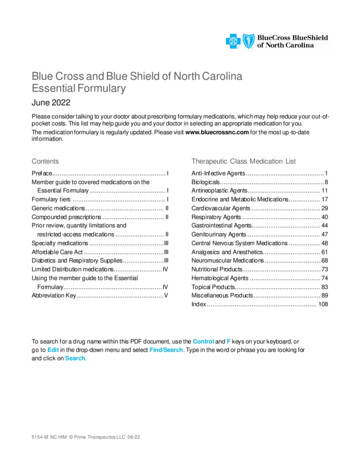
First Quarter PerformanceFourth consecutive quarter of double-digit year-over-year net revenue growth driven by product innovation and marketing investments, aswell as the continued impact on consumer behaviors as a result of the COVID-19 pandemicNet Revenue ( M)Marketing ( M) 129.7 Million15.4% 27% YoYAs a percentage of Net Revenue% of NetRevenue14.8%8.8%9.7%10.8%15.4%9
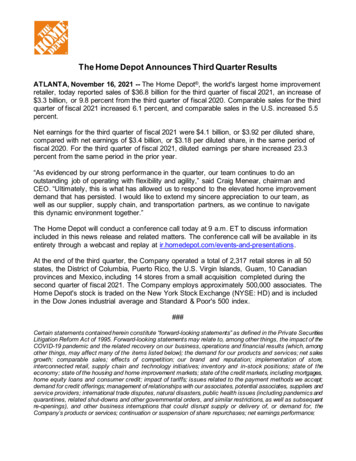
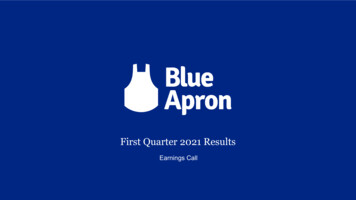
First Quarter PerformanceContinued progress on our growth strategy, combined with shifting consumer behaviors, contributed to the highest reported Average OrderValue in the first quarter of 2021 since prior to 2015Average RevenuePer Customer 1% YoY4.9%Growth24.9%21.9%21.7%22.5%Orders Per Customer 2Average Order Value 34.4%0.9%17.4%20.0%15.2%14.9%4.7%1.7%5.7%6.8%1 We define Average Revenue per Customer as our net revenue from our meal, wine and market products sold on our e‑commerce platforms in a given reporting period divided by the number of Customers in that period.2 We define Orders Per Customer as the number of Orders in a given reporting period divided by the number of Customers in that period. Orders is defined as the number of paid orders by our Customers across our meal, wine and marketproducts sold on our e-commerce platforms in any reporting period, inclusive of orders that may have eventually been refunded or credited to customers. We determine our number of Customers by counting the total number of individualcustomers who have paid for at least one Order from Blue Apron across our meal, wine or market products sold on our e-commerce platforms in a given reporting period.3 We define Average Order Value as our net revenue from our meal, wine and market products sold on our e-commerce platforms in a given reporting period divided by the number of Orders in that period.10
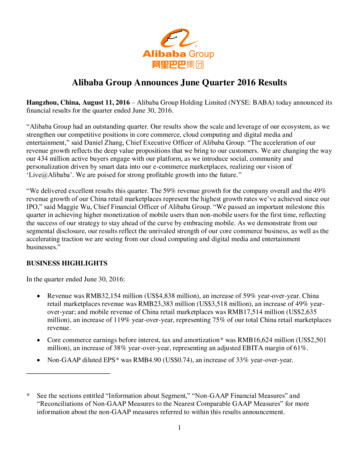
First Quarter PerformanceFood and labor investments to increase fulfillment center capacity and COVID-19 safety expenditures resulted in decreased NetRevenue less COGS margin and higher PTG&A compared to the prior yearNet Revenue Less COGS Margin 1PTG&A ( M)37.1% 36.6 Million-340 bps YoY 6.8% YoY% of NetRevenue1 Represents net revenue less cost of goods sold, excluding depreciation and amortization, as a percentage of net revenue.33.6%24.8%30.0%31.9%28.2%11
First Quarter PerformanceHigher net revenue drove year-over-year Net Loss improvement, offset by increased operational and marketing spend, leadingto flat year-over-year Adjusted EBITDAQ1’20Net Loss ( M)Adjusted EBITDA ( M)¹ (15.7) Million (6.1) MillionQ2 ‘20Q3 ‘20Q4 ‘20Q1 ‘21Q1 ‘20Q2 ‘20Q3 ‘20Q4 ‘20Q1 ‘211 Adjusted EBITDA is defined as net income (loss) before interest income (expense), net, other operating expense, benefit (provision) for income taxes, depreciation and amortization and share-basedcompensation expense. See appendix for reconciliation of net income (loss) to Adjusted EBITDA.12
Financial Outlook
Second Quarter20211Outlook Net revenue expected to decrease by approximately 4% to 7% year overyear in the second quarter of 2021 to approximately 122 million to 126million Net loss projected to be no more than (17.0) million and Adjusted EBITDA2loss projected to be no more than (7.0) million in the second quarter of 2021 For the full year 2021, the company expects to generate high single-digit tolow double-digit net revenue growth1This guidance assumes both the consistent benefit to our business from the execution of our strategic growth initiatives andongoing operational improvements. It also assumes planned investments in marketing initiatives, as well as our ability tomanage liquidity in compliance with our debt covenants. Further, this guidance assumes that seasonal fluctuations willreturn to the historical patterns we experienced pre-pandemic, reflecting that there may be a decrease in the impactCOVID-19 has had on consumer behaviors relating to cooking at home as restrictions continue to be lifted and more peopleare vaccinated. Lastly, the guidance assumes that we will not experience any unforeseen significant disruptions in ourfulfillment center operations or supply chain.2Adjusted EBITDA is defined as net income (loss) before interest income (expense), net, other operating expense, benefit(provision) for income taxes, depreciation and amortization and share-based compensation expense. See appendix forreconciliation of net income (loss) to Adjusted EBITDA.14
Q&A
Appendix: Adjusted EBITDAReconciliation
Reconciliation of Quarterly Net Income (Loss) toAdjusted EBITDAQ1 2020Q2 2020Q3 2020Q4 2020Q2 2021GuidanceQ1 2021(in millions) (20) 1 (15) (12) (16) (17)Share-based compensation222222Depreciation andamortization766666Other operating expense301000Interest (income) expense,net222222Provision (benefit) forincome taxes000000 (6) 11 (5) (2) (6) (7)Net income (loss)Adjusted EBITDA18
5 First Quarter 2021 Business Highlights Net revenue for the first quarter of 2021 increased 27% year over year to 129.7 million driven, in part, by the continued execution of the company's growth strategy,