Transcription
a p p l i c at i o n N o t eA Comparison of HCAImagAmp and ConventionalIndirect Immunofluorescencefor High Content Analysis(HCA) ApplicationsHCA ImagAmpAuthorsWolfgang Reintsch, Ph.D.Francesco Lipari, Ph.D.Julie Bedard, B.Sc.Claire Normand, DECPerkinElmer, Inc.Montreal, QCCanadaIntroductionHCA ImagAmp is an amplification system designed to provide significant enhancementof target-specific fluorescence signals and to improve sensitivity in immunofluorescencebased assays. Amplification is achieved through enzyme-mediated deposition of multiplefluorophores in close proximity to a given target. The technique utilizes the ability of horseradishperoxidase (HRP) to convert certain fluorophore-labeled substrates into highly reactivemolecules that will covalently bind to tyrosine residues in or very close to the enzyme(Hunyady et al., 1996).We evaluated the HCA ImagAmp kit in two typical HCA assays for cytotoxicity: apoptosisand DNA damage. Apoptosis can be induced with staurosporine and Cytochrome C stainingused as a marker. The mitochondrial protein Cytochrome C loses its specific localizationduring apoptosis, and becomes distributed more evenly in the cell. Detection of apoptoticcells is therefore based on a redistribution of the marker between cellular compartments.DNA damage is induced by neocarzinostatin (NCS), causing DNA double strand breaks. Asa result, phosphorylation of Histone H2A.X occurs, which can be detected with an antibody(Ab) against the phosphorylated protein (Rogakou et al., 1999). To measure the degree ofsignal enhancement by HCA ImagAmp in either assay, the kit was compared to a commonindirect immunofluorescence approach using fluorophore-labeled secondary antibodies (secAb).
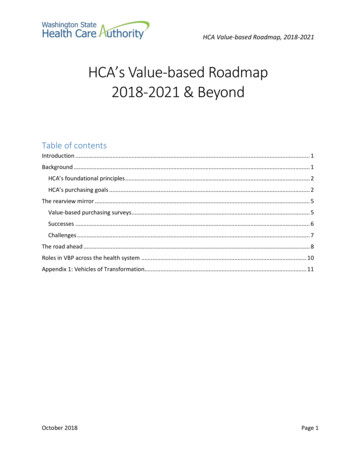
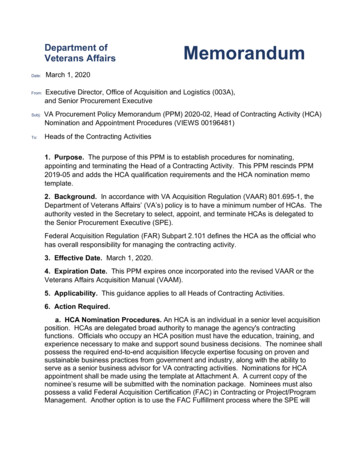
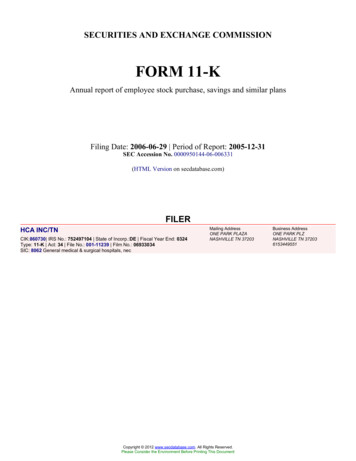
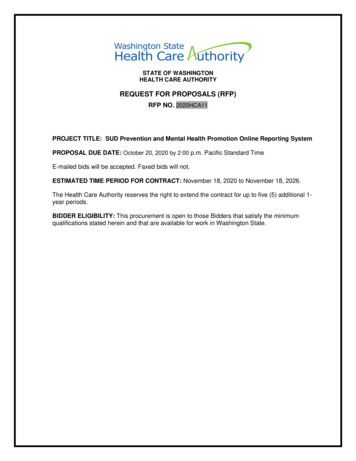
ApplicationTo perform immunofluorescence staining in the twocytotoxicity assays, a standard protocol was used. HeLacells were seeded at a density of 6000 cells per well inCellCarrier -384 plates. After overnight incubation, theappropriate molecule was introduced to induce apoptosis(1 µM staurosporine for 4 hours) or DNA damage (1 µg/mLNCS for 1 hour). The cells were then fixed in 3.7% formaldehyde and permeabilized with a 0.1% Triton/PBS solution.Simultaneously, the nuclei were counterstained by adding2 µg/mL Hoechst 33342 to the solution. Primary Ab andHRP-labeled secAb incubation steps were done in PerkinElmerblocking solution, followed by a 10 min incubation stepwith HCA ImagAmp reagent. To compare the performanceof the HCA ImagAmp with a commonly used indirectimmunofluorescence approach, cells were stained in parallelwith a secAb labeled with an Alexa Fluor fluorophore ofthe corresponding wavelength, under otherwise identicalconditions. Cells were imaged on the Operetta HighContent Imaging System, using a 20X WD objective.Apoptosis AssayIn the apoptosis assay, Cytochrome C is bound to mitochondria inuntreated control cells, while in apoptotic cells it distributes moreevenly in the cell and can also be found in the nucleus (Figure 1).After initial optimization of the anti-Cytochrome C antibody concentration, robust staining was obtained with HCA ImagAmp inboth untreated and staurosporine-treated cells (Figure 1, A and B).In contrast, Alexa Fluor -labeled secAb stained cells, whenimaged under exactly the same conditions, did not yield a significant staining (Figure 1, C and D). To determine the percentage ofapoptotic cells in the images obtained with HCA ImagAmp, theaverage intensity of the Cytochrome C staining was determinedwithin the nucleus and within a perinuclear ring outside of thenucleus. A cell was considered as apoptotic when the nuclear/perinuclear ratio increased over a threshold. The results aresummarized in Table 1 and show that the ratio almost doubledafter staurosporine treatment. Accordingly, 72.5% of the cellswere found apoptotic, in contrast to only 3.9% in untreatedcontrols. To quantify the extent of amplification by HCAImagAmp compared to standard immunofluorescence, theconcentration of the primary Ab and the exposure time wereadjusted in each application to produce equivalent intensitylevels with HCA ImagAmp and an Alexa Fluor -labeled secAb.The results are summarized in Figure 2. Judged by the averageintensity of the perinuclear Cytochrome C signal, HCA ImagAmpallowed a 20-fold greater dilution of the anti-Cytochrome C Ab,as well as a 10-fold reduction in exposure time as compared tothe Alexa Fluor -labeled secAb.goat anti-mouse HRP HCA ImagAmp eatedCytochrome C nucleiCytochrome Cuntreatedgoat anti-mouse Alexa Fluor 488ABCA B C DD Figure 1. Apoptosis induction imaged with HCA ImagAmp 488. HeLa cells were grown overnight in CellCarrier-384 plates, then incubated with 1 µMStaurosporine for 4 hours and fixed. All Cytochrome C images (green) were taken at 35 msec exposure time. A-D) Anti-Cytochrome C Ab (0.5 µg/mL).A, B) secAb goat anti-mouse HRP (1 µg/mL) HCA ImagAmp 488. C, D) secAb goat anti-mouse Alexa Fluor 488 (5 µg/mL). A -D ) Overlay of CytochromeC staining with nuclear counterstain Hoechst 33342 (blue).Table 1. Apoptotic cells were identified by an increase in the ratio of nuclear/perinuclear (cytoplasmic) CytochromeC ImagAmp 488 staining. represents standard deviation. Z was calculated comparing average ratios of treated anduntreated wells (4 wells per condition).Avg. ratio nuclear/perinuclear Cytochrome C% apoptotic cells2untreated0.47 0.033.9% 0.8Staurosporine-treated0.91 0.0172.5% 6.0Z untreated/Staurosporine-treated0.72
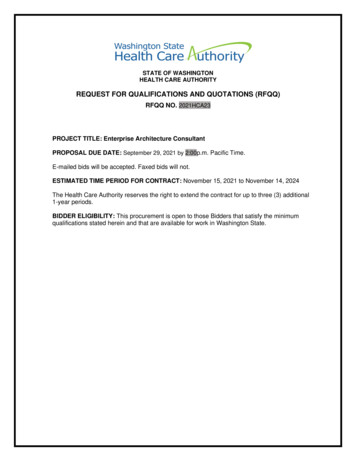
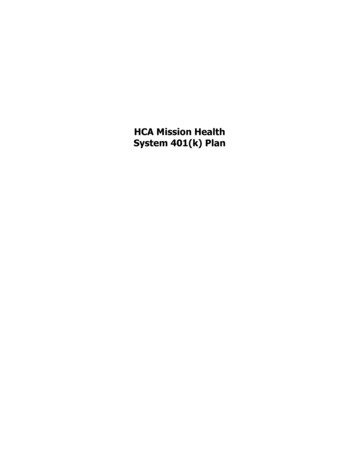
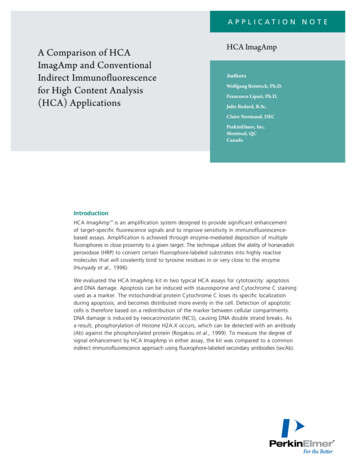
HCA ImagAmp 546Alexa Fluor StainingMethodPrimary AbConcentrationExposureTimeAverage IntensityPrimary Ab StainSignalAmplification20-fold reductionin primary Abcombined with10-fold reductionin exposure timeHCA ImagAmp 5460.025 µg/mL35 ms2781 112Alexa Fluor 5460.5 µg/mL350 ms2585 387HCA ImagAmp 5460.025 µg/mL35 ms2402 191Alexa Fluor 5460.5 µg/mL350 ms2185 197 Figure 2. A comparison of imaging conditions for HCA ImagAmp 546 and Alexa Fluor 546 in the apoptosis assay. The antibody dilution and exposure timeswere adjusted to obtain similar staining intensities with both techniques. A and B) HeLa cells after apoptosis induction. Primary Ab anti-Cytochrome C (yellow).Overlay with Hoechst 33342 counterstain (blue). A) SecAb goat anti-mouse HRP (1 µg/mL) HCA ImagAmp 546. B) SecAb goat anti-mouse Alexa Fluor 546(5 µg/mL). C) Comparison of imaging conditions: The average intensity of the Cytochrome C staining is measured in a perinuclear ring. represents standarddeviation.DNA Damage AssayIn the DNA damage assay, after staining with HCA ImagAmp,virtually all nuclei of cells treated with NCS were stronglypositive for phospho-Histone H2A.X, while untreated cellsshowed mostly much weaker or no staining (Figure 3, Aand B). Staining with an Alexa Fluor -labeled secAb underotherwise exactly the same conditions produced no significantsignal (Figure 3, C and D). To calculate the percentage ofDNA damage positive cells in the images stained with HCAImagAmp, the average intensity of nuclear phospho-HistoneH2A.X stain per cell was determined and a threshold appliedto separate positive and negative cells (Table 2). On average,staining between untreated and NCS-treated cells increasedby almost 9-fold. NCS treatment rendered 99.8% of thecells positive, in contrast to 3.1% without treatment. Severalpublications indicate the occurrence of DNA double strandbreaks in a subpopulation of untreated cells (Kim et al., 2011and references therein). Therefore the small percentage ofpositive cells detected might indeed indicate such events inproliferating HeLa cells.In the DNA damage assay, a 40-fold reduction of antiphospho-Histone H2A.X Ab, combined with an 8-foldshorter exposure time, was sufficient to produce equivalentstaining intensities with HCA ImagAmp (Figure 4). Thereforethe improved sensitivity achieved by HCA ImagAmp significantly reduces exposure and plate reading times. The resultssuggest the technique is especially useful to produce robustfluorescence signals at a very low concentration of targetbound primary Ab.In addition, the amplification mechanism of HCA ImagAmpmight improve the detection of cellular targets. For example,it might allow detection of cellular changes at lowerconcentrations of an inducer than the standard indirectimmunofluorescence approach. To compare the sensitivityof the two staining approaches, a DNA damage assay witha dilution series of NCS was performed. First, to be comparable,anti-phospho-Histone H2A.X Ab concentrations and exposuretimes were set at levels to produce equivalent averagenuclear staining intensities at the highest concentration ofNCS (1000 ng/mL). In the experiment shown in Figure 5,similar values were reached at 40-fold less primary Ab and3
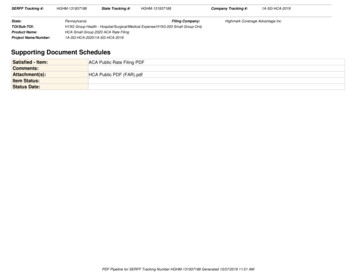
9-fold shorter exposure time for HCA ImagAmp. Using thesesettings, images were acquired at all NCS concentrations.The results show that, down to 30 ng/mL NCS, the averageintensity of phospho-Histone H2A.X staining produced byHCA ImagAmp, remained very high. In contrast, the signalwith Alexa Fluor -labeled secAb was already significantlyreduced at 100 ng/mL NCS (Figure 5 C). At NCS concentrationslower than 10 ng/mL and in untreated cells the intensityvalues obtained with both techniques were again similar.Therefore HCA ImagAmp, in comparison to Alexa Fluor labeled secAb, maintains a strong, specific signal at lowerconcentrations of NCS without an increase of unspecificsignal.At low levels of DNA damage, DNA double strand breaksare indicated by discrete nuclear spots of phospho-HistoneH2A.X staining (Rothkamm and Loebrich, 2003). A lowoccurrence of such spots per nucleus will not have asignificant impact on the average intensity measurementsthat were used in the experiment shown in Figure 5 toidentify effective NCS concentrations. At 3 ng/mL of NCS,phospho-Histone H2A.X spots at varying intensities can beclearly seen (Figure 6, A and B), while the average intensityof the staining in these nuclei reached already control levels(Figure 5 C). To extend the analysis of NCS-induced DNAdamage, nuclei of cells treated with low concentrations ofNCS were evaluated with the SER-texture analysis module, afeature of the Harmony image analysis software that allowsthe identification of defined structures, in this case spots,within an object. As the readout of this module, a value isassigned to each cell, depending on the frequency and intensity of spots in the nucleus. Higher values indicate a higherlevel of spots. In Figure 6 D, a comparison of the populationdistribution of spot-values is shown. The results indicate ashift of spot values toward higher values after treatmentwith 3 ng/mL NCS compared to untreated controls. In HCAImagAmp-stained cells, this shift is much more pronouncedthan in cells stained with Alexa Fluor -labeled secAb, allowingan improved separation between untreated and treatedcells. This data indicates that HCA ImagAmp can improvethe identification of relatively small structures in cells andthereby further increase the sensitivity of detection.goat anti-mouse HRP HCA ImagAmp 546NCS-treateduntreatedgABCA B C NCS-treatedDnucleiphosphorylatedHistone H2A.Xuntreatedgoat anti-mouse Alexa Fluor 546D Figure 3. DNA damage induction imaged with HCA ImagAmp. HeLa cells were grown overnight in CellCarrier-384 plates, then incubated with 1 µg/mL NCSfor 1 hour and fixed. All phospho-Histone H2A.X images (yellow) were taken at 25 msec exposure time. A-D) anti-phospho-Histone H2A.X Ab (0.5 µg/mL).A -D ) overlay phospho-Histone H2A.X and nuclear counterstain (blue, Hoechst 33342). A and B) SecAb goat anti-mouse HRP (1 µg/mL) HCA ImagAmp546. C and D) SecAb goat anti-mouse Alexa Fluor 488 (5 µg/mL).Table 2. Phospho-Histone H2A.X positive cells were identified by an increase in average nuclear staining with HCAImagAmp 546. represents standard deviation. Z was calculated comparing average nuclear phospho-Histone H2A.Xintensities of treated and untreated wells (4 wells per condition).4Avg. intensity nuclearphospho-Histone H2A.X% phospho-HistoneH2A.X positiveuntreated510 1043.1% 1.4NCS-treated4505 14599.8% 0.2Ratio avg. intensityNCS-treated/untreatedZ NCS-treated/untreated8.830.81
HCA ImagAmp 546Alexa Fluor StainingMethodPrimary AbConcentrationExposureTimeAverage IntensityPrimary Ab StainSignalAmplification20-fold reductionin primary Abcombined with10-fold reductionin exposure timeHCA ImagAmp 5460.05 µg/mL50 ms288 34Alexa Fluor 5462 µg/mL400 ms384 105HCA ImagAmp 5460.05 µg/mL50 ms6046 47Alexa Fluor 5462 µg/mL400 ms6655 262Figure 4. A comparison of imaging conditions for HCA ImagAmp 546 and Alexa Fluor 546 in the DNA damage assay. The antibody dilution and exposure timeswere adjusted to obtain similar staining intensities with both techniques. A and B) HeLa cells after induction of DNA damage. Primary Ab anti-phosphoHistone H2A.X (yellow). A) SecAb goat anti-mouse HRP (1 µg/mL) HCA ImagAmp 546. B) SecAb goat anti-mouse Alexa Fluor 546 (5 µg/mL). C)Comparison of imaging conditions: The average intensity of the phospho-Histone H2A.X staining is measured in the nucleus. represents standard deviation.ng/mL NCS1000CBAlexa Fluor 546pH2A.X2 µg/mLExp. time: 450 msAHCA ImagAmp 546pH2A.X0.05 µg/mLExp. time: 50 ms30Figure 5. HCA ImagAmp increases sensitivity of detection. HeLa cells were cultured overnight in CellCarrier-384 plates, then incubated with differentconcentrations of NCS (ranging from 0.1 to 1000 ng/mL) for 1 hour and fixed. A) primary Ab phospho-Histone H2A.X, secAb goat anti-mouse HRP(1 µg/mL) HCA ImagAmp 546. B) primary Ab phospho-Histone H2A.X, secAb goat anti-mouse Alexa Fluor 546 (5 µg/mL). Nuclear counterstain withHoechst 33342 was omitted for clarity. C) NCS dilution series. Scale on x-axis is logarithmic.5
HCA ImagAmp 546Phospho-HistoneH2A.X Spot 0.0065Phospho-HistoneH2A.XHoechst PhosphoHistone H2A.XHCA ImagAmp 5463 ng/mL NCSAuntreated3 ng/mL NCSDBCAlexa Fluor 546untreated3 ng/mL NCSFigure 6. Texture analysis to evaluate DNA damage at low concentrations of NCS. Conditions are identical to Figure 5. A) HeLa cells treated with 3 ng/mLNCS. Overlay of nuclear counterstain (Hoechst 33342, blue) and phospho-Histone H2A.X stain (yellow). B) Phospho-Histone H2A.X stain alone. C)SER-spot analysis. Encircled nuclei show a spot index above the threshold of 0.0065. D) Examples for population distributions of cells according to their spot index.Each scatterplot represents one imaged field. Red dots depict cells below threshold; green dots are cells above threshold (threshold HCA ImagAmp 546: 0.0065,Alexa Fluor 546: 0.0035).ConclusionsIn this study, we analyzed the ability of HCA ImagAmp toincrease sensitivity in immunofluorescence by applying it totwo widely used HCA applications. The technique requiresminimal adjustment to a standard immunofluorescenceprotocol, adding only a 10 min incubation period at theend, however, it can greatly enhance the ability to detect agiven target. HCA ImagAmp delivers improved results withsimultaneous reduction in primary antibody and exposuretime. NCS-titration experiments show that HCA ImagAmp6allows specific enhancement of signal intensity at low levelsof DNA damage, thereby shifting the detection limit towardlower concentrations of NCS.Higher sensitivity provided by HCA ImagAmp allows detectionat lower concentrations of target and/or primary Ab. Thisadvantage may be used for development of more efficientstaining protocols and allow for quantitation of targets thatpreviously escaped detection due to the availability of lowaffinity marker antibodies or relatively low target abundance.
MaterialsProductCompanyCatalog No.HeLa cellsATCCCCL-2CellCarrier-384 carzinostatinSigmaN9162Mouse anti-phospho-Histone H2A.XMillipore05-636Mouse anti-Cytochrome CBD Bioscience556432Goat anti-mouse IgG HRPPerkinElmerNEF822001EAGoat anti-mouse IgG Alexa Fluor 488InvitrogenA-11029Goat anti mouse IgG Alexa Fluor 546InvitrogenA-11030HCA ImagAmp 488PerkinElmerNEL771B001KTHCA ImagAmp 546PerkinElmerNEL774B001KTBlocking ReagentPerkinElmerFP1012Hoechst 33342InvitrogenH3570ReferencesBossy-Wetzel et al. (1998): Mitochondrial cytochrome crelease in apoptosis occurs upstream of DEVD-specificcaspase activation and independently of mitochondrialtransmembrane depolarization. EMBO J, 17: 37-49.Hunyady et al. (1996): Immunohistochemical signal amplification by catalyzed reporter deposition and its application indouble immunostaining. J Histochem Cytochem, 44: 1353-62.Kim et al. (2011): Development of a High-Content ScreeningMethod for Chemicals Modulating DNA Damage Response.J Biomol Screening, 16: 259-265.Rogakou et al. (1999): Megabase chromatin domains involvedin DNA double-strand breaks in vivo. J Cell Biol, 146: 905-16.Rothkamm and Loebrich (2003): Evidence for a lack of DNAdouble-strand break repair in human cells exposed to verylow x-ray doses. Proc Natl Acad Sci, 100: 5057-62.7
PerkinElmer, Inc.940 Winter StreetWaltham, MA 02451 USAP: (800) 762-4000 or( 1) 203-925-4602www.perkinelmer.comFor a complete listing of our global offices, visit www.perkinelmer.com/ContactUsCopyright 2011, PerkinElmer, Inc. All rights reserved. PerkinElmer is a registered trademark of PerkinElmer, Inc. Alexa Fluor is a registered trademark of Life Technologies. All other trademarks are the property of their respective owners.009834 01Sep 2011Printed in USA
HCA ImagAmp 546 0.025 µg/mL 35 ms 2781 112 546 0.5 µg/mL 350 ms 2585 387 HCA ImagAmp 546 0.025 µg/mL 35 ms 2402 191 Alexa Fluor 546 0.5 µg/mL 350 ms 2185 197 DNA Damage Assay In the DNA damage assay, after staining with HCA ImagAmp, virtually all nuclei of cells treated with NCS were strongly