Transcription
Pre-paid electricity plan and electricity consumption behavior 1Yueming (Lucy) Qiu2, 3, Bo Xing 4Feb 2nd , 2015Abstract:This paper demonstrates using basic economic theory that there are four possible channels viawhich a reduction in electricity consumption can be achieved by the adoption of a pre-paid plan:nudging, price effects, information provision, and costs of being disconnected. By usingcustomer level residential billing data from 2008-2010 of a major utility company in Phoenixmetropolitan area, this study adopts a matching approach and a difference-in-differences methodto estimate empirically the impact of a pre-paid electricity plan on residential electricityconsumption, after correcting for selection bias. Results show that the pre-paid program isassociated with a 12% reduction in electricity usage, customers with lower level of wealth orthose with higher amount of arrear prior to switching to the pre-paid program tend to save moreelectricity after switching, and pre-paid customers save more electricity in the summer thanwinter.JEL: L94, Q41Keywords: pre-paid electricity pricing, energy conservation, matching, difference-in-differences1We would like to thank the following individuals for the helpful comments they offered during the preparation ofthis paper: Catherine Kling, Karen Fisher-Vanden, Kelsey Jack, Lucija Muehlnbachs, Laura Grant, Cati Hausman,Aaron Dock, Daniel Laney, Benjamin F. Hobbs, Jian Ni and seminar participants at JHU Energy Group and 2015ASSA/IAEE.2Corresponding author3Assistant professor, Arizona State University, Program of Technological Entrepreneurship and InnovationManagement , 7231 E. Sonoran Arroyo Mall, Mesa, AZ 85212, USA. yueming.qiu@asu.edu Tel: 623-209-47254Senior analyst, Salt River Project, Department of Forecasting, Research & Economic Development. 1600 N. PriestDr., Tempe, AZ 85281. Bo.Xing@srpnet.com1
1. IntroductionUnder the conventional method of paying for electricity bills (the post-pay scheme), a householdpays for its electricity consumption once a month after they consume the electricity. This is quitedifferent from the payment procedure for other consumption goods, such as groceries orgasoline, in which payment occurs prior to the consumption of the goods. One might wonderhow would people’s consumption for groceries or gasoline change if they pay for them once amonth post consumption and/or only find out how much they have consumed when they pay forthe monthly bills?Similar to paying for consumption goods such as groceries, pre-paid electricity metersrequire customers to pay before consuming the electricity. In most cases, an in-home displayusually accompanies the pre-paid system which provides feedback on how much energy or credithas been used. Currently there are only several utilities in Michigan, Arizona, Texas, Oklohamaand Georgia that have pre-paid programs. Examples include Salt River Project (SRP) (pre-paidprogram beginning in 1993), Oklahoma Electric Cooperative (program starting in 2006), PublicUtility Commission of Texas (program starting in 2011), and Detroit Edison pilot (programstarting in 2010).In 1993, SRP, a major utility company in Phoenix metropolitan area, started a pre-paidelectricity program, commonly known as M-Power program. The M-Power program started outtargeting only customers with arrears facing terminations in their services but was eventuallymade available to all customers for voluntary subscription. Through over two decades oftechnology and operation improvement, the M-Power program has grown to a mature program,with 16.4% of SRP’s residential customers participating, making it the largest pre-paid programin the United States.2
Assessing the impact of pre-paid electricity programs on electricity consumption isimportant in three aspects. First, the recent EPA’s proposed rule on reducing carbon emissionsfrom existing power plants identifies energy efficiency programs, including energy conservationprograms, as one compliance mechanism (EPA, 2014). A pre-paid electricity program can be acandidate compliance program if there is adequate empirical evidence showing its energyconservation effects. Second, utility companies and other types of energy service companieshave implemented various types of energy conservation, energy efficiency and demand sidemanagement programs and there have been rich number of studies examining these other typesof programs. For example, studies find that home energy reports with information onhouseholds’ own and peers’ home electricity usage are effective at reducing households’ energyconsumption (Allcott, 2011b; Costa and Kahn, 2013). Utility rebates and financial incentives forenergy conservation are also shown to have statistically significant impact on energyconsumption (Ito, 2015). There are also studies evaluating utility dynamic electricity pricingprograms such as real-time pricing and time-of-use pricing (Aigner et al., 1994; Wolak, 2011;Jessoe and Rapson, 2014; Jessoe et al., 2014; Qiu and Kirkeide, 2014). However, literatureexamining the impact of pre-paid electricity pricing programs on electricity consumptionbehavior has been rare. Third, the number of studies evaluating the impact of informationprovision programs through smart grid and in-home displays (IHDs) on consumers’ electricityconsumption has increased in recent years (Matsukawa, 2004; Hargreaves et al., 2010; Faruqui etal., 2010). Pre-paid electricity programs are closely related to such information provisionprograms because rich information such as electricity prices, real time consumption and expectedconsumption is usually provided to pre-paid electricity customers, hence it is essential to3
understand whether observed reduction in consumption (if any) is driven by timely informationor from the payment procedure.Though there is lack of empirical studies that quantitatively estimate the casual impact ofpre-paid energy programs on consumer energy consumption, recently there has been an increasein the amount of qualitative studies focusing on customer and utility company satisfaction withpre-paid systems, with most of these studies focusing on overseas programs such as those inEurope, Africa and India. Anderson et al (2012) conduct a survey among 699 low-incomehouseholds in Britain and find that one of the main benefits of pre-paid electricity program is thatit gives customers better control of fuel costs and pre-paid customers are 2.6 times more likely touse energy rationally relative to others. Miyogo et al. (2013) survey pre-paid customers in Kenyaand find that pre-paid customers are more careful about their energy consumption. O'Sullivan etal. (2014) conduct qualitative survey among several pre-paid meter customers in New Zealandand find that the pre-paid systems can help households better budget and manage their energyuse though increased information feedback. On the other hand, consumers incur inconvenienceto purchase the electricity every time when they need to charge their pre-paid card (in some ofthe systems consumers need to go to a Kiosk to charge their pre-paid card) as well as the worriesand cost of being disconnected when the pre-paid card runs out (Tewari and Shah, 2003;O'Sullivan et al., 2014). The benefits of pre-paid systems to the utilities includes reduction ofenergy lost through theft resulted from illegal connections, reduction of fraud or non-payment ofbills, and reduced financial risks from arrearage (Tewari and Shah, 2003; Bandyopadhyay, 2008;Khan et al., 2010; Ogujor and Otasowie, 2010; Mwaura, 2012). Casarin and Nicollier (2009)conduct a cost-benefit analysis of the adoption of pre-paid meters in a local community inArgentina and find that prepaid meters lead to an increase in welfare.4
This paper first demonstrates using basic economic theory that there are four possiblechannels via which a pre-paid plan leads to electricity consumption reduction: nudging, priceeffects, information provision, and costs of being disconnected. Then, using customer levelresidential billing data from 2008-2010 obtained from SRP, this study adopts a matchingapproach and a difference-in-differences method to estimate empirically the impact of a pre-paidelectricity plan on residential electricity consumption while correcting for selection bias. We findthat the pre-paid program is associated with 12% reduction in electricity consumption. We alsoexplore the heterogeneity in the response to pre-paid electricity pricing by wealth level. Usingarrear amount as a proxy for wealth level, we find that customers with lower level of wealth tendto experience greater electricity reduction after the switch. In addition, results show that pre-paidcustomers save more electricity in the summer than winter, which has important implication formanaging peak demand and load shape for utility companies since summer is when system peakdemand usually happens.The remainder of this paper is organized as following. Section 2 provides background toSRP’s pre-paid electricity program. Section 3 presents the theoretical framework. Section 4describes the empirical strategy and study design. Section 5 discusses the data. Section 6contains econometric models and estimation results. Section 7 conducts robustness checks.Section 8 derives welfare and policy implications and Section 9 concludes.2. SRP’s pre-paid electricity program – M-Power programSRP’s pre-paid electricity program is commonly known as the M-Power program. When acustomer initiates the M-power service, specific smart grid meter and User Display Terminals(UDT) will be installed at the customer’s home. The customer will also be given the Smart5
Cards which are unique to the customer’s account. To add money to the Smart Card, customersneed to go to a SRP PayCenter. By 2014, there are more than 110 PayCenters for the pre-paidcard across SRP service territory. If the SmartCard runs out of money, the customer’s electricitywill be disconnected. Customers need to charge the Smart Card before it runs out of money inorder to stay connected.The UDT provides valuable information about a customer’s energy consumption,including the current rate per hour displayed as dollars/hour based on the amount of electricityused in the previous hour, the rate charged displaying as a kWh rate, an estimate of today’selectricity cost, yesterday’s cost, estimated cost of the current month, cost of last month, anestimated number of days of service remaining with the current credit and the remaining credit(EPRI, 2010b). The UDT also gives warning signals when the customer’s account balance isbelow 10.SPR has conducted customer survey among its M-Power users. About 84 percent ofcustomers reported that they are either ‘‘very satisfied’’ or ‘‘satisfied’ with the program. About95 percent of customers reported that they have had better control of their electricity use.3. Theoretical frameworkThe energy savings from a pre-paid program come from two distinct features of the program:information feedback from in-home displays (IHDs) and the prepay mechanism. Faruqui et al.(2010) finds that IHDs alone reduce energy consumption by about 7% while when combinedwith pre-paid mechanism, the amount of energy reduction is twice as much. Pre-pay with IHDversus post-pay options can influence consumers’ electricity consumption behavior through fourpossible mechanisms: nudging, price effects, information provision, and costs of being6
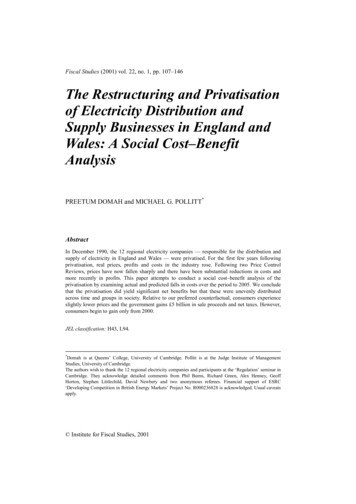
disconnected. The directional impacts of these four mechanisms on electricity usage can beexplained via simple models based on consumer theory.If electricity is pre-paid, then it is similar to other consumption goods (e.g. food) that arepre-paid or pay-as-you-go. The consumer utility maximization problem for pre-paid electricityis then the standard one in the textbook.Pre-paid scenario model set up:Assume there are only two goods: x and y, where x is electricity; y is a composite of allother goods (spot transactions are assumed for y). Consumer’s utility function is 𝑢(𝑥, 𝑦) with𝑢(𝑥, 𝑦) being strictly increasing and concave in both goods. Price of x is p. Price of y isnormalized to one. I is the disposable income. We also assume that the price of electricity isconstant and known by consumers.max 𝑢(𝑥, 𝑦)𝑥,𝑦𝑠. 𝑡. 𝑝𝑝 𝑦 𝐼x𝑎𝑎𝑎 𝑥 𝐸EuIyFigure 1. Utility maximization problem for pre-paid customers(without considering cost of pre-paid program)The second constraint 𝑥 𝐸 comes from the fact that electricity consumption is throughhousehold appliance stock. In the short run when the appliance stock is constant, households7
cannot consume electricty more than the capacity of the appliance stock. Figure 1 visualizes theutility maximization problem for pre-paid electricity customers.3.1 Nudging on budgeting electricity consumptionThe average monthly electricity bill in United States in 2012 is 107.28 (EIA, 2012). Accordingto the 2012 consumer expenditure survey, average annual household expenditure is 51,442 in2012(BLS, 2012), making electricity spending only 2.5% of total expenditure.Given thatelectricity spending is only a small portion of the overall household expenditure and the fact thatconventionally electricity is post-paid on a monthly basis, households are less trained at trackingand budgeting their electricity expenditure (Smith, 2010; O'Sullivan et al., 2014) and customerssometimes over consume energy and experience “bill shock” (Anderson et al., 2012). This is alsorelated to the “inattention” on energy costs as discussed in Allcott (2011a) and Allcott andGreenstone (2012).Let’s assume an extreme case where the household completely forgets to budget itselectricity expenditure, then the utility maximization problem becomes the following, assumingthat households have some other means (e.g. through endowment) to cover for the electricity costor incur arrearage when they receive that bill with a surprisingly high amount due.max 𝑢(𝑥, 𝑦)𝑠. 𝑡. 𝑦 𝐼 𝑎𝑎𝑎 𝑥 𝐸𝑥,𝑦The red lines in Figure 2 show the budget constraint and the utility maximization problemfor such post-pay customers. The red utility curve intersects with the appliance stock constraintat x E.8
ExuyIFigure 2. Utility maximization problem for post-pay customers(ignoring budgeting electricity expenditure)In this case consumers will consume more electricty (at the level of E) than the pre-paidcase. Pre-paid scheme can nudge households to better budget electricity every month becauseconsumers are more frequently reminded of the electricity expenditure and consumers need topay before they can consume electricity.3.2 Price effectsNow we assume that consumers do budget their electricity expenditure in a post-pay scheme.Because electricity payment occurs at the end of the period after consumption has already takenplace, this expenditure will be discounted when households optimize their consumptionproblem. 5 Even though one month is relatively short and the relevant interest rate might be low,existing literature has shown evidence that people are present bias where they discount outcomesin near future more than for outcomes in the far future, which is referred to as hyperbolicdiscounting (Frederick et al., 2002). Assuming that the discount factor is β with β 1.5Given that payment can be delayed to the end of the period in the post-pay scheme, any agent that discounts futurecash flow would view deferred payment at today’s price as a discount to the price.9
max 𝑢(𝑥, 𝑦)𝑥,𝑦𝑠. 𝑡. 𝛽𝛽𝛽 𝑦 𝐼𝑎𝑎𝑎 𝑥 𝐸In a post-pay scheme, the price of electricty will be discounted and thus through bothsubstitution and income effects, consumption of electricity will be increased. The tangent pointof the red lines in Figure 3 indicates the solution to the utility maximization problem for post-paycustomers who discount future cashflows. The new budget constraint is more steep and the newbudget constraint is tangent to the the utility curve at a higher value of x.xEuIyFigure 3. Utility maximization problem for post-pay customers(with discount factor)The fact that pre-paid program should reduce consumption relative to post-paid schemecan also be viewed as who gets to enjoy the time value of money for the amount due on theelectricity. In the post-paid scheme, the consumers enjoy it while pay-as-you-go transfers thatsurplus to the electricity providers. So although pay-as-you-go can be environmental friendly andenhance energy savings, it also has a negative impact to the consumers welfare as it in effectreduces their budget constraint and hence their individual utility.3.3 Information provision10
Again we assume that a household does budget its electricity consumption in a post-pay scheme.In a post-pay scheme, the household only finds out its consumption level after it has alreadyconsumed the electricity with a delay between consumption and bill arrival. In a pre-paidscheme, the household can monitor its electricity consumption in real time by reading thebalance of its pre-paid meter. In addition, the inconvenience of being disconnected forces thehousehold to pay more attention to electricity consumption as well as the remaining balance ofits pre-paid meter (O'Sullivan et al., 2014). Thus in the pre-paid scheme, consumers canaccurately budget their electricity consumption while in the post-pay scheme, consumers need toform an expectation (which can often deviate from realization) of their electricity consumptionof the month.Assume that the consumer-estimated amount of electricity consumption in the post-payscheme is 𝑥 and 𝑥 𝑥 𝜀, where 𝑥 is the true level of consumption while 𝜀 is the bias betweenthe estimate and true consumption. Then consumer’s problem becomesmax𝑥,𝑦 𝑢(𝑥, 𝑦)𝑠. 𝑡. 𝑝𝑥 𝑦 𝐼𝑎𝑎𝑎 𝑥 𝐸In this case the budget constraint is equivalent to 𝑝𝑝 𝑦 𝐼 𝑝𝑝 and thus theinformation uncertainty essentially translates into an income effect. If 𝜀 0 meaning that theagent under-estimates his electricity consumption, it is equivalent to having an increase in thebudget constraint. Thus consumers will consume more electricity than the pre-paid case. The redlines in Figure 4a show the budget constraint and the utility maximization problem for such postpay customers. The new budget constraint shift outwards and it is tangent to the utility curve at ahigher value of x.11
xEuyIFigure 4a. Utility maximization problem for post-pay customers(under-estimate their electricity consumption)If 𝜀 0 meaning that the agent over-estimates his electricity consumption, it isequivalent to having a decrease in the budget constraint. Thus consumers will consume lesselectricity than the pre-paid case. The tangent point of the red lines in Figure 4b shows thesolution to the utility maximization problem for such post-pay customers. The new budgetconstraint shift inwards and it is tangent to the utility curve at a lower value of x.xEuIyFigure 4b. Utility maximization problem for post-pay customers(over-estimate their electricity consumption)Thus through the information provision mechanisms, pre-paid programs can eitherincrease or decrease electricity consumption compared to a post-pay scheme.12
3.4 Costs of being disconnectedIn a pre-paid program, once the credit is used up, electricity would be disconnected and the agentwould incur disutility from the disconnection. In addition, in most existing pre-paid systems,customers need to go to designated locations to charge their pre-paid card and thus incur furthercost (time and travel). To capture these effects from disconnection, we add a cost component Cinto the budget constraint.max 𝑢(𝑥, 𝑦)𝑥,𝑦𝑠. 𝑡. 𝑝𝑝 𝑦 𝐶 𝐼𝑎𝑎𝑎 𝑥 𝐸This is equivalent to have a decreased budget constraint and thus consumption ofelectricity will be reduced. The tangent point of the green lines in Figure 5 shows the solution tothe utility maximization problem for such pre-paid customers while incorporating this extra cost.Figure 5 shows that in this case, the budget constraint shifts inwards and is tangent to the utilitycurve at a lower value of x.xEuIyFigure 5. Utility maximization problem for pre-paid customers(with extra cost of pre-paid program)4. Empirical strategy and study design4.1 Empirical strategy13
The standard residential price plan is called E-23 plan for SRP customers. In this study, weestimate the casual impact on electricity consumption of switching to M-power (the prepaid plan)from the standard residential price plan. However, M-Power is a voluntary plan and there will beselection-bias issues. Un-observable factors such as household budgeting skills, ability to reduceenergy consumption, and willingness to be more conscious about energy consumption can affectboth the participation of pre-paid program and electricity consumption. For example, participantsof the pre-paid program could be those that have poorer household budgeting skills in the firstplace and even if they switched to the pre-paid program, they still can’t manage their energyexpenditure better, which will lead to an under-estimate of the treatment effects. It is alsopossible that households that are willing to switch to the pre-paid program might be those thathave better ability to reduce their energy consumption because they have fewer people in thehousehold, which will lead to an over-estimate of the treatment effects. It is also possible thatconsumers who are more conscious about their energy consumption want to switch to the prepaid program, which again will lead to an over-estimate of the treatment effects.In order to eliminate the selection bias and to estimate the causal impact, we apply acombination of matching and difference-in-differences (DID) approaches. Fowlie et al. (2012)use a similar matching and DID approach to analyze emission trading programs. Matchingmethods select a control group that is as similar to the treatment group as possible prior to thetreatment (Fowlie et al., 2012), which is referred to as a Nonequivalent Control Group Design(Campbell & Stanley, 1963). The Electric Power Research Institute (EPRI) Research Protocol(EPRI, 2010a) states that “the objective of this approach is to create a non-equivalent controlgroup that is as similar as possible to the treatment group formed by volunteer participants.”14
In the case of voluntary program participation, researchers can implement a matchingmethod if the following three assumptions hold: 1) each observation has independent andidentical distribution (i.i.d. sample); 2) if conditional on the observed control variables, theparticipation and the outcome variables are independent or that only observable factors influenceparticipation and the outcome variables simultaneously, the so-called selection on observables(Conditional Independence or CIA); 3) given a level of the observed control variables, theprobability of a subject participating in the program is between zero and one (Common Supportor CS). In a case where selection is based on unobservable attributes, (meaning that assumption 2is violated), researchers can implement a combination of matching and difference-in-differences(DID) estimator such as panel regressions (which includes flexible fixed effects to eliminate theunobservable factors).In this study, Assumptions 1 and 3 can be justified to hold: conditional on theobservables, each residential customer is likely to be independent of each other and has a similardistribution of energy consumption (Assumption 1); given a level of the key observableattributes – location, arrearage amount and energy consumption stratum – there are bothcustomers that volunteered to participate in the pre-paid program and customers that did not(Assumption 3). Assumption 2 is harder to justify and also generally not testable, so we apply aDID approach.Exact matching is not always feasible. Inexact matching requires a measure of “distance”between any two observations, i and j. This proposal adopts Euclidian-type distance matching(Rosenbaum and Rubin 1983). Euclidian-type distance matching is to find a control householdthat has the shortest distance with the treatment household where the distance is dij (xi-xj)’ W (xixj) and x is a vector of observed attributes prior to the start of treatment and W is a weight15
matrix. Different matching algorithms including single nearest neighbor, k-nearest neighbor andkernel matching were tried to find the optimal control group.We also checked the balancing statistics of the matching results. In order to have validestimates on the treatment effects using the matching approach, it is important to ensure that thetreatment group and control group are indeed comparable on pre-treatment attributes. This iscalled balancing of groups. Two important balancing statistics are used to test the sampleequivalence: standardized mean difference (SMD) to check for sample means and variance ratios(VRs) to check for distribution and higher-order sample moments (Linden and Samuels, 2013).SMD for a given attribute Xj is defined as𝑠𝑠𝑠𝑗 𝑋 𝑗𝑗 𝑋 𝑗𝑗 (𝑆𝑗𝑗 )2 (𝑆𝑗𝑗 )2,2where the numerator is the absolute difference in average Xj between the treatment and controlgroups (subscripts T and C, respectively); the denominator is the average standard deviation ofthe two groups. Although there is no empirical evidence in the literature on using which cut-offpoint to define balance, Normand et al. (2001) suggest that if SMD is greater than 0.1 andRubin(2001) suggest that if SMD is greater than 0.25, then it implies that treatment and controlgroups are not balanced in means.VR for a given attribute Xj is defined as(𝑆)2𝑉𝑉𝑗 (𝑆𝑗𝑗 )2𝑗𝑗16,
where 𝑆𝑗𝑗 is the standard deviation of Xj in the treatment group and 𝑆𝑗𝑗 is the standard deviationof Xj in the control group. Rubin suggests that if VR is greater than 2 or less than 0.5, it impliesimbalance of the distribution of the two groups.4.2 Study designThe general study design is summarized in Table 1. Summer and winter studies are separate. Forthe summer study, the treatment group customers are those who switched to the pre-paidprogram between November 2008 and April 2009. The pre-test period is May 2008 to Oct 2008and the post-test period is May 2009 to Oct 2009. For the winter study, the treatment groupcustomers are those who switched to the pre-paid program between May 2009 and Oct 2009. Thepre-test period is Nov 2008 to April 2009 and the post-test period is Nov 2009 to April 2010. Insert Table 1 here Customers’ meter reading dates can change after they switch to the pre-paid program,which could potentially affect the evaluation. For example, before the switch, the meter readingdate of a customer could be on the 1st of each month while after the switch, the reading datecould be 15th. Energy consumption pattern can change within 15 days because of variation inweathers within 15 days. Thus we filtered the pre-paid customers to only include those whosepost-test meter reading dates are within /- 7 days of the pre-test dates.The pre-test period customer level attributes are used for matching. For a pre-paidcustomer, a control customer who is located in the same city, zip code and street and that has themost similar pre-test energy consumption level as the treatment customer is identified.17
5. DataThere are 363 pairs of control and treatment customers for the summer study and 1,278 pairs forthe winter study. Table 2 shows the summary statistics of the energy usage for the pre-paidcustomers and their control customers as well as the balance check results for sampleequivalence. For the summer study, before the treatment customers switched to the pre-paidprogram, the treatment and control customers had similar daily energy usage levels of about57 58 kWh. After the switch, the energy usage level of control customers stayed the same atabout 58 kWh while the treatment customers dropped their energy usage to 52 kWh. Similarly,for the winter study, the treatment and control customers had similar energy usage levels beforethe switch while after the switch the treatment customers dropped their energy usage whilecontrol customers’ stayed the same. Insert Table 2 here The balancing statistics SDM is 0.05 for the summer study and 0.01 for the winter study,with both below 0.1, which suggests that the control and treatment groups are equivalent in termsof sample means. The statistics VR is 1.26 for the summer study and 1.25 for the winter study,with both below 2 and greater than 0.25, which suggests that the sample distribution betweencontrol and treatment groups are also equivalent.18
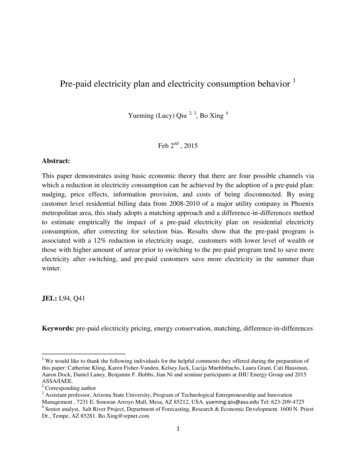
Figure 6. Distribution of the distance (in miles) between a pair of control and treatment customerFigure 6 shows the distribution of the distance (in miles) between a pair of control andtreatment customer. Most control customers are located within 1 miles of distance to theirtreatment customers and this can ensure the elimination of complicating factors from being indifferent neighborhoods.6. ResultsWe first conduct statistical two sample test to evaluate whether there are statistically significantdifferences between the control and treatment groups in their post- and pre- test electricityconsumption. Table 3 lists the results. The left hand side column of Table 3 uses the traditionalsubtraction DID method, which means testing Tpost-Tpre Cpost-Cpre. Tpost is the outcome variable(e.g. energy consumption) of the treatment group after the treatment and Tpre is the outcomevariable of the treatment group prior to the treatment. Similarly, Cpost is the outcome variable(e.g. energy consumption) of the control group after the treatment and Cpre is the outcomevariable of the control group prior to the treatment. Traditional subtraction DID estimator of the19
treatment effect is 𝛽̂ 𝐷𝐷𝐷 (Tpost Tpre ) (Cpost Cpre ) . The right hand side column usesthe percentage DID method, which means testing Tpost/Tpre Cpost/Cpre. We also conduct thepercentage method because this ensures that every customer in the small samples has equalimpact in the energy analyses. Insert Table 3 here We co
Miyogo et al. (2013) survey pre-paid customers in Kenya and find that pre-paid customers are more careful about their energy consumption. O'Sullivan et al. (2014conduct qualitative survey among several pre) -paid meter customers in New Zealand and find that the pre-paid systems can help households better budget and manage their energy