Transcription
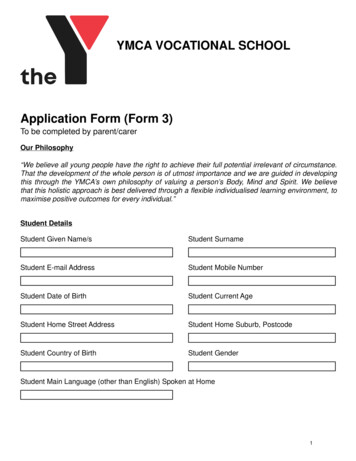
Name: Date: Class:Student Activity GuideImage Source:Wikimedia Commons: Wrist Pulse ist-oximeter.jpgImage Source: Miguel Ramirez - PPG Pulses DatabaseThe purpose of this activity is to find a mathematical function that fits your photoplethysmogram (PPG). Youwill obtain your personal PPG using digital pulse oximeters. The graph of the pulse obtained with the pulseoximeters will be inserted in a Graphical User Interface (GUI) developed in Excel. In this GUI, you will fit yourPPG graph in a harmonic function obtained by adding several trigonometric functions, specifically sine functionswith different amplitudes and frequencies. Once you obtain the best fitting harmonic function—reading somevalues on this function—you will obtain your own personalized cardiovascular information such as pulseinterval, cardiac period, and systolic and diastolic phases. Students with a background in calculus will be able tofind additional information as arterial stiffness and vascular age.By the end of this activity you will:After this activity, students should be able to: Understand how a photoplethysmogram (PPG) analyzes and outputs information. Use a digital pulse oximeter. Identify important cardiovascular information contained in a PPG graph. Learn that a superposition of basic trigonometric functions like sines and cosines can be used to describe a morecomplex periodic function.Activity Guidelines1. Choose a partner to work with.2. Each group will need the next materials: CONTEC CMS 50D Digital Pulse Oximeter with USB cable computer with Windows OS with the Snipping Tool extension installed Excel and pulse oximeter software interface installed in computer Excel GUI for PPG pulse analysis spreadsheet laser printer, PowerPoint or Google Slides for poster or presentation creation3. With the digital pulse oximeter connected to the computer and the software interface detecting the pulseoximeter signal, every student can obtain their PPG. Capture your PPG, which is displayed in the pulseoximeter software interface, with the Snipping Tool. Save this file.4. Open the Excel GUI. Save a copy with your name. In worksheet PPG-Graph, insert the saved file from aboveas background of the graphing region.5. By modifying the values in the cells at the left of the graph, try to fit the blue line to match your PPG. Youhave to set the values for the first two harmonics, H.1 and H.2. Including more harmonics may improve thematch.Trigonometric Functions in My Heart Activity – Student Activity Guide1
Name: Date: Class:6. Once you obtain the best function that approximates your PPG, write your function in the box at the bottomof the worksheet. Use the equation editor to type your function.7. Go to worksheet Cardiovascular Analysis. On the graph, locate the values for the information displayed onthe image at the right by carefully placing the cursor on your function’s graph. Annotate the values found inthe boxes below.8. Decide with your teacher how you are going to present your results, whether that be an in-classpresentation, a poster session, or video presentation. For any of these options, you will have to create aposter as support. Use PowerPoint or Google Slides to create the poster. Each student should present theirpersonal results.9. For students with a background in calculus: In worksheet Cardio-Calculus-Analysis, analyze the secondderivative of your function to obtain additional information from your PPG. Use the graphs at the right toidentify the points on your graph. Write down those values. Perform the calculations in the listed formulasfor arterial stiffness, vascular aging, and vascular age. Annotate the values in the corresponding boxes belowthe second derivative graph.Poster-Presentation Content ChecklistPoints1. Title of the project, and student’s names52. Description and purpose of the project53. Background of your activity154. Steps or process followed to find your function. Include PPG graph205. Obtained function(s) and its(their) graph(s)206. Summary of the cardiovascular information obtained57. Conclusions5EvaluationTotal Points:Results Presentation ChecklistPoints8. Information clearly written and well organized109. Clear and concise explanation of the work done1010. Creativity5EvaluationTotal Points:Trigonometric Functions in My Heart Activity – Student Activity Guide2
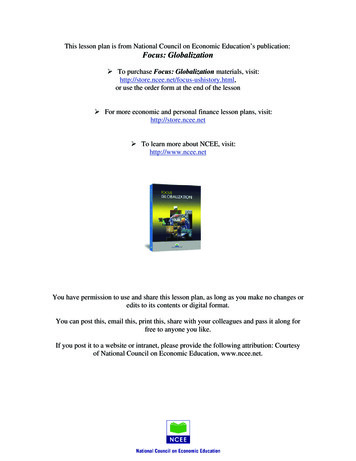
Name: Date: Class:Notes: This project is a major grade for this grading period Find videos for this activity background athttps://www.sophia.org/tutorials/heart-ecg-ppg You will have to obtain your PPG pulse. The results presentation or submission dates willbe set up during these work sessions.Image Source: Miguel Ramirez - CONTEC CMS 50D Digital Pulse Oximeter with USB cableTrigonometric Functions in My Heart Activity – Student Activity Guide3
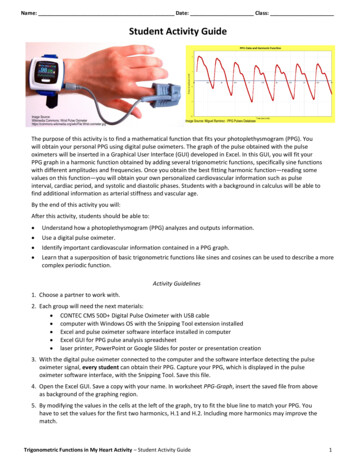
Name: Date: Class:Annex 1. Pulse Oximeter and Software InterfaceFollow the next steps to obtain the graph of your photoplethysmogram (PPG).1. Connect the USB cable to the CMS 50D pulseoximeter into a USB port.4. Click the connection button. On the Deviceswindow select the port the pulse oximeter isconnected to, and click the “Connect” button.2. Insert a finger in the pulse oximeter. Turn on thedevice and wait until you obtain a reading.Configure the pulse oximeter to display the PPGby pressing the little white button.5. Let the SpO2 assistant window display a full andstable pulse. On the main menu click Edit - Freeze Wave.3. Open the pulse oximeter interface SpO2 Assistant.6. Open Snipping Tool, capture the frozen pulse, and saveTrigonometric Functions in My Heart Activity – Student Activity Guide4
Name: Date: Class:Annex 2. Pulse Analysis using the Excel Graphic User Interface (GUI)Follow the next instructions to analyze your PPG.1. Look for the file PPG-GUI.xls. You should open the GUI on the worksheet PPG-Graph.2. Important: Save a copy of this GUI. Use your name as the new file’s name.3. Insert your PPG pulse as background of the graphing region. To do this, follow the next steps.(a). Click on the graph region(b). Press mouse right button(c). On the displayed menu select Format Plot Area Trigonometric Functions in My Heart Activity – Student Activity Guide5
Name: Date: Class:(d). On the Format Plot Area expand FILL(e). Click on Picture or Texture Fill button(f). Click on button Yes(g). On the expanded menuInsert picture from,click the File button(h). In the open Insert Picture window select your saved PPG file and press InsertTrigonometric Functions in My Heart Activity – Student Activity Guide6
Name: Date: Class:The graphing window is ready for you (4). To overlap the best possible both lines consider the next tips.(a). First modify the frequency ω. Find the value that makes the distance between maximums the same for both lines(b). Next modify shift c1 of first harmonic H.1. Find the value that makes the maximums of both lines more or lessmatch(c). Modify the values ω and c1 until you get the best match possible. Modify the value of the amplitude A1 for the firstharmonic H.1, until the heights of both pulses match. It is possible that you have also to modify a little the value ofthe vertical shift h.Trigonometric Functions in My Heart Activity – Student Activity Guide7
Name: Date: Class:(d). Give a value to the amplitude A2 of the second harmonic H.2. Try values less than half of A1.(e). Try now values for the shift phase c2 for harmonic H.2. Try positives and negatives until get the best match.(f). It is important to modify a little these six parameters in order to achieve the best fit of these two curves. This is a guessand check, modify and see process that requires some patience. Keep a written record of the values producing a good fit.(Don’t forget to save your file frequently!)(g). A better match between these curves can achieved using more harmonics. Proceed in the same way as above. Give a valueto the amplitude A3 of the third harmonic H.3, less than half the value of A.2.Trigonometric Functions in My Heart Activity – Student Activity Guide8
Name: Date: Class:(h). Give a value to the shift phase c3 of harmonic H.3. Try again positive and negative values until you get the best fit.(i). Modify the eight parameters used until now, looking for the best possible fit. This will require more time and patiencebut you can find a good match. Repeat the above process for an additional harmonic. You can add up to five harmonics inthis GUI. Here is a match with four harmonics.Be patient and good luck!Trigonometric Functions in My Heart Activity – Student Activity Guide9
Name: Date: Class:Annex 3. Reading Values on the Graphs.Read the values for the obtained function on the graph in worksheet Cardiovascular Analysis. This is an easy taskthat only requires a firm hand on the computer’s mouse. After selecting the graph, you have only to carefully placethe mouse pointer on the graph line and the software will display the corresponding coordinates for that point.Students with a background in calculus will use the same procedure to find the coordinates of points on curves inworksheet Cardio Calculus-Analysis.Trigonometric Functions in My Heart Activity – Student Activity Guide10
Name: Date: Class:Trigonometric Functions in My Heart Activity – Student Activity Guide11
Name: Date: Class:Trigonometric Functions in My Heart Activity – Student Activity Guide12
3. With the digital pulse oximeter connected to the computer and the software interface detecting the pulse oximeter signal, every student can obtain their PPG. Capture your PPG, which is displayed in the pulse oximeter software interface, with the Snipping Tool. Save this file. 4. Open the Excel GUI. Save a copy with your name.