Transcription
CattleISSN: 1948-9099Released July 23, 2021, by the National Agricultural Statistics Service (NASS), Agricultural Statistics Board, United States Department ofAgriculture (USDA).July 1 Cattle Inventory Down 1 PercentAll cattle and calves in the United States on July 1, 2021 totaled 101 million head, 1 percent below the 102 million headon July 1, 2020.All cows and heifers that have calved totaled 40.9 million head, 1 percent below the 41.4 million head on July 1, 2020.Beef cows, at 31.4 million head, down 2 percent from a year ago. Milk cows, at 9.50 million head, up 2 percent fromprevious year.All heifers 500 pounds and over on July 1, 2021 totaled 16.0 million head, 1 percent below the 16.2 million head onJuly 1, 2020. Beef replacement heifers, at 4.30 million head, down 2 percent from a year ago. Milk replacement heifers, at4.10 million head, up 3 percent from previous year. Other heifers, at 7.60 million head, 3 percent below a year earlier.Steers 500 pounds and over on July 1, 2021 totaled 14.5 million head, down 1 percent from July 1, 2020.Bulls 500 pounds and over on July 1, 2021 totaled 2.10 million head, unchanged from previous year.Calves under 500 pounds on July 1, 2021 totaled 27.4 million head, down 1 percent from a year earlier.Cattle and calves on feed for the slaughter market in the United States for all feedlots totaled 13.4 million head onJuly 1, 2021, down 1 percent from previous year. Cattle on feed in feedlots with capacity of 1,000 or more head accountedfor 84.3 percent of the total cattle on feed on July 1, 2021, up slightly from previous year. The total of calves under 500pounds and other heifers and steers over 500 pounds (outside of feedlots), at 36.1 million head, down 2 percent from the36.7 million head on July 1, 2020.Calf Crop Down SlightlyThe 2021 calf crop in the United States is expected to be 35.1 million head, down slightly from last year. Calves bornduring the first half of 2021 are estimated at 25.8 million head, up slightly from the first half of 2020. An additional9.30 million calves are expected to be born during the second half of 2021.
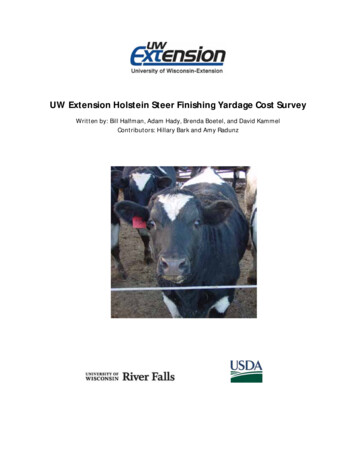
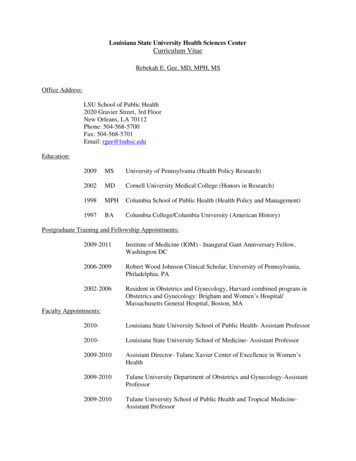
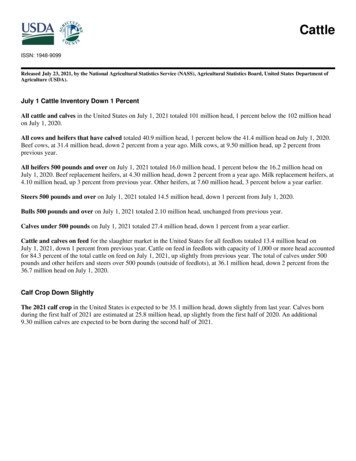
Cattle Inventory – United States: July 1Million head1141091049994199620012006201120162021The July Cattle report was suspended in 2013 and 2016 due to sequestration.This report was approved on July 23, 2021.Secretary of AgricultureDesignateSeth Meyer2Agricultural Statistics BoardChairpersonJoseph L. ParsonsCattle (July 2021)USDA, National Agricultural Statistics Service
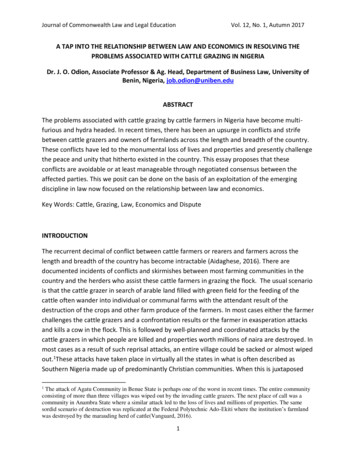
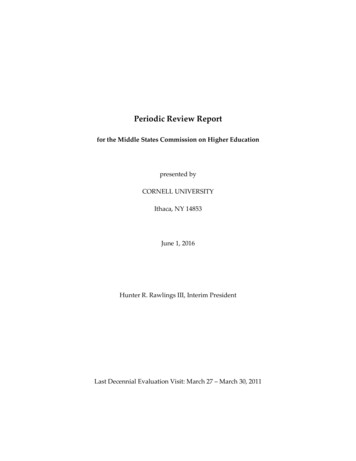
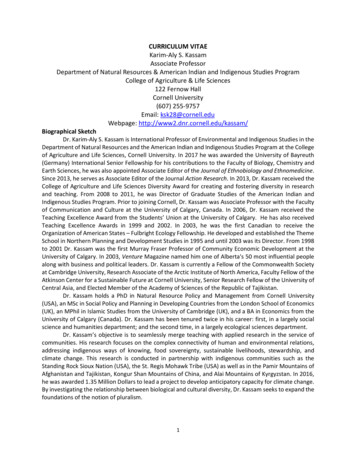
Cattle Inventory by Class and Calf Crop – United States: July 1, 2020 and 202120202021Percent ofprevious year(1,000 head)(1,000 head)(percent)ClassCattle and calves .102,200.0100,900.099Cows and heifers that have calved .Beef cows .Milk cows 8102Heifers 500 pounds and over .For beef cow replacement .For milk cow replacement .Other heifers .07,600.0999810397Steers 500 pounds and over .Bulls 500 pounds and over .Calves under 500 pounds 0099Cattle on feed .13,600.013,400.099Calf crop .35,135.535,100.0100Calf Crop and Percent of Total by Six-Month Period – United States: 2020 and Preliminary 20212020Period2021NumberPercent oftotal(1,000 head)(percent)NumberPercent oftotal(1,000 head)(percent)January 1 - June 30 .July 1 - December 31 al .35,135.5100.035,100.0100.0Beef Cow Inventory – United States: July 1Million head3735333129199620012006201120162021The July Cattle report was suspended in 2013 and 2016 due to sequestration.Cattle (July 2021)USDA, National Agricultural Statistics Service3
Statistical MethodologySurvey Procedures: A random sample of United States producers were surveyed to provide data for these estimates.Survey procedures ensured that all cattle producers, regardless of size, had a chance to be included in the survey. Duringthe first half of June, a probability area frame survey was conducted with a sample of approximately 9,100 segments orparcels of land. Data collected during the June Area Survey were used from cattle operations not on the list frame. DuringJuly, a probability list frame survey with a sample of approximately 16,000 producers and feedlots was conducted. Theseoperations were contacted during the first half of July by mail, telephone, and internet, and the response rate was55 percent. Operators were asked to report inventories as of the first of the month and calf crop for the entire year of 2021.Estimating Procedures: These cattle estimates were prepared by the Agricultural Statistics Board after reviewingNational indications and analysis. National survey data was reviewed for reasonableness with estimates from the previousyear using a balance sheet. The balance sheet begins with the previous inventory estimate, adds to it estimates of birthsand imports for the first six months, and subtracts estimates of slaughter, exports, and deaths for the first six months of thecurrent year. This indicated ending inventory level is compared to the Agricultural Statistics Board estimate forreasonableness. Class estimates are rounded to the nearest 100,000 head with the exception of beef and milk cows whichare rounded to the nearest 50,000 head.Revision Policy: Revisions to previous estimates are made to improve year to year and item to item relationships.Estimates for the previous year are subject to revision when current estimates are made and when the January 1 cattleinventory estimates are made. The revisions are primarily based on livestock slaughter and additional foreign trade andsurvey data. Estimates will also be reviewed after data from the five-year Census of Agriculture are available. Norevisions will be made after that date.Reliability: Since all cattle operators are not included in the sample, survey estimates are subject to sampling variability.Survey results are also subject to non-sampling errors such as omissions, duplications, and mistakes in reporting,recording, and processing the data. The effects of these errors cannot be measured directly. They are minimized throughrigid quality controls in the data collection process and through a careful review of all reported data for consistency andreasonableness.To assist users in evaluating the reliability of estimates in this report, the "Root Mean Square Error" is shown forselected items in the following table. The "Root Mean Square Error" is a statistical measure based on past performanceand is computed using the differences between first and latest estimates. The "Root Mean Square Error" for July cattleinventory estimates over the past 10 years is 0.4 percent. This means that chances are 2 out of 3 that the final estimate willnot be above or below the current estimate of 101 million head by more than 0.4 percent. Chances are 9 out of 10 that thedifference will not exceed 0.8 percent.The table on the following page shows a 10 year record of the range of differences between first and latest estimates forselected items. Using estimates of all cattle and calves as an example, changes between the first inventory estimate and thelatest estimate during the past 10 years have averaged 360,000 head, ranging from 0 to 800,000 head. During this periodthe initial inventory estimate has been below the latest estimate 3 times and has been above the latest estimate 5 times.This does not imply that the July 1 estimate is likely to understate or overstate final inventory.4Cattle (July 2021)USDA, National Agricultural Statistics Service
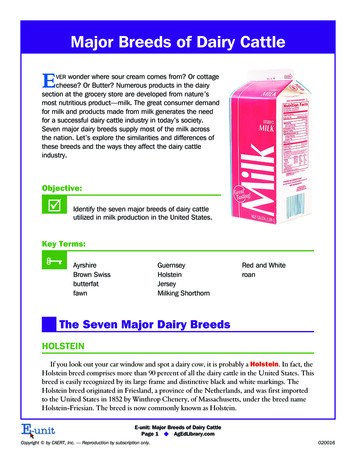
Reliability of July 1 Cattle Estimates[Based on data from the past 10 years]ItemRoot meansquare error(percent)90 percentconfidencelevel(percent)Difference between first and latest d)(1,000head)YearsBelow latestAbove latest(number)(number)All cattle and calves .0.40.8360080035All cows and heifers that have calved .0.30.680040014Calf crop .1.12.028920708010Information ContactsListed below are the commodity specialists in the Livestock Branch of the National Agricultural Statistics Service tocontact for additional information. E-mail inquiries may be sent to nass@usda.gov.Travis Averill, Chief, Livestock Branch . (202) 692-0069Scott Hollis, Head, Livestock Section . (202) 690-2424Sherry Bertramsen – Livestock Slaughter . (202) 690-8632Ryan Cowen – Cattle, Cattle on Feed . (202) 720-3040Anthony Fischer – Hogs and Pigs . (202) 720-3106Logan Hartley-Sanguinett – Sheep and Goats . (202) 690-3236Mike Miller – Milk Production and Milk Cows . (202) 720-3278Suzanne Richards – Dairy Products . (202) 720-4448Cattle (July 2021)USDA, National Agricultural Statistics Service5
Access to NASS ReportsFor your convenience, you may access NASS reports and products the following ways: All reports are available electronically, at no cost, on the NASS web site: www.nass.usda.gov Both national and state specific reports are available via a free e-mail subscription. To set-up this freesubscription, visit www.nass.usda.gov and click on “National” or “State” in upper right corner above “search”box to create an account and select the reports you would like to receive. Cornell’s Mann Library has launched a new website housing NASS’s and other agency’s archived reports. Thenew website, https://usda.library.cornell.edu. All email subscriptions containing reports will be sent from the newwebsite, https://usda.library.cornell.edu. To continue receiving the reports via e-mail, you will have to go to thenew website, create a new account and re-subscribe to the reports. If you need instructions to set up an account orsubscribe, they are located at: https://usda.library.cornell.edu/help. You should whitelist notifications@usdaesmis.library.cornell.edu in your email client to avoid the emails going into spam/junk folders.For more information on NASS surveys and reports, call the NASS Agricultural Statistics Hotline at (800) 727-9540,7:30 a.m. to 4:00 p.m. ET, or e-mail: nass@usda.gov.The U.S. Department of Agriculture (USDA) prohibits discrimination against its customers, employees, and applicants foremployment on the basis of race, color, national origin, age, disability, sex, gender identity, religion, reprisal, and whereapplicable, political beliefs, marital status, familial or parental status, sexual orientation, or all or part of an individual'sincome is derived from any public assistance program, or protected genetic information in employment or in any programor activity conducted or funded by the Department. (Not all prohibited bases will apply to all programs and/oremployment activities.)If you wish to file a Civil Rights program complaint of discrimination, complete the USDA Program DiscriminationComplaint Form (PDF), found online at mplaint-usda-customer, orat any USDA office, or call (866) 632-9992 to request the form. You may also write a letter containing all of theinformation requested in the form. Send your completed complaint form or letter to us by mail at U.S. Department ofAgriculture, Director, Office of Adjudication, 1400 Independence Avenue, S.W., Washington, D.C. 20250-9410, by fax(202) 690-7442 or email at program.intake@usda.gov.
Using estimates of all cattle and calves as an example, changes between the first inventory estimate and the latest estimate during the past 10 years have averaged 360,000 head, ranging from 0 to 800,000 head. During this period the initial inventory estimate has been below the latest estimate 3 times and has been above the latest estimate 5 times.