Transcription
TOP PAYINGINDUSTRIES pg. 7SALARIES BY MAJORBY INDUSTRY pg. 14SALARIES BYMAJOR pg. 9Salary SurveynaceSTARTING SALARIES FOR NEW COLLEGE GRADUATESAPRIL 2012Featuring: Top Industries IndividualMajors Top Employing Industries Major by OccupationalPosition Industry Top-Paying PositionsNational Association of Colleges and Employers www.naceweb.org
Table of ContentsAbout the Survey. 3Executive Summary. 4Top-Paying Industries. 7Top-Hiring Industries. 8Starting Salary by Academic Major Bachelor’s Degrees. 9Salary Ranges Business Majors. 9Salary Ranges Engineering Majors. 11Salary Ranges Humanities Majors. 12Salary Ranges Social Sciences Majors. 13Salary Ranges Math & Science Majors. 13Top Industries for Individual Majors. 14Top Majors Within Individual Industries. 25Top Industries Top Majors. 29Major by Occupational Position Industry. 35Occupational Position by Major Industry. 46Top-Paying Positions. 49RESEARCH STAFFDirector of Foundation and Strategic Research: Edwin KocEmployment Information Manager: Andrea KonczResearch Assistant: Anna LongenbergerCopyright 2012 by the National Association of Colleges and Employers. No part of this publication may be used, adapted, or reproduced in any manner without written permission.THE NEW SALARY SURVEYSince 1960, when the first issue of Salary Survey was published, NACE has been providing informationabout salaries for new college graduates. Compiled from data provided by participating colleges anduniversities that collected the information from their graduates, the report featured starting salary offers.The Spring 2012 Salary Survey issue marks the second report using NACE’s new data collectionmethod. This new and improved report contains employer-based data gathered from government andother sources, and the data are actual starting salaries, not offers. Because the data come from astatistically valid sample of employers rather than from voluntary reports by students, the new report ismore representative of the college population as a whole; the old report was heavily weighted towardengineering, accounting, and other disciplines that traditionally receive job offers prior to graduation.The new report contains more data, and the data are more robust, allowing for additional analysis.The change in methodology and the shift from salary offer data to actual salary data necessitate twoadditional changes: First, in the past, the Winter report had been the first report for the new year’sclass. This year, the Winter 2012 report provided final salary data for the Class of 2011, and this issue, the Spring 2012 report, marks the first report for the Class of 2012. Second: Due to the seasonality of the data, the median salary values are being compared from this year to last year, as opposed tothe average salaries.2 Salary SurveyNational Association of Colleges and Employers www.naceweb.org
About the SurveyData contained in the NACE Salary Survey are produced through a compilation of data derived from the Bureauof Labor Statistics, the Census Bureau, and a master data set developed by Job Search Intelligence. Data for theSpring 2012 Salary Survey report were retrieved in February 2012, and were compiled using a proprietary methodology created by Job Search Intelligence. (Please note: Some fields include an asterisk, indicating that data arenot currently available in those instances. However, data will be available in future reports.)Salary Survey (ISSN 1520-8648) is available to individuals holding organizational membership in the NationalAssociation of Colleges and Employers; it is also available on a subscription basis. Salary Survey is published threetimes a year—January, April, and September—by the National Association of Colleges and Employers, 62 HighlandAve., Bethlehem, PA 18017-9085. For more information, see www.naceweb.org or contact NACE at 800.544.5272.HOW TO READ SALARY SURVEYStarting Salary by Academic Major.PG. 9In this section, you will find the median starting salary according to the major field of study, with no regard to thetype of position or type of employer reporting the salary. Refer to this section when you want to know the startingsalary for a graduate holding a degree in a specific discipline, such as accounting or computer science.Top Industries Individual Majors.pg. 14This section shows data first by the major field of study, then by the type of employer (industry) reporting thesalaries. Employer types are listed in descending order by number of reported new graduate entrants. Seethis section when you want the average starting salary reported by a specific type of employer to a graduateearning a degree in a specific major. This section may also be particularly helpful in examining the employertypes that hire the most new graduates of a particular major. (Example: Average salary that manufacturing firmsare reporting for electrical engineering graduates. Also, the other industries that are hiring the most electricalengineering graduates and their corresponding average salaries.)Top Majors Individual Industries.pg. 25This section contains the same basic information as “Top Industries/Individual Majors,” but in a differentorder. You will see data by a specific type of employer (industry), then according to the average salary bymajor field of study. Majors are listed in descending order by number of reported new grad entrants. Use thissection to find the average starting salary reported by a specific type of employer to a graduate in a specificmajor and to identify which majors were most hired into a specific industry. (Example: Majors hired byconstruction firms, and their corresponding average starting salaries.)Major By Occupational Position Industry. pg. 35This section shows data first by the major field of study, then according to the employers (industries) that reported specific occupational positions and their corresponding average salaries. Industries and occupational positions are both listed in alphabetical order. Use this section when you need information about the average salaryfor a graduate with a specific major for a specific occupational position. (Example: Average starting salary foran economics graduate hired in the banking industry performing as a financial manager.)Occupational Position by Major Industry.pg. 46This section contains the same information as “Major by Occupational Position/Industry,” but with the datarearranged. It first shows data by occupational position, then by the employers (industries) that hired specificmajors. Industries and majors are both listed in alphabetical order. See this section when you need to know theaverage starting salary for a specific occupational position held by a graduate with a certain major. (Example:Average starting salary for an elementary or middle school teacher, who majored in mathematics.)National Association of Colleges and Employers www.naceweb.orgSalary Survey 3
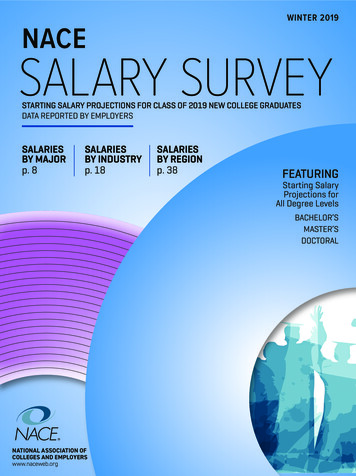
EXECUTIVE SUMMARYThe first report on starting salaries the college Class of 2012 kicks off with an increase in the average starting salary for bachelor’s degree students.Overall, the average starting salary for a Class of 2012 graduate is 44,442—a 6.6 percent increase over theaverage salary reported for the Class of 2011 in the Winter 2012 Salary Survey report. However, much of thatleap can be attributed to seasonal factors. A truer comparison can be made between median salaries for the Classof 2012 and 2011: As illustrated in Figure 1, the overall median salary for Class of 2012 grads is up 4.5 percentover the median posted for the Class of 2011. (Note: As salaries in this report have only been nominally adjustedfor seasonality, this report uses median salaries—not average salaries—for comparison purposes.)figure 1 median salaries by disciplineBroad Category2012 Median Salary2011 Median SalaryPercent ChangeBusiness 47,748 47,2821.0%Communications 40,022 38,5493.8%Computer Science 56,383 55,0872.4%Education 37,423 35,8284.5%Engineering 58,581 58,802-0.4%Health Sciences 43,477 43,802-0.7%Humanities & Social Sciences 34,789 34,6300.5%Math & Sciences 40,939 39,9282.5%Overall 42,569 40,7354.5%BUSINESSThe overall median salary for business majors as agroup is up 1 percent to 47,748. While this appearsto be a small increase, many of the individual majorsreport more substantial gains.For accounting majors, the median salary is up 2.8percent to 47,800. Top employers for accountinggrads include professional, scientific, and technicalservices (including accounting) firms, but wholesaleemployers offered top pay— 51,500 on average.Business administration/management majors also sawan increase in their starting salaries. Their mediansalary rose 2.9 percent to 49,200. Employers in thefinance and insurance industries reported the largestnumber of new grad entrants, with an average starting salary of 51,300. Highest pay, however, wentto business administration grads who landed jobs inthe finance and insurance industry; employers in thisindustry provided these grads with an average salaryof 63,900.4 Salary SurveyAmong the business disciplines, economics graduatesearn the highest starting salaries. Their medianstarting salary currently stands at 54,800, up 5.6percent over last year’s median of 51,900. Theyfound the largest number of opportunities with financeand insurance employers; their highest startingsalary— 57,000—also came from these employers.Moreover, economics grads who landed jobs asfinancial managers in the finance/insurance industrysaw their average salary top out at 64,000.Starting salaries to finance majors start the year 2.3percent higher than last year: their current median salary is 49,700. Although their overall starting salaryis lower than that of economics graduates, those whotook jobs as financial managers outpaced their counterparts, earning an average starting salary of 66,000.There is also positive news for marketing majors: Theirmedian salary is 49,600, up 3.8 percent. Those whofound jobs in the information industry did substantiallybetter, earning an average starting salary of 59,600.National Association of Colleges and Employers www.naceweb.org
figure 2 salary ranges by discipline 75,000 70,211 70,000 68,461 65,000 60,000 55,000 50,000 58,581 58,142 56,383 47,748 45,000 40,000 35,000 43,232 40,022 32,160 30,000 43,477 37,423 38,612 49,599 49,815 48,923 46,917 50,806 32,233 37,687 41,939 40,939 34,789 34,298 29,102 25,000BusinessCommunicationsComputer ScienceEducationCOMMUNICATIONSStudents graduating in the communications fields alsosaw their overall starting salary bump up. As a group,their median starting salary rose 3.8 percent and nowstands at 40,022. In this group, all majors—advertising, communications, and journalism—saw their starting salaries increase between 2 and 3 percent—butmany landed positions with more impressive startingsalaries. For example, advertising majors who tookmanagement jobs in the management sector receivedan average starting salary of 59,400.COMPUTER SCIENCESGraduates within the computer sciences fields havestarting salaries that are 2.4 percent higher this year;their overall median starting salary rose from 55,087to 56,383. Employers in the information sectorreported the highest number of new graduate entrants,with an impressive starting salary to boot— 64,400.EDUCATIONOf all the disciplines, those in the education fields sawthe highest increase to their median starting salary,which rose 4.5 percent from 35,828 to 37,423.Within this group, starting salaries are highest for special education majors; their median salary now standsat 42,200, up 2.2 percent over last year.ENGINEERINGThe overall median salary for graduates in the engineering disciplines has changed little over last year.National Association of Colleges and Employers www.naceweb.orgEngineeringHealth Sci.Humanities & Social Sci.Math & ScienceThe current median salary is 58,581, down less than1 percent from last year’s median salary of 58,802.Computer engineering grads are the highest paid ofthe engineering disciplines, with a median salary of 67,800, a 0.6 percent increase over their Class of2011 counterparts’ median salary.Right behind computer engineering graduates areaerospace engineering grads, who saw a 1.9 percent increase, bringing their median starting salaryto 64,200. The median salary for civil engineeringgraduates had similar movement, rising 1.7 percent to 55,300.Bioengineering and chemical engineering students posted identical increases (1 percent); their median startingsalaries are 41,800 and 63,000, respectively.Electrical engineering graduates saw the largestincrease of the engineering disciplines—a 2.7 percent increase, bringing their median starting salary to 57,300.The median starting salary to students majoring in mechanical engineering rose 1.6 percent and now standsat 58,600.HEALTH SCIENCESSalaries for health sciences graduates show littlemovement. Their overall median salary is down lessthan 1 percent from 43,802 to 43,477.Salary Survey 5
For nursing majors, the change is similar; their medianstarting salary rose just 0.6 percent from 48,100to 48,400. For general health and related sciencesmajors, the median starting salary rose 1.7 percent to 36,400.HUMANITIES AND SOCIAL SCIENCESFor graduates in the humanities and social sciencesfields, starting salaries have remained relatively stable.The overall median salary to the group is up 0.5percent from 34,630 to 34,789.All of the individual majors in this group posted increases to their median starting salaries, but visualand performing arts majors saw the biggest increasein this category. Their median starting salary rose 2.1percent to 34,800. However, within this group, political science majors posted the highest median salary, 38,400, a 1.3 percent increase over last year.Overall, the education services industry was thebiggest employer of humanities and social sciencesgrads (with an average starting salary of 37,800)—providing the largest number of opportunities forEnglish, foreign language, history, liberal arts,political science, and psychology majors.Criminal justice majors were most likely to be hired bygovernment employers, and social work and sociologymajors had the most new graduate entrants to the healthcare and social assistance industries. Retail trade wasthe single-biggest industry for visual and performing artsmajors, with an average salary of just 26,000.By industry, top pay for humanities and social sciencesmajors, however, came from management companies,which provided them with an average starting salary of 43,500.Among the humanities/social sciences, top pay byposition was reported for political science graduatesfor financial manager positions within the professional,scientific and technical services industry—an averageof 61,900. Next in line were visual and performingarts graduates hired by retailers for marketing or salesmanager positions; their average salary is 56,500.MATH AND SCIENCESThe overall median salary for graduates earning mathand sciences degrees has increased modestly by2.5 percent to 40,939. Within the individual fields,construction science/management graduates saw a1.9 percent increase to their median salary, bringingit to 54,700. All of their top-employing industries,construction firms, professional, scientific and technicalservices employers, and government employers reported average salaries that topped 55,000.While mathematics majors saw a 1.5 percent increase totheir median starting salary, now standing at 47,000,they also had three of their top-employing industries paying average starting salaries of more than 50,000.Overall, the first look at salaries for the Class of 2012is promising. The Fall 2012 Salary Survey, to bepublished in September, will provide the next look atsalaries for these graduates.SALARY SURVEY ONLINENew web-based tool from the NationalAssociation of Colleges and Employers.NOWBLE!ALIAVA Access national and regional salary data for new college grads on the fly Get detailed information by industry and occupation Featuring employer-reported salary data updated bimonthlyLearn More: www.naceweb.org/salary-survey-data/Salary Survey Online, available to NACE organizational members and Salary Survey subscribers, is thecompanion to the Salary Survey Report and provides users with access to more data and more-detailed data.6 Salary SurveyNational Association of Colleges and Employers www.naceweb.org
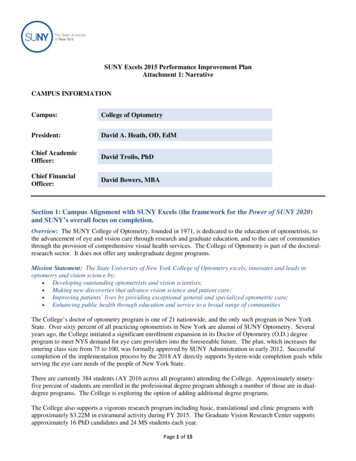
top-paying industriesThe chart below shows the top five industries that paid the highest starting salaries to 2012 bachelor’s degreegraduates, regardless of major. The number of new graduate entrants reported by each particular industry is alsolisted here.Average Starting Salary63,000 64,40057,000 54,392 53,006 51,87451,000 45,000 formationManufacturingManagementof Companiesand EnterprisesFinance &InsuranceTop-Paying Industries/Number of New Grad EntrantsINDUSTRY DEFINITIONSUtilities: The utilities sector comprises establishments engaged in the provision of the following utility services—electric power, natural gas, steam supply, water supply, and sewage removal.Information: The information sector comprises establishments engaged in the following processes: 1) producingand distributing information and cultural products, 2) providing the means to transmit or distribute these products,as well as data or communications, and 3) processing data. (Example: software publishers)Manufacturing: The manufacturing sector comprises establishments engaged in the mechanical, physical, orchemical transformation of materials, substances, or components into new products.Management of Companies and Enterprises: This sector comprises 1) establishments that hold the securities ofcompanies and enterprises for the purpose of owning a controlling interest or influencing management decisions,or 2) establishments that administer, oversee, and manage establishments of the company or enterprise.Finance & Insurance: This sector includes establishments primarily engaged in financial transactions and/or infacilitating financial transactions.Source: U.S. Census Bureau, North American Industry Classification System (NAICS), 2007. www.census.gov/eos/www/naics/National Association of Colleges and Employers www.naceweb.orgSalary Survey 7
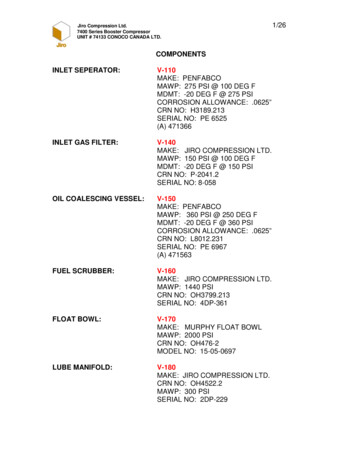
top-hiring industriesThis chart shows the top five industries that reported the highest number of new graduate entrants for 2012bachelor’s degree graduates, regardless of major. The average starting salary reported by each particularindustry is also listed here.Number of New Grad 120,000100,0000 38,329 39,512 47,880 51,110 53,006EducationalServicesHealthcare &SocialAssistanceProfessional,Scientific, &TechnicalServicesFinance &InsuranceManufacturingTop-Hiring Industries/Average Starting SalariesINDUSTRY DEFINITIONSEducational Services: This sector comprises establishments that provide instruction and training in a wide varietyof subjects. The instruction and training is provided by establishments such as schools, colleges, universities, andtraining centers.Healthcare & Social Assistance: The Healthcare & Social Assistance sector comprises establishments providinghealth care and social assistance for individuals. The sector includes both health care and social assistancebecause it is sometimes difficult to distinguish between the boundaries of these two activities.Professional, Scientific, & Technical Services: This sector comprises establishments that specialize in performingprofessional, scientific, and technical activities for others. These activities require a high degree of expertise andtraining. (Examples – accounting, bookkeeping, payroll services, architectural, engineering, and computer services.)Finance & Insurance: This sector includes establishments primarily engaged in financial transactions and/or infacilitating financial transactions.Manufacturing: The manufacturing sector comprises establishments engaged in the mechanical, physical, orchemical transformation of materials, substances, or components into new products.Source: U.S. Census Bureau, North American Industry Classification System (NAICS), 2007. www.census.gov/eos/www/naics/8 Salary SurveyNational Association of Colleges and Employers www.naceweb.org
starting salary by academic MAJOR bachelor’s degreesMedian Starting SalaryAcademic Major20122011Percent Change inStarting AGRICULTURE and NATURAL RESOURCES MAJORSAgricultural Business andManagement******Animal Sciences******Conservation/Renewable NaturalResources******Plant Sciences******Other Agricultural Sciences****** 47,800 46,5002.8% 39,000 47,800 55,400****** 49,200 47,8002.9% 39,600 49,200 61,100******Economics (Business/Managerial) 54,800 51,9005.6% 43,900 54,800 66,300Finance 49,700 48,6002.3% 40,100 49,700 59,900Hospitality Services Management 31,700 31,1001.9% 26,600 31,700 35,700****** 31,200 31,2000.0% 25,400 31,200 38,400Logistics/Materials Management******Management Information Systems/Business Data Processing****** 49,600 47,8003.8% 40,100 49,600 63,100BUSINESS MAJORSAccountingActuarial ScienceBusiness Administration/ManagementBusiness Systems Networking/TelecommunicationsHuman Resources (incl. labor/industrial relations)International BusinessMarketing/Marketing Mgmt.(incl. mktg. research)salary ranges BUSINESS MAJORS 70,000 66,300 65,000 60,000 61,100 55,400 55,000 54,800 49,200 50,000 49,600 49,700 47,800 45,000 43,900 40,000 35,000 63,100 59,900 39,000 40,100 39,600 38,400 35,700 31,700 30,000 26,600 25,000AccountingBusiness AdministrationEconomicsFinanceHospitality Services Mgmt. 40,100 31,200 25,400International BusinessMarketing*Not currently available.National Association of Colleges and Employers www.naceweb.orgSalary Survey 9
starting salary by academic MAJOR bachelor’s degreesMedian Starting Salary20122011Percent Change inStarting Salaries25thPercentile50thPercentile75thPercentile 44,700 43,6002.5% 35,900 44,700 58,000******Communications 39,400 38,5002.3% 32,300 39,400 50,300Journalism 37,500 36,5002.7% 29,400 37,500 46,400************ 58,300 55,9004.3% 48,500 58,300 70,500****** 52,000 49,6004.8% 43,300 52,000 63,800Elementary Teacher Education 35,800 35,2001.7% 31,200 35,800 41,600Physical Education Teaching/Coaching 40,100 39,5001.5% 34,000 40,100 46,100Pre-Elementary Teacher Education 32,400 31,7002.2% 28,300 32,400 37,800Secondary Education 38,600 37,9001.8% 33,200 38,600 44,800Special Education 42,200 41,3002.2% 35,500 42,200 47,600Specific Academic/VocationalTeacher Education 38,900 38,3001.6% 33,400 38,900 45,000 64,200 63,0001.9% 54,900 64,200 78,400Agricultural Engineering******Architectural Engineering******Bioengineering and BiomedicalEngineering 41,800 41,4001.0% 31,500 41,800 52,000Chemical Engineering 63,000 62,4001.0% 53,200 63,000 74,500Civil Engineering 55,300 54,4001.7% 47,300 55,300 66,100Computer Engineering 67,800 67,4000.6% 55,400 67,800 79,000Electrical/Electronics andCommunications Engineering 57,300 55,8002.7% 48,300 57,300 70,200Engineering Technology******Environmental/EnvironmentalHealth Engineering******Industrial Production Technologies******Industrial/Manufacturing Engineering******Academic MajorCOMMUNICATIONS MAJORSAdvertisingBroadcast JournalismPublic Relations/OrganizationalCommunicationsCOMPUTER SCIENCES MAJORSComputer ProgrammingComputer ScienceComputer Systems AnalysisInformation Sciences and SystemsEDUCATION MAJORSENGINEERING MAJORSAerospace/Aeronautical/Astronautical Engineering*Not currently available.10 Salary SurveyNational Association of Colleges and Employers www.naceweb.org
starting salary by academic MAJOR bachelor’s degreesMedian Starting Salary20122011Percent Change inStarting ****** 58,600 57,7001.6% 48,500 58,600 70,300Metallurgical Engineering(incl. ceramic science/eng.)******Mining and Mineral Engineering(incl. geological)******Nuclear Engineering(incl. engineering physics)******Ocean Engineering******Petroleum Engineering******Systems Engineering****** 57,300 56,6001.2% 47,800 57,300 68,800Health and Related Sciences 36,400 35,8001.7% 31,200 36,400 41,500Nursing 48,400 48,1000.6% 42,200 48,400 55,600****** 29,200 28,5002.5% 25,000 29,200 33,600Academic MajorENGINEERING MAJORS (continued)Materials EngineeringMechanical EngineeringTextile Sciences and EngineeringHEALTH SCIENCESHOME ECONOMICS MAJORSClothing/Apparel/Textile Studies(incl. textile science)Home EconomicsHUMANITIES & SOCIAL SCIENCES MAJORSCriminal Justice and Corrections 30,800 30,6000.7% 25,800 30,800 36,600English Language and Literature/Letters 36,900 36,3001.7% 30,900 36,900 45,300salary ranges ENGINEERING MAJORS 85,000 79,000 78,400 74,500 75,000 70,200 64,200 65,000 55,300 63,000 55,000 54,900 68,800 70,300 66,100 52,000 57,300 58,600 55,400 53,200 45,000 67,800 57,300 48,300 47,300 48,500 47,800 41,800 35,000 31,500 trical EngineeringMechanicalTextile Science*Not currently available.National Association of Colleges and Employers www.naceweb.orgSalary Survey 11
starting salary by academic MAJOR bachelor’s degreesMedian Starting SalaryAcademic Major20122011Percent Change inStarting HUMANITIES & SOCIAL SCIENCES MAJORS (continued)Foreign Languages and Literatures 37,400 36,8001.6% 31,700 37,400 42,600History 37,500 37,0001.4% 32,400 37,500 43,800Liberal Arts and Sciences/General Studies 38,300 37,6001.9% 33,100 38,300 44,300Political Science/Government 38,400 37,9001.3% 31,700 38,400 46,400Psychology 33,500 33,1001.2% 28,100 33,500 40,200Social Work 33,300 32,7001.8% 27,100 33,300 38,300Sociology 31,700 31,5000.6% 26,700 31,700 37,900Visual and Performing Arts 34,800 34,1002.1% 28,900 34,800 43,800Other Humanities 35,800 35,2001.7% 29,000 35,800 43,400Other Social Sciences 36,100 35,3002.3% 30,300 36,100 44,800 26,700 26,3001.5% 22,900 26,700 31,200Architecture and Related Programs 38,200 37,8001.1% 32,500 38,200 46,700Biological Sciences/Life Sciences 38,300 37,9001.1% 31,700 38,300 46,400Chemistry 42,600 42,5000.2% 34,200 42,600 54,600Construction Science/Management 54,700 53,7001.9% 46,800 54,700 65,700Environmental Sciences/Studies******Geological and Related Sciences****** 47,000 46,3001.5% 39,200 47,000 55,300PARKS, RECREATION, LEISURE & FITNESS MAJORSParks/Recreation, Leisure/FitnessStudies and related programsSCIENCES MAJORSMathematics (incl. statistics)salary ranges HUMANITIES MAJORS 50,000 45,000 45,300 42,600 40,000 36,600 37,400 43,800 37,500 38,300 35,000 30,000 43,800 44,300 34,800 30,900 31,700 32,400 33,100 28,900 25,000English12 Salary SurveyForeign LanguagesHistoryLiberal Arts/General StudiesVisual and Performing ArtsNational Association of Colleges and Employers www.naceweb.org
starting salary by academic MAJOR bachelor’s degreesMedian Starting Salary20122011Percent Change inStarting Physics 32,900 32,8000.3% 26,800 32,900 43,700Other Physical Sciences 41,700 41,2001.2% 36,700 41,700 48,600Academic MajorSCIENCES MAJORS (continued)salary ranges sOCIAL SCIENCEs MAJORS 50,000 46,400 37,900 45,000 40,200 38,400 40,000 38,300 36,600 33,300 33,500 35,000 31,700 30,800 30,000 31,700 28,100 25,800 25,000Criminal JusticePolitical Science 26,700 27,100PsychologySocial WorkSociologysalary ranges MATH & SCIENCE MAJORS 65,000 65,700 60,000 54,600 55,000 50,000 46,700 35,000 42,600 30,000 46,800 38,300 38,200 32,500 55,300 47,000 46,400 45,000 40,000 54,700 43,700 39,200 32,900 34,200 31,700 26,800 25,000ArchitectureBiologyChemistryConstruction ScienceMath/StatisticsPhysics*Not currently available.National Association of Colleges and Employers www.naceweb.orgSalary Survey 13
top industries individual majorsMajor/IndustryNew Grad Entrants2012 Average SalaryProfessional, Scientific, and Technical Services (Incl. Accounting)22,000 49,300Finance and Insurance12,000 49,600Manufacturing8,000 50,800Management of Companies and Enterprises7,000 49,900Wholesale Trade5,000 51,500Federal, State, and Local Government (OES Designation)3,0
aBOuT THe Survey Data contained in the nace Salary Survey are produced through a compilation of data derived from the Bureau of labor Statistics, the census Bureau, and a master data set developed by Job Search Intelligence. Data for the Spring 2012 Salary Survey report were retrieved in February 2012, and were compiled using a proprietary meth-