Transcription
E x- P o s t E va lu at i o n O f S m a r t e r T r av e l A r e a SEx-Post Evaluation ofSmarterTravel AreasExecutive Summary 20181
E x - P o s t E v a l u a t i o n O f S m a r t e r T r a v e l A r e a s / E X E C UTIV E SUMMAR YEx-Post Evaluation ofSmarterTravel AreasExecutive Summary 2018Quality InformationPrepared forPrepared byPrepared by:Checked by:Approved by:Department for Transport TourismAECOM Professional ServicesElaine BrickRichard RedfernDerval Cumminsand Sport (DTTAS)IrelandRegional DirectorRegional DirectorDirectorCatherine SwiftConsultant4th Floor 2016 AECOM Professional Services Ireland.All Rights Reserved.This document has been prepared by AECOMProfessional Services Ireland (“AECOM”) forsole use of our client (the “Client”) in accordance with generally accepted consultancyprinciples, the budget for fees and the terms ofreference agreed between AECOM and the Client. Any information provided by third partiesand referred to herein has not been checked orverified by AECOM, unless otherwise expresslystated in the document. No third party mayrely upon this document without the prior andexpress written agreement of AECOM.Adelphi PlazaGeorges Street UpperCo. DublinIrelandT: 353 1 238 3100aecom.com1
E x - P o s t E v a l u a t i o n O f S m a r t e r T r a v e l A r e a s / E X E C UTIV E SUMMAR YTable of ContentsExecutive Summary 31. Introduction1.1Overview of the STA programme262. Evaluation Approach2.1Overview 282.2Key Evaluation Questions 282.3Evaluation Approach 292.4Data Collection/Collation 303. Programme Level Outcomes 2012 – 20163.1Overview 323.2All Trips 323.3Employment Trips 353.4Education Trips 363.5Non-Commuting Trips 383.6Summary 394. DungarvanSummary of Smarter Travel Delivery and Impacts in Dungarvan414.1Overview 434.2Programme Inputs 444.3Programme Outputs 464.4Programme Outcomes 544.5Conclusion: Impact of Smarter Travel in Dungarvan835. LimerickSummary of Smarter Travel Delivery in Limerick855.1Overview 885.2Programme Inputs 905.3Programme Outputs 915.4Programme Outcomes 975.5Conclusions: Impact of Smarter Travel in Limerick1286. WestportSummary of Smarter Travel Delivery in Westport1316.1Overview 1336.2Programme Inputs 1346.3Programme Outputs 1356.4Programme Outcomes 1416.5Conclusion: Impact of Smarter Travel in Westport1647. Programme Impacts7.1Introduction 1677.2Programme Outcome Overview 1677.3Benchmarking 1697.4Quality of Life 1717.5Health & Physical Activity 1737.6Safety 1767.7Environment 1777.8Economy 1787.9Economic Appraisal 1797.10Summary 1808. Lessons for the Future 1829 Concluding Summary 1892
E x- P o s t E va lu at i o n O f S m a r t e r T r av e l A r e a SExecutiveSummary3
E x - P ost E v aluation O f S marter T ra v el A reas / E X E C U T I V E S U M M A R Y 26.47mChange in Mode Shareinvested in Smarter Travel Areas 2012-2016685% 15% 55invested ininfrastructureinvested inbehaviouralchangemeasuresPublic realmenhancementprojectsJunction upgradesand crossingfacilitiesCarMode Share45 4.01mparticipating SmarterTravel Schools 22.46m100 WalkingMode ShareLimerick SmarterTravel Workplace andCampus PartnersChallenges, events andcampaigns as well as localand social media coverage17km 14kmof the totalquantified projectbenefits arehealth related1.3-12.1pp71% 67%Benefit / CostRatio of 1.3Decrease in car modeshare within SocioEconomic Group E2016Walking mode shareincreased from 20% in 2012to 25% in 2016 comparedto an increase of 0.2ppin the control area20% 25%20122016CyclingMode ShareCycling mode shareincreased from 2%in 2012 to 3% in2016 compared to anincrease of just 0.1%in the control area54%of other cyclefacilitiesCar mode sharedecreased from71% in 2012 to 67%in 2016 – despitean increase inemployment in allSTAs and a changeof -0.8% in thecontrol area201213of new/upgradedGreenway routesAll Smart Travel Areas / All Trips47%2% 3%2012Cycling modeshare 2016by gender/change2012–2016of survey respondentswho cycle say they arecycling more in 2016than the previous year2016MaleFemale5%/ 1.5pp1.5%/ 0.3pp4
E x - P ost E v aluation O f S marter T ra v el A reas / E X E C U T I V E S U M M A R YIntroductionThe Smarter Travel Areas (STA) Pilot Programmewas launched by the Department of Transport,Tourism and Sport (DTTAS) in 2012. Theobjective of the programme was to pilot arange of sustainable travel measures aimedat achieving modal shift from private car tosustainable travel modes such as walkingand cycling. Following a competitive biddingprocess, funding of 21.20 million was awardedto the three successful demonstration towns –Limerick, Dungarvan and Westport. A packageof both infrastructural and behavioural changemeasures was delivered in each of these areasbetween 2012 and 2016.5
E x - P ost E v aluation O f S marter T ra v el A reas / E X E C U T I V E S U M M A R YPurpose ofthe EvaluationGiven the demonstration town status of each ofthe three STAs, monitoring and evaluation was afundamental component of the pilot to ensure aclear understanding of how investment impactedon travel behaviour. As such, a robust evaluationprogramme was developed by DTTAS and hasbeen implemented across the five year deliveryprogramme. The evaluation was led by AECOM,with support from each of the STAs, and was thelargest of its kind undertaken in Ireland involvingcomprehensive data collection, monitoring andanalysis.Programme evaluation was ongoing over thelifetime of the STA programme, with monitoringreports prepared every six months, and an InterimReport prepared at the half-way point of theprogramme in 2015. This Final Report providesa comprehensive review of programme deliveryand investment impacts over the entire lifetimeof the project, from 2012 until the end of 2016.6
E x - P o s t E v a l u a t i o n O f S m a r t e r T r a v e l A r e a s / E X E C UTIV E SUMMAR YEvaluationMethodologyA bespoke evaluation approach was establishedwhich combined the development of a Theoryof Change for the programme by each STA,alongside the selection of a suitable controland supporting datasets. The development ofa Theory of Change supported the systematictesting of the assumed connections (i.e. thetheory) between an STA intervention and itsanticipated impacts. The focus of the approachwas therefore not only on understandingwhether an intervention had worked but alsoon why and under what conditions change hadbeen observed.The most important quantitative data sourceused in the evaluation was a Household TravelSurvey (HTS). The HTS was first conducted inOctober 2012 in advance of the STA programmeinvestment taking place. A follow-up survey wasconducted in October 2014 and a final surveywas undertaken in October 2016. The HTS wasconducted among a random, representativesample of people within each of the STAs (with anoverall sample size of over 5,500 respondents).It was comprised of three sections: a 24 hourtravel diary which collected information aboutjourney purposes, travel modes, time of traveland distance travelled; an attitudes andawareness survey which collected informationabout the attitudes of respondents towardslocal travel and sustainable transport; and asocio-demographic survey.AECOM used comparative datasets to furtherunderstand the STA programme outcomes andimpacts. First, the findings of the HTS werecompared against a national level comparatordataset (the National Travel Survey), to providecontext to the observed outcomes. This providedan indication of what might have happenedwithin the STAs if the programme of investmenthadn’t been made i.e. the counterfactualscenario. Secondly, a telephone administeredsurvey was undertaken with an independentsample of residents across Ireland, forcomparison with the attitudinal element of theHTS. Thirdly, comparison areas adjacent to thethree STAs have been used to assess changes inbusiness and economic indicators, particularlyfootfall and business closures.Additional quantitative data examined as partof the evaluation included: Vehicle, pedestrian and cyclist movementcounts on key routes; Car and cycle parking occupancy rates; Road safety statistics; and Economic activity data including footfallcounts, business occupancy rates, towncentre intercept surveys and businesssentiment surveys.7
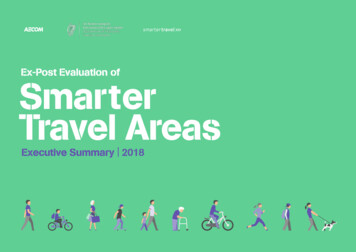
E x - P o s t E v a l u a t i o n O f S m a r t e r T r a v e l A r e a s / E X E C UTIV E SUMMAR YA qualitative research programme was alsodeveloped with the aim further analysing thereasons for modal shift, barriers to modal shift,additional measures that might be requiredto encourage modal shift and the issues andopportunities experienced in implementingsustainable travel measures. The programmeincluded: Focus groups to understand the behavioursand perceptions of key target groups –commuters, parents of school children,students, and ‘challenge’ participants, aswell as people involved in local businesses; In-depth interviews with the STA deliveryteams and key target organisations –schools, businesses and the University ofLimerick; Route intercept surveys of users of thegreenways to enhance understanding ofhow these facilities are used and perceived; Attendance at a number of SmarterTravel events to understand the profileof attendees and the impact of eventsin influencing travel behaviour throughinformal observation/conversation andintercept surveys; Independent audits of cycling infrastructurewere undertaken in all STAs, withconsideration of the National TransportAuthority’s Cycle Manual; Community cycling audits, wherebymembers of the public were escorted bybike around STA cycle networks to furtherunderstand perceived safety issues, withaccompanying travel pattern and attitudesurveys; Bespoke on-line surveys to provide insightinto the views of specific target groups; and Media monitoring to gauge how SmarterTravel is being portrayed in the media andhow it may influence community views ofthe programme as well as modal shift.8
E x - P ost E v aluation O f S marter T ra v el A reas / E X E C U T I V E S U M M A R YProgramme Delivery2012—2016DTTAS allocated 21.20m across threeparticipating STAs and an additional 5.27mwas invested in the programme by a range ofstakeholders, resulting in a total programmeinvestment of 26.47m. Approximately 85%was invested in infrastructure improvementsand the remaining 15% in behavioural changemeasures, including staff and operational costs.Among all three STAs, infrastructure spendwas focused heavily on the provision of offroad cycle facilities, greenways in particular.Overall, approximately 17km of greenways and14km of other cycling facilities (incl. sharedfootpaths, cycle tracks and on-road cyclelanes) were delivered, as well as a range oftraffic calming projects, junction improvementsand bike parking. The behavioural changemeasures implemented were focused on tripend locations, such as workplaces, schools andcampuses. The extent of behavioural changemeasures delivered varied between the STAs.A summary of the programmes delivered in eacharea is presented in the following sections.9
E x - P o s t E v a l u a t i o n O f S m a r t e r T r a v e l A r e a s / E X E C UTIV E SUMMAR YDungarvan‘Go Dungarvan’ received 7.20m of DTTASSmarter Travel funding. Over three quarters ofthis ( 5.81m) was invested in infrastructure,with the remainder ( 1.39m) on behaviouralchange measures. In addition, 3.20m wasinvested by Waterford County Council andother stakeholders bringing the total spend to 10.40m.A significant amount of new infrastructure wasdelivered in Dungarvan, including new cyclingand pedestrian facilities (4.8km of greenwaysand 9km of other on/off road facilities), trafficcalming, public realm improvements and new‘trip end’ facilities.The largest project, in financial terms, wasthe redevelopment of Grattan Square withinDungarvan town centre. The Square wasredesigned to follow a shared space concept,improving the visual appearance of the space,delivering improved pedestrian access toadjacent streets, reducing street clutter andcreating additional public space.Another high profile project in Dungarvan wasthe redevelopment of the ‘The Track’ (an oldroute along a disused railway line) to form a 4kmhigh quality greenway. The greenway links theedge of the town centre with residential areasto the east of Dungarvan and also formed thefirst section of the Waterford Greenway.The majority (75%) of the Dungarvan behaviouralchange budget was expended on staff and otheroperational costs. School travel planning wasthe main focus of the behavioural changeprogramme with all primary and secondaryschools in the town involved.10
E x - P o s t E v a l u a t i o n O f S m a r t e r T r a v e l A r e a s / E X E C UTIV E SUMMAR YGo Dungarvan Infrastructure Measures and participating Smarter Travel SchoolsPRIMARY SCHOOLSECONDARY SCHOOLTRAVEL CENTREPRE-EXISTING INFRASTRUCTURESTA PROGRAMME INFRASTRUCTURE41325126111MONANG ROAD2COOLAGH ROAD3DUCKSPOOL4BALLINROAD LINK5GOLD COAST ROAD6TRACK7MURPHY PLACE TRAFFIC CALMING/Homezone / pedestrian crossings8710914138davitt’s quay bike parking,the quays traffic calming9youghal road10fr twomeys road11n25 ring road12Cappoquin Road13GRATTAN SQ14EMMET ST JUNCTION IMPROVEMENTS11
E x - P o s t E v a l u a t i o n O f S m a r t e r T r a v e l A r e a s / E X E C UTIV E SUMMAR YLimerickLimerick Smarter Travel received 9m of DTTASSmarter Travel funding. In addition, 1.30m wasinvested by Limerick City and County Counciland other stakeholders bringing the total spendto 10.30m.Over three quarters of the funding was investedin infrastructure projects and the remaining onbehavioural change measures and resource costs.A significant amount of new infrastructurewas delivered in Limerick, including over 9kmof greenways, cycle lanes and tracks, as wellas traffic calming, junction improvements andnew crossings. Good quality bike parking wasprovided, particularly in the city centre and atthe University of Limerick (UL). A large proportionof investment was concentrated on greenwayslinking the City Centre and UL, and on walkingand cycling facilities in the Castletroy area.The largest infrastructure project, in financialterms, was the delivery of ‘Route 2’; a highprofile 5.1km greenway along the southernbanks of the River Shannon.Limerick invested more, proportionately, onbehavioural change measures than Dungarvanand Westport. A comprehensive programmeof measures was delivered encompassingschools, workplaces, campuses and thewider community. The Schools Programmetargeted 30 schools across the STA, whileseven organisations with a combined 8,000employees signed up as Workplace Programmepartners. The Campus Programme achievedbuy-in from three third-level institutions andtwo further education campuses. Events werethe most significant aspect of the CommunityProgramme and the largest events each yearwere held during National Bike Week, whichwas branded locally as ‘BeSpoke – Limerick’sCycling Festival’.12
E x - P o s t E v a l u a t i o n O f S m a r t e r T r a v e l A r e a s / E X E C UTIV E SUMMAR YLimerick Smarter Travel Infrastructure MeasuresLST SCHOOLSBIKE PARKINGUI BIKE PARKINGUL COMPLETED ROUTESUL EXISITNG D ROUTESPART 8 GRANTEDCOMPLETED ROUTESADACBFIGHEROUTE 2 / SHANNON FIELDS (LINK 1 PHASE 1)BROUTE 2 / SHANNON FIELDS (LINK 1 PHASE 2)CROUTE 2 / GUINNESS BRIDGE TO UL BOAT CLUBDUNIVERSITY OF LIMERICKSMARTER TRAVEL INFRASTRUCTUREEROUTE 4 CASTLETROY / NEWTOWNFROUTE 2 LEILA ST TO GUINNESS BRIDGEGRHEBOGUE NEIGHBOURHOOD GREENWAYHROUTE 3 CITY CENTRE TO UNIVERSITY OF LIMERICKIROUTE 2 PARK BRIDGEJROUTE 4 L1171 OLD TIPPERARY ROAD PART 8J13
E x - P o s t E v a l u a t i o n O f S m a r t e r T r a v e l A r e a s / E X E C UTIV E SUMMAR YWestportWestport Smarter Travel (WST) received 5mof DTTAS Smarter Travel funding. In addition, 770,000 was invested by Mayo County Counciland other stakeholders bringing the total spendto 5.77m. Over 95% of the DTTAS fundingallocation was invested in infrastructureprojects and the remaining 5% on behaviouralchange measures.Forward’ festival and European Mobility Week.Some examples of events organised include:‘Bike Buffet’ events; greenway walks andcycles; ‘Westport Walks Weekdays’ promotions;and ‘Park(ing) Day’ (where a parking space istemporarily transformed into a mini parklet bycommunity groups).The WST infrastructure investment was focusedon the expansion of the town greenway network.Overall, 7km of new greenway infrastructurewas delivered, providing a traffic free route forwalking and cycling with direct connections totwo primary schools, one secondary school andthe town’s main employer, Allergan.To complement the town greenway, investmentwas also made in on-road cycle lanes, withapproximately 1.6km provided on the CastlebarRoad and Altamount Street. WST also invested inpublic realm improvements and traffic calming,mainly within the town centre and at The Quays.The WST behavioural change campaign wasgiven the title ‘Winning Hearts and Minds’ andincluded general promotion and brandingactivities, school activities, workplace travelplanning and a community engagementprogramme. Events were a key part of thecampaign, with a wide range of communityevents organised to promote an awareness ofSmarter Travel particularly during the ‘Spring14
E x - P o s t E v a l u a t i o n O f S m a r t e r T r a v e l A r e a s / E X E C UTIV E SUMMAR YWestport Smarter Travel Infrastructure MeasuresPre-Existing InfrastructureSTA Infrastructure ProjectSmarter Travel Primary SchoolSmarter Travel Secondary SchoolOld Scoil PhadraigNew School Phadraig110115WESTPORT HOUSE GREENWAY EXTENSION2NORTHERN GREENWAY3TOWN CENTRE BIKE PARKING,PUBLIC REALM IMPROVEMENTS & TRAFFIC CALMING4CASTLEBAR ST. CYCLE LANES5HORKAN’S GREENWAY6WESTPORT GREENWAY EXTENSION TO KNOCKRANNY7ALLYMOUNT ST. CYCLE TRACK8MILL STREET IMPROVED BUS FACILITIES(SCHOOL DROP-OFFS)9WESTPORT TOWN GREENWAY10EXTENSION OF GDW GREENWAY TO IDA BUSINESS PARK11ALLERGEN ROAD CYCLE LANES1264The QuaysTownCentre387915
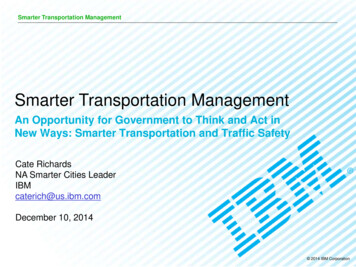
E x - P o s t E v a l u a t i o n O f S m a r t e r T r a v e l A r e a s / E X E C UTIV E SUMMAR YKey Evaluation FindingsModal shift from 2012-2016was higher in the SmarterTravel Areas than in thenational control sampleA key objective of the STA programme was toachieve modal shift from private car travelto sustainable transport. The impact of STAinvestment in this regard was primarilymonitored through the travel diary component ofthe HTS undertaken in each of the STAs. Resultsfrom the National Travel Survey (NTS) were usedas a national control.Results of the HTS for ‘all trips’ within the STAshow that between 2012 and 2016: Car mode share in the STAs decreased by4.0pp to 66.8%. By comparison, at a nationallevel, the car mode share for ‘all trips’ takenfrom the 2016 National Travel Survey(excluding Dublin) reduced by 0.8pp over thesame period. Walking mode share increased by 4.4pp to24.8%. This increase is notably higher thanthe 0.2pp increase observed nationally. Cycling mode share increased by 0.8pp to3.1%. The increase observed in the STAswas, again, higher than the 0.1pp increaseobserved nationally.The HTS results were also assessed by trip type.With regards employment trips, results of theHTS showed that: Between 2012 and 2016, the private carmode share decreased by 4.3pp to 76.1%. Walking mode share increased by 2.9ppto 14.9%. Cycling mode share increased marginallyby 0.8pp to 3.0%.A direct comparison of mode share forcommuting journeys only with the NTS is notpossible as the journey purpose of ‘work’ inthat survey includes both commuting andbusiness travel. As such, the HTS results havebeen recategorised to include commuting andbusiness trips. The results indicate that thereduction in private car mode share nationallyfor ‘work’ trips was -0.2pp, substantially lowerthan the reduction in car mode share in the STAsof -1.7pp. The combined increase in walkingand cycling mode share observed across theSTA programme for these trips ( 4.4pp) alsocontrasts with the national control where adecrease of -0.4pp in combined walking andcycling mode share was observed.16
E x - P o s t E v a l u a t i o n O f S m a r t e r T r a v e l A r e a s / E X E C UTIV E SUMMAR YSTA Programme Level Modal Shift,All Trips, 2012-2016STA Programme Level Modal Shift,Employment Trips, %2.9%3.5%2.3%0%2.2%3.0%1.0%2.2%4.4%3.8%0%Private Car201220142016N2012 13098WalkCycleBus/RailPrivate CarOther20122014 1221420142016 130842016WalkCycleBus/RailOtherN2012 13942014 12972016 149017
E x - P o s t E v a l u a t i o n O f S m a r t e r T r a v e l A r e a s / E X E C UTIV E SUMMAR YSTA Programme Level Modal Shift,Escorted Education Trips, 2012-2016100%N201287.6%83.7%2012 77820142014 6552016 .6%0%Private CarWalkAs the HTS could not be undertaken by personsunder 18 years of age, the survey only captures‘escorted education trips’ which are those takenby persons over 18 to accompany others toeducation. For these trips, results of the HTSshow that: Car mode share decreased by -3.9pp from87.6% in 2012 to 83.7% in 2016. The largest decrease occurred between2012 and 2014 when car mode sharedecreased to 81.9%.CycleBus/RailOtherA national control for this data is not available.Finally, the HTS results provide evidence ofmodal shift for non-commuting trips as follows: Car mode share in the STAs decreased by3.0pp to 64.4%. By comparison, at a nationallevel, the car mode share reduced by 0.1ppto 79.7% over the same period. Walking and cycling trips increased by 6.2ppto 30.7%. This increase is notably higherthan the 0.1pp increase observed nationally.18
E x - P o s t E v a l u a t i o n O f S m a r t e r T r a v e l A r e a s / E X E C UTIV E SUMMAR YSTA Programme Level Modal Shift,Employment Trips, 2012-2016NTS(excl. Dublin)STANTS(incl. Dublin)2016PP Change from 20122016PP Change from 20122016PP Change from 2012Private Car75.5%-1.781.5%-0.273.1%-1.5Walk / -0.4All OtherSTA Programme Level Modal Shift,Non-Commuting Trips, 2012-2016NTS(excl. Dublin)STANTS(incl. Dublin)2016PP Change from 20122016PP Change from 20122016PP Change from 2012Private Car64.4-3.179.7%0.172.8%-1.6Walk / Cycle30.7%6.215.5%0.119.7%1.3All Other5%-3.14.9%-0.27.5%0.319
E x - P o s t E v a l u a t i o n O f S m a r t e r T r a v e l A r e a s / E X E C UTIV E SUMMAR YSmarter Travel investmenthas had a very positive impacton the participating townsThe STA Pilot Programme has had a very positiveimpact on the quality of life of participatingcommunities. The attitudes and awarenesscomponent of the HTS indicates that the STAsare now considered to be more accessibleby non-motorised modes, more pleasant towalk and cycle in and, importantly, safer forpedestrians and cyclists. This indicates thatkey barriers to the use of sustainable transportmodes have in part been overcome by the STAprogramme investment.The reported changes in residents’ attitudesand perceptions of their local environment hascontributed to increased levels of walking andcycling which in turn has generated significanthealth benefits from increased levels of physicalactivity. The reported additional physical activityacross the STAs was calculated as an economicbenefit of 1.4m in nominal terms in 2016.The observed shift from car to more sustainablemodes has also contributed to environmentalbenefits within the STAs. Although the numberof car-based commuter journeys remainedrelatively constant between 2012 and 2016,there was a reduction in car use for other trippurposes. The reduction in car journeys (465fewer private car trips were taken in 2016compared to 2012 levels (in absolute terms),resulted in non-fuel vehicle operating costsavoided of 0.14m per annum and total fuelcosts avoided of 0.16m per annum in nominalterms In addition, emissions savings for CO2,NOx and PM resulted in estimated savings of 0.01m nominally in 2016.A potentially negative impact of the programmeidentified during the planning stage was areduction in economic activity resulting fromthe anticipated modal shift. However, evidencefrom footfall surveys, on-street surveys andinterviews with local businesses shows thatthere was little or no negative impact on thelocal economies.When considering the quantified economicbenefits of the programme for the STAs, aBenefit/Cost Ratio of 1.31 was calculated.20
E x - P o s t E v a l u a t i o n O f S m a r t e r T r a v e l A r e a s / E X E C UTIV E SUMMAR YAn integrated package of bothinfrastructure and behaviouralchange measures is mostlikely to achieve modal shiftPoor perception of safety is thebiggest barrier to increasingcycling mode shareEach of the three STA programmes comprised amixture of both infrastructure and behaviouralchange measures. The evidence suggests thatthis is a reasonable approach to take in otherareas, especially on the basis of the need toaddress existing low levels of infrastructureprovision, particularly for cyclists and thedemonstrated positive impact and costeffectiveness of behavioural change measures.Naturally, the scale of impact will depend onthe quality of both the infrastructure andbehavioural change measures delivered.Safety concerns were a consistent themethroughout the evaluation, to the extent thatit is the most significant barrier to increasingcycling. The perception of cycling safety variessignificantly depending on the infrastructureprovided with segregated infrastructure offeringthe highest perceived level of safety. However,on the basis that completely segregatedinfrastructure cannot reasonably be providedacross a full urban network, it is recommendedthat the provision of cycle training is expandedin schools and workplaces.Other key barriers to modal shift: Low levels of cycling confidence. Attitude to car use. Inertia. Practical barriers such as trip chainingand the need to carry heavy equipment. Weather.21
E x - P o s t E v a l u a t i o n O f S m a r t e r T r a v e l A r e a s / E X E C UTIV E SUMMAR YBehavioural change measureshave a positive impactbut need to be deliveredin a more focused wayOn-road cycling infrastructurehas not encouraged modal shiftGreenways have had a verypositive impact on the STAs buthave not encouraged modalshift for commuting tripsDespite the positive feedback received on thefacilities, greenways have not been successfulin achieving the overarching aim of encouragingmodal shift for commuting trips. Across eachof the STAs, the peak volume of both cyclistsand pedestrians using the facilities was eitherat midday or in the evening after the maincommuting period.It is recommended that while opportunistic, thelimitations of utilising pre-existing infrastructureto deliver greenways needs to be acknowledged.If the overarching objective for delivery of ascheme is to encourage commuting, then thisneeds to be embedded within overall planningand design from the early stages of delivery. It iseasier to construct greenways along pre-existingfacilities such as railway corridors; however, ifthis route does not reflect commuting desire linesthen the facility is unlikely to have an impact oncommuting trips. In addition, it is imperative thatthe facilities delivered are marketed to targetcommunities on the basis for which they wereintended, be it for commuting or tourism.On-road cycling infrastructure delivered acrossthe STAs has not demonstrated an impact onmodal shift. Automatic traffic counters closeto the delivered facilities do not demonstrate apositive change in cyclist numbers and qualitativefeedback suggests that this type of infrastructureresults in poor perceptions of safety, with manyparticipants suggesting that investment inon-road cycling facilities is counter intuitive toincreasing cycling. The evidence suggests that,where possible, segregated cycling infrastructureshould be provided.Walking has increased more thancycling in response to investmentThroughout delivery of the STA programme therewas a bias towards delivery of both infrastructureand behavioural change measures targetingcycling. Despite this, in all areas, walkingexperienced the highest level of shift at aprogramme level. This experience suggests thatmore focused investment on increasing walkingfor short trips may be an easier quick win inreducing car mode share. In parallel, investmentin appropriate infrastructure and behaviouralchange measures to encourage cycling could bemade, which is possibly a longer term objective.Behavioural change measures formed a keycomponent of each STA programme and thereis evidence that they had a cost effectiveand positive impact on the observed change,especially within schools, workplaces andcampuses. Despite positive feedback on manyaspects of behavioural change outcomes, thereis evidence from all STAs that this element ofthe programme sometimes lacked the focusand experience needed to maximise impact.The evidence points to the need for moretargeted and focused delivery of behaviouralchange programmes and greater training andguidance for those delivering behaviouralchange programmes. None of the STAsdeveloped a segmented approach to deliveringbehavioural change measures. The funding wasinvested across the community equally withoutrecognition of the willingness or ability ofvarious sectors within it to change. This resultedin some research participants concluding thatSmarter Travel was sometimes ‘preaching to theconverted’ instead of focusing on other cohortsof the community that might demonstrate awillingness to change but haven’t engaged withthe programme.22
E x - P o s t E v a l u a t i o n O f S m a r t e r T r a v e l A r e a s / E X E C UTIV E SUMMAR YAchieving greater modal shiftfor school trips will require across government responseProgramme and projectmanagement has a direct impacton programme outcomesAcr
5.5 Conclusions: Impact of Smarter Travel in Limerick 128 6. WEStport Summary of Smarter Travel Delivery in Westport 131 6.1 Overview 133 6.2 Programme Inputs 134 6.3 Programme Outputs 135 6.4 Programme Outcomes 141 6.5 Conclusion: Impact of Smarter Travel in Westport 164 7. programmE impactS 7.1 Introduction 167


![Smarter Battery Crack [2022-Latest]](/img/13/eliamari.jpg)