Transcription
Olamijulo et al.BMC Pregnancy and Childbirth(2022) en AccessRESEARCHTrends and causes of maternal deathat the Lagos University teaching hospital, Lagos,Nigeria (2007–2019)Joseph A. Olamijulo1,2*, Gbenga Olorunfemi3 and Halimat Okunola2AbstractBackground: Nigeria has one of the worst global maternal mortality ratios (MMR). Institutional audit is invaluable inproviding useful information for formulating preventive interventions.Objective: To evaluate the trends, causes and socio-demographic characteristics of maternal mortality at a tertiaryinstitution in South-western Nigeria over a period of 13 years (2007–2019).Methodology: Cross sectional and temporal trend analysis of maternal deaths were conducted using chartreviews from 2007 to 2019. Socio-biological characteristics, booking status and ranking of clinical causes of maternaldeaths were derived from patients’ chart review (2007–2019). Bivariate analysis and Annual percent change (APC)of the observed trends was respectively conducted using Stata version 17 and Joinpoint version 4.5.0.1 softwarerespectively.Results: In the period 2007–2019, the mean age at maternal death was 30.8 5.9 years and 88.8% of mortalitiesoccurred among the “unbooked” women. The leading causes of direct maternal mortality were Hypertension (27.0%),Sepsis (20.6%) and haemorrhage (18.7%), while anaemia in pregnancy (3.2%), Human Immunodeficiency Virus (3.2%)and Sickle Cell Disease (2.4%) were the leading indirect causes of maternal mortality Joinpoint estimates showed astatistically significant increase in MMR of about 3.4% per annum from 2211 per 100,000 live births in 2007 to 3555.6per 100,000 live births in 2019 (APC: 3.4%, P-value 0.001).Conclusion: Contrary to some other reports, there was an increase in the institutional MMR between 2007 and2019 even though the leading causes of death remained similar. Targeted interventions based on accurate data areurgently required in order to achieve the Sustainable Development Goal (SDG) 3.1.Keywords: Direct causes, Hypertension, Indirect causes, Join point trends, Lagos, Low- and middle-income countries,Maternal mortality, Nigeria, Sub-Saharan AfricaIntroductionMaternal mortality is a major public health problem inthe Low- and Middle-Income Countries (LMIC) suchas Nigeria and it is one of the strongest indicators of a*Correspondence: jolamijulo@unilag.edu.ng2Department of Obstetrics and Gynecology, Lagos University TeachingHospital, Lagos, NigeriaFull list of author information is available at the end of the articlecountry’s standard of living and maternity care [1]. Globally, about 303,000 maternal deaths occurred in 2015with 99% of these deaths occurring in LMICs [2]. TheSub-Saharan African countries (SSAs) had the greatest burden of maternal deaths as the regional maternalmortality ratio (MMR) in SSAs (546 deaths per 100,000live birth) was about 45 times higher than the MMR inhigh income countries (HICs) (12 deaths per 100,000live births) [2]. The disproportionate burden of maternal The Author(s) 2022. Open Access This article is licensed under a Creative Commons Attribution 4.0 International License, whichpermits use, sharing, adaptation, distribution and reproduction in any medium or format, as long as you give appropriate credit to theoriginal author(s) and the source, provide a link to the Creative Commons licence, and indicate if changes were made. The images orother third party material in this article are included in the article’s Creative Commons licence, unless indicated otherwise in a credit lineto the material. If material is not included in the article’s Creative Commons licence and your intended use is not permitted by statutoryregulation or exceeds the permitted use, you will need to obtain permission directly from the copyright holder. To view a copy of thislicence, visit http:// creat iveco mmons. org/ licen ses/ by/4. 0/. The Creative Commons Public Domain Dedication waiver (http:// creat iveco mmons. org/ publi cdoma in/ zero/1. 0/) applies to the data made available in this article, unless otherwise stated in a credit line to the data.
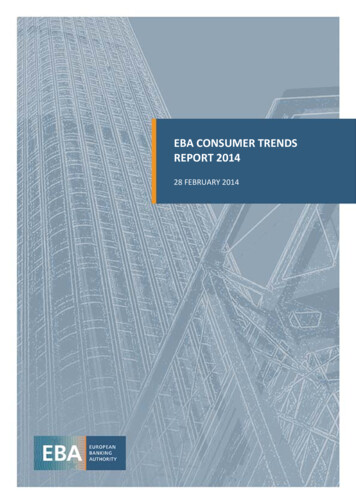
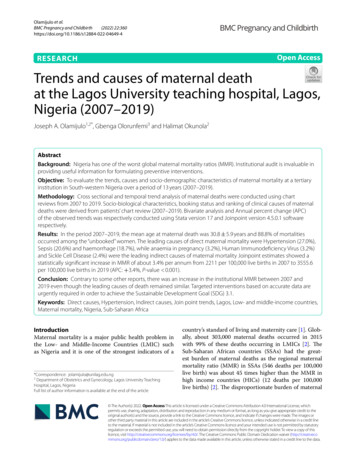
Olamijulo et al. BMC Pregnancy and Childbirth(2022) 22:360deaths in SSA illustrates the disparities in the burden ofpreventable socio-economic inadequacies and sub-optimal health systems between the HICs and the LMICs.Most maternal deaths in the LMICs are preventable, aspregnancy and puerperium are largely physiological processes and the leading causes of maternal mortality areeither preventable or treatable [2, 3]. Over the years, theeradication of the inequity and burden of global maternal mortality rates has been a major goal of the UnitedNations and global health and development organisations[2–4]. The 5th Millennium Development Goal (MDG 5)was aimed at reducing MMR by 75% by 2015 using the1990 estimates as baseline [2, 5]. However, at the close ofthe MDGs in 2015, only 22 out of 181 countries achievedMDG5 [2]. Subsequently, in 2015 the Sustainable Development Goals (SDG) 3.1 aimed to reduce the nationalMMR to less than 70 per 100,000 (from the global MMRof over 500) by 2030 [2]. To achieve such target, it isimperative for countries to initiate, sustain and monitor useful interventions aimed at prevention of maternalmortality.Nigeria is a Lower- Middle-Income country with anapproximate population of 180 million [6]. The WorldHealth Organisation (WHO) reported that about 58,000maternal deaths occurred in Nigeria in 2015, and that theMMR declined from 1350 deaths per 100,000 live birthsin 1990 to 814 deaths per 100,000 live births in 2015 [2,6]. The huge burden of maternal death in Nigeria is second to only India. The Nigerian MMR is also extremelyhigh when compared to the MMR in HICs [2]. Hence,Nigeria must improve its preventive interventions toachieve the SDG target of less than70 deaths per 100,000by 2030.A major constraint to the development, implementation and monitoring of interventions aimed at combating the problem of maternal mortality in Nigeria is lackof reliable data, as there is no organised vital registrationsystem in the country [3, 4, 6, 7]. Thus, the WHO estimates of maternal deaths in Nigeria may be inaccurate.A major source of information on maternal mortalitytrends in Nigeria is through review of hospital records[3, 6, 8]. Most of institutional trend studies on maternal mortality had hitherto utilised descriptive statistics[3, 4, 8–11]. Analytical trends techniques, as opposedto traditional descriptive approaches can help to refineconclusions from trends studies [3, 4, 8–11]. Therefore,the present study is aimed at determining the trends,causes and socio-demographic characteristics of maternal deaths at a tertiary hospital in South-western, Nigeria over a 13-year period (2007 to 2019), using Join pointregression modelling. This will serve to improve conclusions and inform policy decision. The study will alsoPage 2 of 12provide a snapshot of our progress towards the realisation of the SDG 3.1.MethodologyThis was a retrospective cross sectional and trends analysis study of all maternal deaths at the Lagos UniversityTeaching Hospital (LUTH), a 761-bed tertiary hospitalin South-western, Nigeria from 1st January 2007 to 31stDecember 2019. The hospital is one of the three publicinstitutions providing tertiary obstetric care to the metropolitan city of Lagos and her environ. LUTH receivesreferrals from both government and private health facilities in Lagos state and adjoining states and conducts anaverage of 1500 deliveries per annum.Maternal death is defined as the death of a womanwhile pregnant or within 42 days of delivery or termination, irrespective of the duration and site of the pregnancy from any cause related to or aggravated by thepregnancy or its management but not from accidentalcauses [2].All maternal deaths in the hospital from 1st January2007 to 31st December 2019 were identified by reviewingall the registers at the accident and emergency department, labour ward, theatre, antenatal and post-natalwards, intensive care unit and the mortuary department.Since every corpse was deposited in the mortuary, themortuary record was used to confirm the list of maternal deaths obtained from other records ensuring thatthere was no omission nor duplication. The case filesof the patients were retrieved from the medical recordsdepartment and data on socio-demographic characteristics, clinical cause of deaths, highest cadre of doctor whophysically attended to the patients and booking statuswere extracted using a standardized proforma. A bookedpatient is one who registered and was attending the antenatal clinic of the hospital prior to admission while anunbooked patient was one who did not register for antenatal care at our centre but whose emergency admissionwas her first attendance to the hospital via the emergency department. Annual live births were obtained fromthe birth register in the labour ward. The records of thedepartmental monthly maternal mortality reviews werealso retrieved to ascertain the agreed cause of death.Death ascertainmentThe department of obstetrics and Gynaecology conductsmonthly maternal mortality review. At the meeting, amultidisciplinary team of obstetricians, anaesthetists,neonatologist and pathologists discuss each case ofmaternal mortality and a cause of death is determinedand documented based on the input of all the teammembers. The agreed cause of death was utilised in thisstudy. The 10th revision of the International Statistical
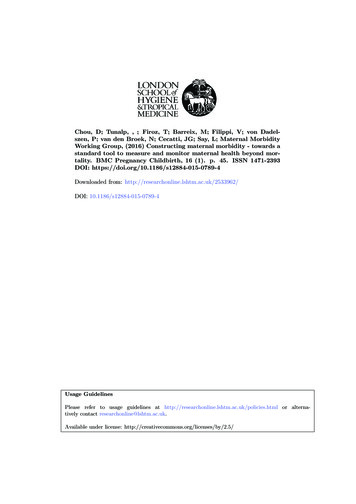
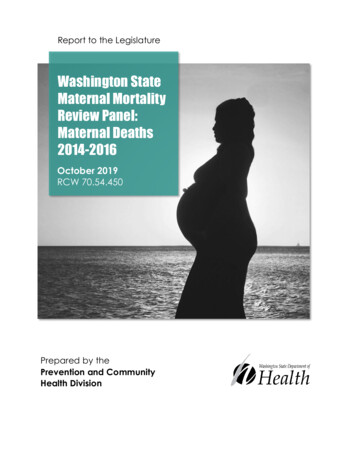
Olamijulo et al. BMC Pregnancy and Childbirth(2022) 22:360Classification of Diseases and related problems (ICD10) diagnostic codes by the World Health Organization(WHO) were used to classify the maternal deaths.Trends analysis from 2007 to 2019The annual maternal deaths and maternal mortality ratio(maternal death / total deliveries or live births) was calculated from the chart review conducted between 2007 and2019. The trends analysis of annual MMR between 2007 and2019 was conducted using Joinpoint regression software(version 4.3.1). Poisson regression approach with a maximum of 2 join points was utilised and 4499 permutationtests were conducted for the trends [12, 13]. The averageannual percent change (AAPC) of the trends (with its 95%confidence interval and P-value) was calculated. The MMRin 2015 was identified as an outlier and was excluded fromthe calculation of the trends analysis as it was extremelyhigh and more than twice all other MMRs. A statisticallysignificant positive or negative AAPC was respectivelydescribed as statistically significant increased or decreasedtrends. While APC between 0.5 and 0.5 with non-statistically significant P-value is assumed to be a stable trend.The trend in the cause of maternal death was analysedby conducting annual ranking based on the proportion(%) of each cause of death. The causes of death were alsoclassified into direct and indirect causes.Bivariate analysis of the socio‑demographic characteristicsand cause of death (2007–2019)Data was entered on excel spreadsheet and then importedinto STATA (Statacorp, Texas USA) version 16 statistical software. The socio-demographic and clinical characteristics of the decedents between 2007 and 2019 weredescribed. Categorical variables were presented as frequency and percentages while continuous variables werepresented as mean ( Standard Deviation) or median(interquartile range) based on test of normality. The association between socio-demographic and clinical characteristics and the three leading causes of direct maternal deaths(haemorrhage, hypertension, sepsis) was conducted usingPearson’s Chi-square test for categorical variable, while forcontinuous variables, analysis of variance (or Kruskal Wallistest) was utilised to test the differences in mean or medianacross groups. The data was further divided into two periods from 2007 to 2012 and 2013–2019 and compared.Statistically significant level was set at a P-value 0.05.Two-tailed test of hypothesis was assumed.Ethical considerationsEthical approval for this study was obtained from thehuman research and ethics committee of the LagosUniversity Teaching Hospital, LUTH, Lagos (Ref. No:ADM/DCST/HREC/APP/3867). The study was strictlyPage 3 of 12conducted according to international ethical principles,and we confirm that all methods were performed inaccordance with the relevant guidelines and regulationsof the ethics committee. The data was anonymised andthere was no breach of confidentiality and autonomy ofthe deceased patients. The study was a retrospectivestudy of routinely collected anonymised data and did notrequire obtaining informed consent from the decedents.Informed consent waiver was obtained from the humanresearch and ethics committee of the Lagos UniversityTeaching Hospital, LUTH, Lagos through ethics certificate with Ref. No: ADM/DCST/HREC/APP/3867.ResultsTrends in maternal mortality from 2007 to 2019A total of 483 maternal deaths and 17,948 live birthsoccurred from 2007 to 2019, giving a maternal mortality ratio of 2674.4 per 100,000 live births. Figure 1showed the MMR between 2007 and 2019. Except foran extreme peak in 2015 at 7407/100,000 live birth, theMMR ranges between 1682/100,000 live births (2012)and 3556/100,000 live births (2019) (Additional file 1).Based on Joinpoint regression modelling and afterexcluding year 2015 being an outlier, there was an overallstatistically significant increasing trend of MMR of about3.9% per annum from 2007 to 2019. (AAPC 3.4%;95%CI: 0.3 to 7.3%, P-value 0.10) Figure 2.Socio‑biological and clinical characteristics of maternaldeaths from 2007 to 2019Table 1 shows that between 2007 and 2019, the meanage at maternal death was 30.9 5.9 years and abouthalf of the deceased were in the fourth decade of life(n 262/483, 54.9 95%CI: 50.4–59.4%). The majority weremarried (84.1, 95%CI: 79.1–88.2%) and the majority werereviewed physically by a consultant obstetrician beforedeath (73.0, 95%CI: 68.3–77.1%). More than a quarter ofmaternal deaths (n 106/483, 28.9, 95%CI: 24.5–33.7%)occurred among nulliparous women. The median gestational age was 36(30–38) weeks and most of the mortalities occurred in the third trimester (n 166/483, 82.2,95%CI: 76.2–86.9%). More than four-fifths (88.8%) ofmaternal deaths occurred among unbooked patients.Comparison of the periods 2007–2012 and 2013–2019The mean maternal age at death increased slightly from30.3 6.1 years in 2007–2012 to 31.5 5.5 in 2013–2019period (P-value 0.0198) and 60.6% of deaths occurredin the fourth decade of life during 2013–2019 period ascompared to 49.8% of maternal deaths that occurred inthe fourth decade of life during the 2007–2012 period.There was increased proportion of maternal deaths in thefirst and second trimesters from 5.8% during 2007–2012
Olamijulo et al. BMC Pregnancy and Childbirth(2022) 22:360Fig. 1 Trends in annual maternal mortality ratio in LUTH (2007–2019)Fig. 2 Joinpoint trends analysis with zero join point of annual maternal mortality ratio in LUTH (2007–2019)Page 4 of 12
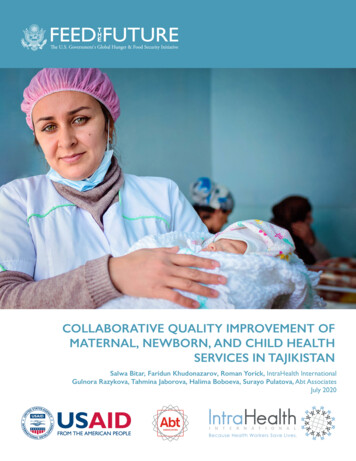
Olamijulo et al. BMC Pregnancy and Childbirth(2022) 22:360Page 5 of 12Table 1 Socio-biological and clinical characteristics of maternal deaths from 2007 to 2019CharacteristicsOverall (2007–2019) n 483, 2007–2012 n 256, (%)(%)2013–2019 n 227, (%)Age (mean SD) years30.9 5.930.3 6.131.5 5.520–29166 (34.8)98 (38.4)68(30.6)30–39262 (54.9)127 (49.8)135 (60.8)40–4936 (7.6)20 (7.8)16 (7.2) 2013 (2.7)10 (3.9)P-value0.0198*3 (1.4)0.054Marital statusMarried212 (84.1)141 (80.6)71 (92.2)Not married40 (15.9)34 (19.4)6 (7.8)Parity median (IQR)0.020*1 (0–3)1 (0–3)1(1–3)0.37480106 (28.9)62 (33.3)44 (24.3)0.049*1–4244 (66.5)119 (64.0)125 (69.1) 517 (4.6)5 (2.7)12 (6.6)36(30–38)36(32–38)35(28–38)First trimester ( 14 weeks)13 (6.4)2 (2.9)11(8.3)Second trimester (14–27 weeks)23 (11.4)2(2.9)21 (15.8)Third trimester ( 28 weeks)166 (82.2)65 (94.2)101(75.9)Gestational age0.0467*0.005*Booking statusBooked52 (11.2)19 (7.6)33 (15.4)Unbooked411 (88.8)230 (92.4)181(84.6)Consultant286 (73.0)119 (63.0)167 (83.5)Senior Registrar96 (24.7)64 (33.9)32 (16.0)Registrar7 (1.8)6 (3.2)1 (0.5)0.008* Cadre of managing Doctor 0.001*ICU admissionYes126 (27.5)80 (33.9)46 (20.7)No332 (72.5)156 (66.1)176 (79.3)0.002*ICU Intensive care Unit; * Statistically significant P-value 0.05 ; The most senior doctor who physically attended to the patientperiod to about 24.1% during the 2013–2019 period.Direct (physical) consultant involvement before deathincreased from 63.0% of cases during 2007–2012 to83.5% during the 2013–2019 period but the prevalence ofICU admission decreased from 33.9 to 20.7% during thelatter period (2013–2019) Table 1.Table 2 shows that between 2007 and 2019, nearlytwo-thirds (64.0%) of maternal deaths were due to thethree leading causes (Hypertension 27.4, 95% CI: 23.2–31.3%, Sepsis 20.6, 95% CI: 17.2–24.5% and Obstetrichaemorrhage 18.7, 95% CI: 14.3–24.4%). While the proportion of maternal deaths from hypertension declinedfrom 29.9% in 2007–2012 to 23.6% in 2013–2019period, the prevalence of Obstetric hemorrhage andsepsis respectively increased from 14.9 and 18.1% in2007–2012 period to 23.1 and 23.6% in the 2013–2019period respectively. Anaemia in pregnancy (3.5%) andHIV (3.5%) were the leading indirect causes of maternaldeath followed by Sickle cell disease (2.4%) and Cardiacdisease (2.2%).Annual trends in causes of maternal mortality in LUTH,Lagos (2007–2019)From Fig. 3, hypertensive disorders were the leadingcause of maternal mortality from 2008 to 2012 and in2016 while obstetric haemorrhage was the leading causeof annual maternal deaths in the latter period of the study(2013, 2014 and 2018–2019). No death was due to obstetric haemorrhage in 2016 for no obvious reason. However,haemorrhage contributed 15.3 and 15.0% to maternaldeaths in 2015 and 2017 respectively. Sepsis was also amajor cause of maternal death in the study period and itwas the leading cause of maternal deaths in 2007, 2013,2015 and 2017 respectively.Figure 4 shows that Anaemia, HIV and Sickle cell disease were the leading indirect causes of maternal deathin nearly all the years between 2007 and 2019. The proportion of maternal deaths due to HIV/AIDS fluctuatedbetween 2007 and 2019 ranging between 1.6% in 2015and 10% in 2018. However, HIV/AIDS did not contribute to maternal mortality in 2010, 2012,2014, 2017 and
Olamijulo et al. BMC Pregnancy and Childbirth(2022) 22:360Page 6 of 12Table 2 Clinical causes of maternal deaths in LUTH from 2007 to 2019Direct causes2007–2019 n, (%)2007–2012 n, (%)2013–2019 n, (%)P-valueHypertension126 (27.0)76 (29.9)50 (23.6)0.001*Sepsis96 (20.6)46 (18.1)50 (23.6)Post-partum Haemorrhage69 (14.8)28 (11.0)41(19.3)Uterine Rupture33 (7.1)25 (9.8)8 (3.8)Induced Abortion31 (6.7)24 (9.5)7 (3.3)Antepartum Haemorrhage18 (3.9)10 (3.9)8 (3.8)Ectopic Pregnancy14 (3.0)6 (2.4)8(3.8)Anaemia in pregnancy15 (3.2)7 (2.8)8 (3.8) 15 (3.2)9 (3.5)6 (2.8)Indirect CausesHIVSickle cell disease11 (2.4)7 (2.8)4 (1.9)Cardiac disease10 (2.2)7 (2.8)3 (1.4)Anaesthetic2 (0.4)1(0.4)1 (0.5)Diabetes Mellitus2 (0.4)1(0.4)1 (0.5)Malaria2 (0.4)1(0.4)1 (0.5)Unknown6 (1.3)2 (0.8)4(1.9)20 (4.3)6 (2.4) Others 0.48114 (6.6)*HIV Human Immunodeficiency Syndrome; Others are causes that occurred with a frequency of 1; Statistically significant at P-value 0.05Fig. 3 Annual trend of the direct causes of maternal death at LUTH, Lagos (2007–2019)2019. Notably, indirect causes did not contribute tomaternal mortality in 2014.Table 3 shows that abortion (40.0%) was the leadingcause of death among teenagers followed by hypertensive disorders (26.7%) and sepsis (13.3%). However, sepsiswas the leading cause of death among young women aged20–29 years while hypertension was either the leadingcause (30–39 years) or second leading cause (40 years andolder) among older women. On the other hand, obstetrichaemorrhage was the leading cause of death among womenolder than 40 years and second leading cause of deathamong women aged 30–39 years. All maternal deaths fromcardiac disease, ectopic pregnancy, sickle cell disease andHIV occurred among women older than 30 years.
Olamijulo et al. BMC Pregnancy and Childbirth(2022) 22:360Page 7 of 12Fig. 4 Annual Trend of the leading causes of indirect maternal death at LUTH, Lagos (2007–2019)Table 3 Ranking of causes of maternal death by age category 2007–2019Ranking 20 years20–29 years30–39 years40 years and above1Abortion (40%)Sepsis (24.6%)Hypertension (30.5%)Post-partum Haemorrhage (14.5%)/Antepartum Haemorrhage (12.2%)2Hypertension (26.7%)Hypertension (23.5%)Sepsis (21.5)Hypertension (24.4%)3Sepsis (13.3%)Post-partum Haemorrhage (14.4%)/Antepartum Haemorrhage (2.7%)Post-partum Haemorrhage (15.9%)/Antepartum Haemorrhage (3.1%)Sepsis (17.1%)4–Obstructed labour/uterine rupture(9.6%)Obstructed labour/uterine rupture(6.2%)Obstructed labour/uterine rupture(9.8%)5–Abortion (9.1%)Others (4.8%)Cardiac (7.3%)6–Others (4.8%)Human immunodeficiency Virus(4.2%)Others (7.3%)7––Anaemia (3.1%)Ectopic pregnancy (2.4%)8––Abortion (2.8%)Anaemia (2.4%)9––Cardiac disease (2.4%)Human immunodeficiency Virus(2.4%)10––Ectopic pregnancy (2.4%)Ectopic pregnancy (2.4%)11–Anaesthetic (1.7%)–12–Sickle cell disease (1.4%)–Socio‑biological factors and maternal mortalityTable 4 shows the association between selected socio-biological factors and the leading causes of maternal mortality. Unbooked patients accounted for 88.8% (n 411/463,88.8%; 95%CI: 85.5–91.3%) of maternal deaths comparedwith booked patients that accounted for only 11.2%. Conversely, 19.8% of women that died of haemorrhage werebooked patients while very few maternal deaths fromhypertensive disorders (9.1%) and Sepsis (4.3%) occurredin women who booked for antenatal care in the hospital.About 95.7, 90.9 and 80.2% of deaths from sepsis, hypertensive disorders and haemorrhage respectively occurredin unbooked women. Although women who died fromhaemorrhage (32.2 5.3 years) were older than womenwho died from hypertension (30.9 5.5 years) or sepsis(30.4 5.5 years), the differences did not reach statistical significance (P-value 0.0685). However, there was a statistically significant difference in median parity among the threeleading causes of maternal mortality as women who diedof haemorrhage had higher median parity of 2 [1–4]) ascompared to Hypertensive disorders (1 (0–3)) and Sepsis (1(0–2)) (P-value 0.0253). Deceased women who had hypertensive disorder had the highest ICU admission rate (42.5%)followed by haemorrhage (20.2%) and Sepsis (19.6%).
Olamijulo et al. BMC Pregnancy and Childbirth(2022) 22:360Page 8 of 12Table 4 Association between socio-demographic factors and the leading causes of direct maternal deaths. (2007–2019)CharacteristicsAge (mean SD) years 30Leading causes of maternal Deaths, n 309P-valueHypertension n 126 (%)Sepsis n 96 (%)Haemorrhage n 87 (%)30.9 5.530.4 5.532.2 5.395 (76.6)76 (79.2)61(70.1) 3029 (23.4)20 (20.8)26 (29.9) 204 (3.2)0 (0.00)0 (0.00)20–2939 (31.5)39 (40.6)29 (33.3)30–3973 (58.9)51(53.1)48 (55.2)40–498 (6.5)6(6.3)10 (11.5)57 (87.7)46 (93.9)37 (97.4)0.0685 #0.342 0.137 Marital statusMarriedNot marriedParity median (IQR)08 (12.3)3 (6.1)1(2.6)1 (0–3)1 (0–2)2 (1–4)0.0253 26 (28.6)18 (25.4)11 (17.2)0.482 1–459 (64.8)50 (70.4)50 (78.1) 56 (6.6)3 (4.2)3 (4.7)Gestational age (weeks)First trimester0.183 36 (34–38)35 (28–39)37 (34–39)0.1228 0 (0.0)3 (7.7)0(0.0)0.003*&Second trimester2 (4.9)6 (15.4)0(0.0)Third trimester39(95.1)30 (76.9)45 (100.0)Booked11(9.1)3 (4.3)13 (19.8)Unbooked110(90.9)86 (95.7)59 (80.2)Booking status0.003* Cadre of Doctor who directly attended to patientConsultant77 (76.2)63 (82.9)46 (67.7)Senior Registrar22 (21.8)13 (17.1)19 (27.9)Registrar2 (2.0)0 (0.0)3 (4.4)Yes51 (42.5)18 (19.6)17 (20.2)No69 (57.5)74 (80.4)67 (79.8)0.163&ICU admission 0.001* #P-value for ANOVA test. Post-hoc Bonferroni showed: Haemorrhage Vs Sepsis: P-value 0.033; Haemorrhage Vs Hypertension: P-value 0.514; Hypertension VsSepsis: P-value 0.492 P-value for Chi-square test. P-value for Kruskal Wallis test. & Fischer’s Exact; * Statistically significant P-value 0.05DiscussionThis study evaluated the trends, causes and associatedfactors of maternal mortality at a tertiary health facility over a 13-year period (2007–2019), using Joinpointregression modelling and other statistical methods.Summary of main findingsWe found that over the 13-year study period, 483 maternal deaths occurred at an average of 37 deaths perannum. Furthermore, the MMR increased by 4% perannum from 2211 per 100,000 live births in 2007 to 3556per 100,000 in 2019. Hypertension, haemorrhage, andsepsis contributed about two-thirds of maternal deaths.Anaemia, HIV/AIDS and Sickle cell disease were theleading indirect causes of maternal death.Trends in maternal mortality ratioIn contrast to the WHO estimates that suggested thatmaternal mortality decreased in Nigeria between 1990and 2015 [2, 9], our study revealed an overall upwardtrend in maternal mortality of about 4% per annumfrom 2007 to 2019. Generally, the MMR of between1700 and 7000 per 100,000 live births in our institutionbetween 2007 and 2019 was very high as compared tothe WHO estimate of 800/100,000 live birth for Nigeria[2]. Our finding is similar to that of Idoko et al. fromGambia who found that the decreased MMR trendsas reported by WHO for Gambia was at variance withtheir institutional increasing MMR trends [10]. Likewise, Okonofua et al. found an increased MMR amongthree secondary health institutions in Lagos state,
Olamijulo et al. BMC Pregnancy and Childbirth(2022) 22:360Nigeria from 2015 to 2016, with similarly high MMR of1602/100,000 live births [7]. Our centre is also locatedin same metropolitan city of Lagos, Nigeria. The poorvital registration system in Nigeria continues to be achallenge and may have negatively impacted on thevalidity of the WHO estimates of maternal mortality inNigeria and many other LMICs [6].Furthermore, our institutional MMR was comparableto reports from the northern and Eastern parts of Nigeria[11, 14–17]. However, the MMR at our centre was higherthan the reports from Calabar, South-south Nigeria [18]and elsewhere in Nigeria [4]. International comparisonsshowed that similarly high MMR was also reported fromGambia, Ghana and some LMICs [13, 18]. However, ourinstitutional MMR was about 5 to 100-fold higher thanvalues reported from countries in some part of Africaand among Middle-Income and High-Income Countries [19–23]. Our results are in sharp contrast to reportsfrom HICs that had declining or stable trends of MMR[21–25].However, some other authors also reported slightdecline from some part of Nigeria in line with the WHOreport [4, 8, 16–18]. The reported decline may be spurious as these reports generally involved shorter studyperiods of less than ten years which would make it difficult to draw valid conclusion on trends. Furthermore,these trends studies used descriptive rather than analytical statistics.The high MMR as highlighted by our study may alsobe partly due to other reasons. Our centre is a tertiary/referral institution and would attract a higher proportionof high-risk patients and our findings may not be generally applicable. Being a referral centre however shouldnot be a justification for the high and increasing MMRtrends as tertiary hospitals are expected to be appropriately equipped and well-staffed to manage complicated maternal health conditions. Poor investment intohealth infrastructure and inadequate number of skilledand experienced personnel to handle maternal and childhealth issues at the primary and secondary healthcarefacility could have contributed to the increased MMRat our centre, as the inadequate management of casesat the lower level centres may overburden the tertiaryhospitals [3]. Worsening economic outlook, and massive brain drain of health workers continue to accelerate while the effect of the COVID 19 pandemic is yet tobe revealed. In order to achieve SDG 3.1 of less than 70deaths per 100,000 live births by 2030 [26], global MMRmust decrease at a rate of 2% Per annum from 2000 to2030 SDG. For countries in sub-Saharan Africa, theMMR decline must occur at a much higher rate becausethe starting figures are well above average. Thus, policiesgeared towards strengthening institutional response toPage 9 of 12maternal morbidity and mortality are very important inachieving SDG 3.1 [7].Trends in causes of maternal mortalityNearly two-thirds of maternal mortality at our centre wasdue to hypertensive disorders, sepsis and haemorrhage.This is the usual pattern in most LMICs [11, 14–17].Thus, efforts geared towards reducing these major causesof maternal mortality will dramatically reduce maternaldeaths at our centre. It is noteworthy that the leadingcauses of maternal mortality in the United Kingdom forinstance is sharply different with cardiac disease, pulmonary embolism, epilepsy being the leading contributors[27]. As occurred in LMICs, hypertensive disorders werethe leading cause of maternal death at our centre (exceptfor the last three years of the study, 2017–2019) [2, 10,19]. However, we found that the contribution of hypertensive disorders to overall maternal death in LUTHdecreased from 29.9% in 2007–2012 period to 23.6% in2013–2019 period.The modest decline in the contributions of hypertensive disorders may be attributable to the use of evidencebased preventive protocols such as the commencementof low dose aspirin and calcium lactate in early pregnancyamong high-risk individuals for prevention of preeclampsia [28] and the introduction and implementation ofMagnesium Sulphate in the prevention and managementof eclampsia [28]. Provision of high-quality antenatal careto all pregnant women for early detection of features ofpreeclampsia, training of peripheral staff to recogniseand manage cases of preeclampsia, seamless referral system to tertiary hospital and strict adherence t
Nigeria is a Lower- Middle-Income country with an approximate population of 180 million [6]. e World Health Organisation (WHO) reported that about 58,000 maternal deaths occurred in Nigeria in 2015, and that the MMR declined from 1350 deaths per 100,000 live births in 1990 to 814 deaths per 100,000 live births in 2015 [2,