Transcription
SALARY SURVEYNACESTARTING SALARIES FOR NEW COLLEGE GRADUATES DATA REPORTED BY EMPLOYERSSEPTEMBER 2012 EXECUTIVE SUMMARYA ARETADLALED BYTROPREYERSEMPLONational Association of Colleges and Employers www.naceweb.org
SALARY SURVEYNACESTARTING SALARIES FOR NEW COLLEGE GRADUATES DATA REPORTED BY EMPLOYERSABOUT THE SURVEYData contained in the NACE Salary Survey are produced through a compilation of data derived from the Bureauof Labor Statistics, the Census Bureau, and a master data set developed by Job Search Intelligence. Data forthe September 2012 Salary Survey report were retrieved in July 2012, and were compiled using a proprietarymethodology created by Job Search intelligence. (Please note: Some fields include an asterisk, indicating that dataare not currently available in those instances. However, data will be available in future reports.)Salary Survey (ISSN 1520-8648) is available to individuals holding organizational membership in the NationalAssociation of Colleges and Employers; it is also available on a subscription basis. The Salary Survey reportis published three times a year—January, April, and September—by the National Association of Colleges andEmployers, 62 Highland Ave., Bethlehem, PA 18017-9085. For more information, see www.naceweb.org orcontact NACE at 800.544.5272.ADDITIONAL DATA AVAILABLE ONLINE: Additional data are available to NACE organizational members and SalarySurvey subscribers through the Salary Survey Online tool (www.naceweb.org/salary-survey-data/). Featuring data updatedmonthly, the tool provides in-depth national and regional salary data for new college graduates by industry.RESEARCH STAFFDirector of Foundation and Strategic Research: Edwin KocEmployment Information Manager: Andrea KonczResearch Assistant: Anna LongenbergerCopyright 2012 by the National Association of Colleges and Employers. No part of this publication may be used, adapted, or reproduced in any manner without written permission.THE NEW SALARY SURVEYThe September 2012 Salary Survey issue marks the third report using NACE’s new data collection method. Thisnew and improved report contains employer-based data (from approximately 400,000 employers) gathered fromgovernment and other sources, and the data are actual starting salaries, not offers. Because the data come froma statistically valid sample of employers rather than from voluntary reports by students, the new report is morerepresentative of the college population as a whole; the old report was heavily weighted toward engineering,accounting, and other disciplines that traditionally receive job offers prior to graduation. The new report containsmore data, and the data are more robust, allowing for additional analysis.The change in methodology and the shift from salary offer data to actual salary data necessitate an additionalchange: In the past, the Winter report had been the first report for the new year’s class. This year the Winter 2012report provided final salary data for the Class of 2011, and the Spring 2012 marked the first report for the Classof 2012. This issue, the September 2012 report, marks the second report for the Class of 2012.2 Salary SurveyNational Association of Colleges and Employers www.naceweb.org
EXECUTIVE SUMMARYClass of 2012 bachelor’s degree graduates are better paid than their Class of 2011 counterparts, as of this report.The overall average salary for 2012 bachelor’s degree graduates now stands at 44,259, up 1.7 percent abovethe overall average of 43,521 posted by the Class of 2011. It is important to note that while the overall increaseis small, all broad categories of majors saw an increase.FIGURE 1 AVERAGE SALARIES BY DISCIPLINEBroad Category2012 Average Salary2011 Average SalaryPercent ChangeBusiness 51,541 50,4462.2%Communications 42,286 41,3672.2%Computer Science 60,038 59,2341.4%Education 39,080 38,4611.6%Engineering 60,639 59,4961.9%Health Sciences 46,567 45,9031.4%Humanities & Social Sciences 36,824 36,3191.4%Math & Sciences 42,355 42,0020.8%Overall 44,259 43,5211.7%BUSINESSAt the bachelor’s degree level, the business disciplines,as a group, boast the highest overall increase—2.2percent. Currently, business majors average 51,541,compared to last year’s average of 50,446. Interms of individual business majors, those earning abachelor’s degree in marketing got the biggest bumpup: Their average starting salary is 53,400, up 2.7percent over Class of 2011. The most highly paidmarketing majors where those who took financialmanager positions with finance and insurance firms—their average starting salary is 64,300.Business administration majors and finance majors alsoposted increases that climbed above the 2 percentmark. Those earning bachelor’s degrees in businessadministration saw their average salary rise 2.3percent to 52,500, while finance grads now average 52,800, a 2.1 percent increase. For both types ofgraduates, financial manager positions are the mostlucrative positions. Business administration graduatesaverage 65,600, while finance majors start at anaverage of 69,500.The current average salary for graduates earningaccounting degrees is 50,400, up 1.8 percent over lastyear. Their highest average salary comes from financeand insurance firms, with an average starting salary ofNational Association of Colleges and Employers www.naceweb.org 67,500 for financial manager positions. Economicgraduates are seeing average salaries of 58,200, up1.7 percent over last year. For economics graduates,professional, scientific, and technical services firmsprovided the highest average starting salary— 70,400for computer science/systems analyst positions.COMMUNICATIONSLike the business disciplines, average salaries tocommunications majors rose 2.2 percent overall from 41,367 to 42,286. Within the specific disciplines,the average salary to advertising majors had thehighest gain—a 2.6 percent increase to bring theiraverage to 47,700. Salaries coming from employersin the professional, scientific and technical servicesindustry may be driving that increase: Advertisingmajors landing jobs in this industry average 52,700.COMPUTER SCIENCESGraduates earning computer-related degrees sawjust a 1.4 percent increase in their average startingsalary—that’s the second-lowest increase reported—but their average salary now stands at an impressive 60,038. Even more impressive: Those who landedjobs in the professional, scientific, and technicalservices industry got an average starting salary thatexceeds 65,000.Salary Survey 3
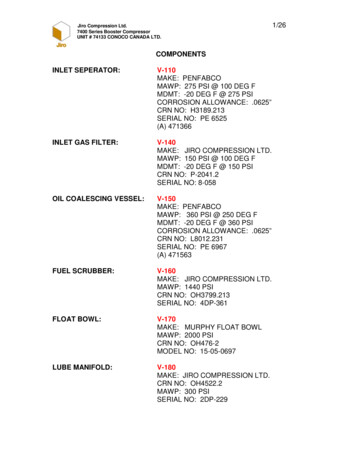
FIGURE 2 SALARY RANGES BY DISCIPLINE 75,000 65,000 61,353 55,000 51,541 50,000 45,000 35,000 60,639 60,038 60,000 40,000 71,702 70,441 70,000 52,209 46,857 43,442 39,080 39,673 32,426 50,134 46,567 44,479 42,286 30,000 52,101 49,168 42,355 38,734 36,824 32,550 33,751 29,598 25,000BusinessCommunicationsComputer ScienceEducationEDUCATIONGraduates earning education degrees saw theiraverage salaries increase slightly by 1.6 percent from 38,461 to 39,080. Not surprisingly, educationalservices firms are the top-employers for these graduates, and the highest average salary they reported was 43,500, for students majoring specifically in specialeducation. (Note: The educational services industry isalso the top-hiring industry for bachelor’s degreegraduates—regardless of major. See “Top-HiringIndustries,” page 8.)ENGINEERINGAs a group, engineering majors currently have the highest reported overall average salary at the bachelor’slevel. Their current average salary stands at 60,639,up 1.9 percent from 59,496.EngineeringHealth Sci.Humanities & Social Sci.Math & ScienceThe average salary to computer engineering graduatesrose 1.7 percent from 70,600 last year to 71,800,making these grads the most highly paid among theengineering fields.HEALTH SCIENCESThe average starting salary for health sciences majorsis up 1.4 percent to 46,567. Health and relatedsciences majors posted a 1.6 percent increase for anaverage starting salary of 38,300. Nursing majorsposted a 1.4 percent increase, bringing their overallaverage salary from 50,400 to 51,100.HUMANITIES AND SOCIAL SCIENCESThe biggest increase—not only among the engineering disciplines but among all majors reported in thisissue of Salary Survey—went to aerospace engineeringgraduates. Their whopping 6.9 percent increase bringstheir average salary to 71,300.The overall average salary to humanities and socialsciences majors rose 1.4 percent from 36,319 to 36,824. Although that’s slightly below the overallincrease for bachelor’s degree graduates, it is amarked improvement over the initial report for thisgroup: In the April 2012 Salary Survey—the firstreport for the Class of 2012—humanities and socialsciences majors posted an increase of just 0.5percent.Chemical engineering graduates saw a healthyincrease of 3.4 percent over the average posted bytheir 2011 counterparts, raising their overall averagesalary to 66,200. Graduates earning electricalengineering degrees posted a 1.9 percent increase;their average salary now stands at 60,500, up from 59,400 reported last year.Within the individual disciplines, most saw increaseshovering around 1 percent, but some fared a bit better.For example, English majors posted a 1.6 percentincrease, bringing their average salary from 38,300to 38,900. Their top employer—educational servicesorganizations—pays them an average salary of 38,400.4 Salary SurveyNational Association of Colleges and Employers www.naceweb.org
History majors saw their average salary rise to 39,100, up 1.3 percent over the Class of 2011average of 38,600. Educational services employersprovided the largest number of jobs for history majors,and an average salary of 38,600.Political science/government majors earn the highest average salary of the humanities/social sciencesgroup; their average salary now stands at 40,400,up 1.5 percent over the average posted by their Classof 2011 counterparts.The average salary for psychology majors alsoincreased; the average for the Class of 2012 is now 35,200—up 1.4 percent over the average for theClass of 2011. For psychology majors, the healthcareand social assistance industry was the most dominantemployer, with an average salary of 31,600.However, a large number of psych majors ended upwith jobs in the educational services industry, and ahigher average starting salary— 37,600.MATHEMATICSGraduates who earned math degrees posted a solidincrease; their average salary rose 2.1 percent to 49,500. Driving this increase may be the salariesreported by finance and insurance firms for actuarypositions, which averaged salaries of 65,300.PHYSICAL SCIENCESAmong the broad categories, the sciences groupsaw the lowest average salary increase—a mere0.6 percent to bring the group average up from 41,059 to 41,318.Many of the majors in this category performed belowthe overall average for bachelor’s degree candidates.For example, neither chemistry( 44,500) nor physics( 33,600) majors saw any increase in their averagesalary. Construction science/management majors( 57,400) posted an increase of just 0.2 percent,while biology majors ( 40,100) saw a slightly higherincrease—0.5 percent.A final look at salaries for the Class of 2012 will beavailable in the January 2013 Salary Survey report.Master’s Degree SalariesSalary Survey now features starting salary data for master’s degree graduates. All data are reportedby employers, and the methodology is the same as that used to determine average starting salaries forbachelor’s degree graduates.SALARY SURVEY ONLINENOWBLE!AVAILANew web-based tool from the National Association of Colleges and Employers. Access national and regional salary data for new college grads on the fly Get detailed information by industry and occupation Featuring employer-reported salary data updated bimonthlyLearn More: www.naceweb.org/salary-survey-data/Salary Survey Online, available to NACE organizational members and Salary Survey subscribers, is thecompanion to the Salary Survey Report and provides users with access to more data and more-detailed data.National Association of Colleges and Employers www.naceweb.orgSalary Survey 5
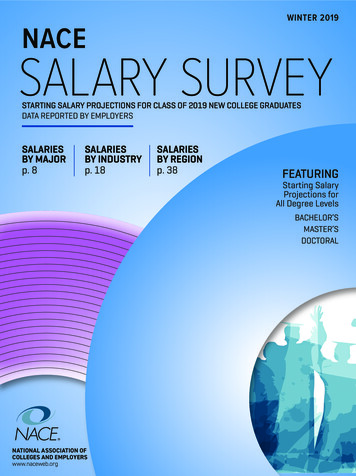
TOP-PAYING INDUSTRIESThe chart below shows the top five industries that paid the highest starting salaries to 2012 bachelor’s degreegraduates, regardless of major. The number of new graduate entrants reported by each particular industry is alsolisted here.Average Starting Salary60,00055,000 55,046 55,011 51,500 51,2364,40095,90032,500ConstructionFinance &InsuranceWholesaleTrade50,000 45,00047,50080,000ManagementManufacturingof Companiesand Enterprises 50,521Top-Paying Industries/Number of New Grad EntrantsINDUSTRY DEFINITIONSManagement of Companies and Enterprises: This sector comprises 1) establishments that hold the securities ofcompanies and enterprises for the purpose of owning a controlling interest or influencing management decisions,or 2) establishments that administer, oversee, and manage establishments of the company or enterprise.Manufacturing: The manufacturing sector comprises establishments engaged in the mechanical, physical, orchemical transformation of materials, substances, or components into new products.Construction: The construction sector comprises establishments primarily engaged in the construction of buildings orengineering products (e.g., highways and utility systems).Finance & Insurance: This sector includes establishments primarily engaged in financial transactions and/or infacilitating financial transactions.Wholesale Trade: This sector comprises establishments engaged in wholesaling merchandise, generally withouttransformation, and rendering services incidental to the sale of merchandise.Source: U.S. Census Bureau, North American Industry Classification System (NAICS), 2007. www.census.gov/eos/www/naics/*Not currently available.6 Salary SurveyNational Association of Colleges and Employers www.naceweb.org
TOP-HIRING INDUSTRIESThis chart shows the top five industries that reported the highest number of new graduate entrants for 2012bachelor’s degree graduates, regardless of major. The average starting salary reported by each particularindustry is also listed here.Number of New Grad 158,30095,900100,0000 38,540 49,422EducationalServicesProfessional,Scientific, &TechnicalServices 38,758 44,881Federal, State,Healthcare &and Local Govt.SocialAssistance (OES Designation) 51,236Finance &InsuranceTop-Hiring Industries/Average Starting SalariesINDUSTRY DEFINITIONSEducational Services: This sector comprises establishments that provide instruction and training in a wide varietyof subjects. The instruction and training is provided by establishments such as schools, colleges, universities, andtraining centers.Professional, Scientific, and Technical Services: This sector comprises establishments that specialize in performingprofessional, scientific, and technical activities for others. These activities require a high degree of expertise andtraining. (Examples - accounting, bookkeeping, payroll services, architectural, engineering, and computer services.)Healthcare and Social Assistance: The Healthcare & Social Assistance sector comprises establishments providinghealthcare and social assistance for individuals. The sector includes both healthcare and social assistancebecause it is sometimes difficult to distinguish between the boundaries of these two activities.Federal, State, and Local Government (OES Designation): Federal, State, and Local Government, excluding stateand local schools and hospitals, and the US Postal Service.Finance & Insurance: This sector includes establishments primarily engaged in financial transactions and/or infacilitating financial transactions.Source: U.S. Census Bureau, North American Industry Classification System (NAICS), 2007. www.census.gov/eos/www/naics/*Not currently available.National Association of Colleges and Employers www.naceweb.orgSalary Survey 7
GET CUSTOMIZED SALARY INFORMATIONSalary data are available byGEOGRAPHICLOCATIONGENDERRACE/ETHNICITYFor more information, contact Andrea McEwen, 800.544.5272, ext. 126; amcewen@naceweb.org.SALARY SURVEY62 Highland Avenue Bethlehem, PA 18017
The current average salary for graduates earning accounting degrees is 50,400, up 1.8 percent over last year. Their highest average salary comes from finance and insurance firms, with an average starting salary of 67,500 for financial manager positions. Economic graduates are seeing average salaries of 58,200, up 1.7 percent over last year.