Transcription
Improving Drinking Water Quality in a Wake County, North Carolina,NeighborhoodYuyun LiangA technical report submitted to the faculty at the University of North Carolina at Chapel Hill inpartial fulfillment of the requirements for the degree of Master of Science in EnvironmentalEngineering in the Department of Environmental Sciences and Engineering in the GillingsSchool of Global Public Health.Chapel Hill2015Approved by:Jackie MacDonald GibsonPete KolskyGreg Characklisi
2015Yuyun LiangALL RIGHTS RESERVEDii
ABSTRACTYuyun Liang: Improving Drinking Water Quality in a Wake County, North Carolina,Neighborhood(Under the direction of Jackie MacDonald Gibson)Multiple African American communities on the outskirts of municipalities in WakeCounty, North Carolina, lack access to community water supplies. Instead, these communitiesuse private well water. However, prior evidence suggests these communities are at risk ofexposure to well water contamination. In this report, I analyze four options for ensuring drinkingwater quality in one such community, located on Pheiffer Drive. The options are bottled waterdelivery; water filtration and routine water testing; well maintenance and repair, along withroutine disinfection and water testing; and connection to a neighboring municipal water system. Icompare the options on the basis of costs, health risks, and ease of operation and maintenance forhomeowners. Other than no action, connecting to the municipal water service is the lowest-costoption. In order to protect residents from the health risks associated with drinking watercontamination, I recommend the homes connect to the municipal water system.iii
ACKNOWLEDGEMENTSFirst and foremost, I am grateful to my supervisor, Dr. Jackie MacDonald Gibson, and Iappreciate very much her expertise, generous guidance and constant support.I would like to thank my committee members, Dr. Pete Kolsky and Dr. Greg Characklis,for their suggested revisions to and advice on this technical report.Also, I gratefully acknowledge the solid support I received from the City of RaleighPublic Utilities Department, without which I could not have completed this report.I would like to express my thanks to Mr. Frank Stillo, Ms. Heather Dew, Ms. Yang Du,Ms. Brenda Benavides, and Ms. Hannah Leker for their kind help and shared knowledge.At last, I would like to express my gratitude for my family, Moses Bility and friends fortheir constant love and support.iv
TABLE OF CONTENTSABSTRACT . iiiACKNOWLEDGEMENTS . ivTABLE OF CONTENTS . vLIST OF TABLES . viiiLIST OF FIGURES . ixLIST OF ABREVIATIONS . xCHAPTER I: INTRODUCTION . 1Background . 1Target Community . 2Technical Options Considered . 5CHAPTER II: ANALYSIS OF TECHNICAL OPTIONS . 6Overall Analysis Framework . 6Overall Cost Assumptions . 6Cost Elements of Each Option . 7Viewpoints Considered . 8Option 1 . 8Option 2 . 11Option 3 . 11Household Well Water Filter System Installation and Operation . 12v
Well Water Tests. 16Option 4 . 18Well Maintenance and Repair . 19Well Water Disinfection . 19Well Water Tests. 20Option 5 . 20Costs to Homeowners . 20Costs to the City of Raleigh . 22CHAPTER III: COMPARISON OF TECHNICAL OPTIONS . 27Option 1 . 27Option 2 . 27Option 3 . 27Option 4 . 28Option 5 . 28Technical Option Recommendation . 29Sensitivity Analysis . 32CHAPTER IV: IMPLEMENTATION OF TECHNICAL OPTIONS. 33Option 1 . 33Option 2 . 33Option 3 . 33vi
Option 4 . 34Option 5 . 35Conclusion . 35References . 37vii
LIST OF TABLESTable 1. Pheiffer Drive Community Censusa Information . 4Table 2. Cost Elements of Each Option . 7Table 3. Causal Inference Model Inputs and Parameters6 . 8Table 4. Cases Category and Costs10 . 9Table 5. Health Costs Estimation. 10Table 6. Components of Household Filter System14 . 13Table 7. Energy Charge Rates of Duke Energy Carolinas, LLC16 . 14Table 8. Wake County Well Water Analysis Fees17 . 17Table 9. Calcium Hypochlorite Product Information23. 20Table 10. Water Consumption Charges . 21Table 11. Construction Costs for a Municipal Water Service System Connection . 26Table 12. Costs for Option 3 . 27Table 13. Costs for Option 4 . 28Table 14. Costs for Option 5 . 29Table 15. Technical Options Costs and Benefits Comparison . 29Table 16. Sensitivity Analysis of Each Option . 32viii
LIST OF FIGURESFigure 1. Wake County, ETJ Census Blocks Without Community Water Service3 . 3Figure 2. Pheiffer Drive Community Location and Nearby Public Water Supply System . 3Figure 3. Locations of Houses in the Pheiffer Drive Community . 4Figure 4. Whole House Filter System 500,000 Gallon Well Water Rhino14 . 12Figure 5. Extension of Municipal Water Service System in the Target Community . 24Figure 6. the Pheiffer Drive Community Topography29 . 25ix
LIST OF ABREVIATIONSACAnnual CostAGIAcute Gastrointestinal IllnessAWRAmerican Water ResourcesCIMCausal Inference ModelCIPCapital Improvement ProgramCWSCommunity Water SystemEDEmergency DepartmentEPAU.S. Environmental Protection AgencyETJExtra-Territory JurisdictionMCLMaximum Contaminant LevelNCNorth CarolinaPIMPopulation Intervention ModelPVPresent Valuex
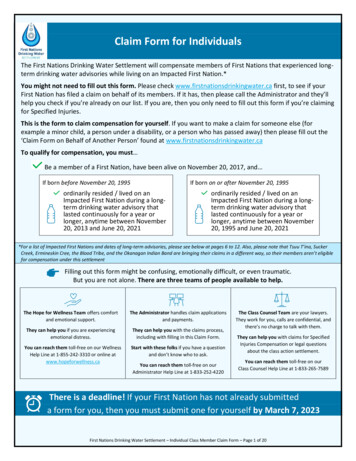
CHAPTER I: INTRODUCTIONBackgroundPrior researchers have found that some African American communities on the outskirts ofcities and towns across North Carolina lack community water supply service1,2.In North Carolina, cities exercise powers of planning and development in areas known asextra-territorial jurisdictions (ETJs) that extend up to three miles beyond the city boundaries.During the era of legally sanctioned racial segregation, some African American neighborhoodswere encompassed within ETJs instead of within the city boundaries, a phenomenon that hasbeen called racial underbounding2. As a consequence, these minority communities lack access tocommunity water supply and sanitation service.MacDonald Gibson et al. reported that access to water service was significantly lower inAfrican American neighborhoods than in other ETJ neighborhoods in Wake County, NC3;specifically, the odds of lacking access to water service increased by about 3.8% with every 10%increase in the African American population proportion in a U.S. Census block. Figure 1 showscensus blocks in Wake County ETJs by racial composition and water service access. As thefigure illustrates, although adjacent to or even enclosed by communities with full access tocommunity water supply service, some African American and other communities lack basicmunicipal water service. Instead, these communities depend on private well water. However,most households in these communities do not disinfect their well water. As a result, thesecommunities may be exposed to waterborne pathogens and higher health risks4. Between 20011
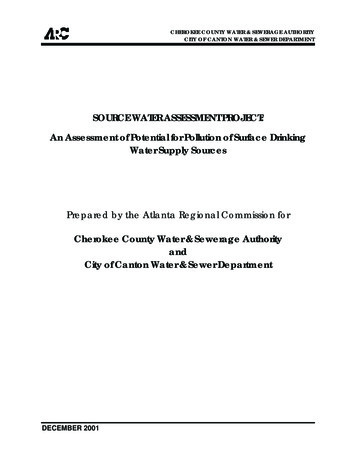
and 2002, 23 out of 25 (92.0%) of reported waterborne-disease outbreaks in the United Stateswere associated with untreated groundwater or groundwater treatment deficiencies5.Furthermore, Stillo reported that 65% of the 57 private wells serving African Americanneighborhoods in the ETJs of Wake County tested positive for at least one indicator ofmicrobiological contamination6.Target CommunityIn this report, I evaluate options for protecting drinking water safety in one of the WakeCounty ETJ African American communities identified as lacking municipal water service3.Given Stillo’s findings regarding well water microbiological contamination in similar WakeCounty neighborhoods, the households in this community could face an elevated risk of exposureto microbial contaminants in their drinking water, thereby placing them as risk for acutegastrointestinal illness (AGI). The Pheiffer Drive community’s location is shown in red in Figure1. At present, all the households in this community depend on private well water as the solesource of their drinking water, while the neighboring community is served by the City of Raleighpublic water service system (Figure 2). The target community is relatively small, containing only4 households (Figure 3) and 7 individuals (per the 2010 U.S. Census), 5 of whom are over 50years old and all of whom are African American (Table 1).2
Figure 1. Wake County, ETJ Census Blocks Without Community Water Service3Figure 2. Pheiffer Drive Community Location and Nearby Public Water Supply System3
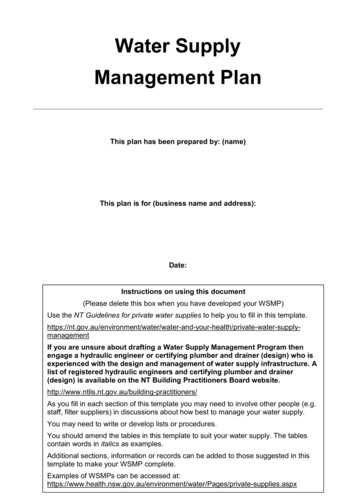
Figure 3. Locations of Houses in the Pheiffer Drive CommunityTable 1. Pheiffer Drive Community Censusa InformationCharacteristicCount (%)Houses44 (100)4 (100)77 (100)OccupiedOwner-occupiedIndividualsAfrican AmericanGenderMaleFemaleAge (years)Under 1820-2425-3435-4950-6465 and overa3 (43)4 (57)1 (14)0 (0)0 (0)1 (14)2 (29)3 (43)NC-Wake County-Census Tract 530.08-Block 20024
Technical Options ConsideredIn this report, I consider the costs and health benefits of the following five options formanaging drinking water quality in the target community:Option 1: No action (maintain the current situation in the target community)Option 2: Bottled water delivery – each household will purchase delivered, purifiedbottled water from Crystal Springs water company.Option 3: Household well water filter system installation plus well water testing - eachhousehold will install a 500,000 gallon well water Rhino Whole House Filter System(produced by Aquasana). To ensure the filter is performing as intended, each householdwill also conduct annual tap water quality tests (bacteria, nitrates, lead) as recommendedby the Wake County Human Services Laboratory.Option 4: Well maintenance and repair plus well water disinfection plus well watertesting - each household will be provided with well maintenance and repair services byAmerican Water Resources (AWR), including well piping, valves and switches, pressuretanks, etc. In addition, each household will conduct annual well water disinfection usingcalcium hypochlorite. The Wake County Human Services Laboratory will also conductan annual well water quality test for each household.Option 5: Connection to neighboring municipal water service system - each householdwill connect to the City of Raleigh municipal water service system. Under this option,water testing is not needed, since the Raleigh water service system conducts regular watertesting and provides reliable water quality monitoring.For each option, I consider the costs and health benefits from two perspectives: those forcommunity residents and those for the City of Raleigh. Community costs and benefits balancethe out-of-pocket costs to individual households against the health benefits gained throughreduced exposure to contaminated water. Costs and benefits for the City of Raleigh (option 5)balance the cost to city taxpayers of extending municipal water lines against the additionalservice fee and tax revenue income gained by incorporating the Pheiffer Drive community.5
CHAPTER II: ANALYSIS OF TECHNICAL OPTIONSOverall Analysis FrameworkAs mentioned in the previous chapter, to increase drinking water quality and decrease thehealth risk triggered by well water contamination for the target community, I considered thefollowing technical options on a cost-benefit basis:Option 1: No actionOption 2: Bottled water deliveryOption 3: Household well water filter system installation plus well water testingOption 4: Well maintenance and repair plus well water disinfection plus well watertestingOption 5: Connection to City of Raleigh municipal water service systemOverall Cost AssumptionsI used a 30-year time frame for this analysis and computed the total costs and benefits foreach option over that time frame based on net present values. Thirty years is a typical planninghorizon for municipal utility projects due to typical debt repayment periods, infrastructurelifetimes, and decreases over time in the present values.Per the guidelines in Office of Management and Budget Circular A-947, whichestablishes the principles of cost-benefit analysis for federal agencies, I used a discount rate of3% as a measure of the social rate of time preference8, and adopted this discount rate over the6
30-year time frame to avoid time-inconsistency problems. As per Circular A-94, I used adiscount rate of 7% for the sensitivity analysis7.I assumed that there were no contamination risks over the 30-year time frame (e.g.,chemical contamination) other than microbiological well water contamination, such as thatreported by Stillo6. Consequently, for this report, I defined health costs as those due to acutegastrointestinal illness (AGI) triggered by well water microbial contamination. I adopted apopulation intervention model (PIM) previously published by DeFelice9 to evaluate the AGIhealth risks. I assumed that the illness costs would be eliminated when any of the technicaloptions was taken.Cost Elements of Each OptionThe cost elements of each option are listed in Table 2. For well water testing, since mosttarget community residents are elderly and may lack the skills necessary to collect well watersamples, I assumed that there would be additional costs in the form of environmental service feesand well water analysis fees charged by Wake County Environmental Services.Table 2. Cost Elements of Each OptionOptionDescription1No action2Bottled water delivery3Household well water filter systeminstallation plus well water tests4Well maintenance and repair plus wellwater disinfection plus well water tests5Connection to City of Raleigh waterservice systemCost elementsHealth costsPurchase costsCapital costs, labor fees, electricity fees,environmental service fees, well water analysisfeesAmerican Water Resources (AWR) service fees,disinfectant (calcium hypochlorite) costs,environmental service fees, well water analysisfeesBorne by target community residents: one-timeconnection application fee, waterconsumption charges, water servicechargesBorne by Raleigh City government: pipelineconstruction fees7
Viewpoints ConsideredI assessed the costs and benefits for each option from the following two viewpoints todetermine potential alternative views of the most desirable solution for improving drinking waterquality: Residents in the target community – I assumed that the residents would prefer animprovement in drinking water quality at a reasonable and acceptable price and thattechnical options must be easy for homeowners to operate (necessary to guarantee optioneffectiveness). Raleigh city government – I assumed that the City would be willing to pay for the costsof water service line extensions if the public health improvements and increases in cityincome generated through water service charges were sufficiently high.Option 1The only cost associated with option 1 (no action) is that associated with AGI resultingfrom microbiological contamination of the well water in the community. To evaluate the AGIhealth risk, I applied a causal inference model (CIM), which incorporated a PIM fitted tomonthly county-level health outcome and water quality data, then applied the model using theAnalytica software package to estimate the average number of community monthly AGIemergency department (ED) visits avoided (Table 3)Error! Bookmark not defined. . The PIM waspreviously developed by DeFelice9, and the development of the CIM from this PIM is describedin Stillo6. In brief, the CIM calculates the number of avoided AGI ED visits using the followingequation:𝑎𝑣𝑜𝑖𝑑𝑒𝑑 𝐴𝐺𝐼 𝐸𝐷 𝑣𝑖𝑠𝑖𝑡𝑠 𝐴𝐹 𝑅 𝑃 0.208 2.51 10 3 7 3.65 10 3Table 3. Causal Inference Model Inputs and Parameters6ParameterAFDescriptionModeling Method (mean, standard deviation)ReferenceNormal (0.208, 9.17 10-3)Stillo6Attributable Fraction8
RRate of ED Visits for AGI inWake County, NC (MonthlyVisits Per Person)PPopulation (Persons)Lognormal (2.51 10-3, 5.16 10-4)DeFelice972010 NCcensus U.S.CensusTable 3 describes the terms in this equation and their sources.After running the model, I obtained a value of 3.65 10-3 (95% confidence interval:2.54 10-3– 5.03 10-3) for the average number of community monthly AGI ED avoided visits, and4.38 10-2 for the average number of community annual AGI ED avoided visits if all risk ofmicrobial contamination were eliminated.The number of ED visits estimated from CIM model in this report overlooks thepotentially large number of AGI cases that will not result in ED visits. To estimate the totalnumber of AGI cases potentially attributable to microbial contamination in the community andtheir level of severity, I applied Phaedra S.C et al.’s 1993 figures10 for the percentage of infectedindividuals with different severity (mild, moderate, severe) to the annual average number ofavoided community AGI ED visits. To obtain the costs of these AGI cases, I used illness costsreported in Phaedra. The illness costs are composed of medical costs and productivity losses(Table 4).Table 4. Cases Category and Costs10IllnessseverityReactionMildDid not seek physicianor ED careHad at least onephysician or ED visitbut was nothospitalizedHospitalized at leastonce during the illnessoutbreak periodModerateSevereInfectedpersons withdiarrhea (%)88Medicalcosts(1993 )2Productivitylosses(1993 )113Totalcost(1993 )115Inflationadjusted totalcost (2014 )17311641642263316,3991,4097,80811,7129
On the basis of U.S. dollar implicit price deflators for gross domestic product, Imultiplied the 1993 health costs by 1.5 to adjust for inflation and obtained the 2014 health costvalues11 (Table 4).I assumed the avoided ED visits estimated in this report are infected persons with severediarrhea. With the same percentage of infected individuals with different severity, I estimated thenumber of infected person with moderate AGI per year is 0.482 and the number of infectedperson with mild AGI per year is 3.86.𝑖𝑛𝑓𝑒𝑐𝑡𝑒𝑑 𝑝𝑒𝑟𝑠𝑜𝑛𝑠 𝑤𝑖𝑡ℎ 𝑚𝑜𝑑𝑒𝑟𝑎𝑡𝑒 𝐴𝐺𝐼 𝑝𝑒𝑟 𝑦𝑒𝑎𝑟 𝑖𝑛𝑓𝑒𝑐𝑡𝑒𝑑 𝑝𝑒𝑟𝑠𝑜𝑛𝑠 𝑤𝑖𝑡ℎ 𝑚𝑖𝑙𝑑 𝐴𝐺𝐼 𝑝𝑒𝑟 𝑦𝑒𝑎𝑟 0.0438 11.00% 0.4821.00%0.0438 88.00% 3.861.00%As shown in Table 5 and the following calculations, I estimated the present value of thecommunity total health costs at 29,080:𝑡𝑜𝑡𝑎𝑙 𝑐𝑜𝑠𝑡𝑠 𝑓𝑜𝑟 𝑖𝑛𝑓𝑒𝑐𝑡𝑒𝑑 𝑝𝑒𝑟𝑠𝑜𝑛𝑠 𝑤𝑖𝑡ℎ 𝑚𝑖𝑙𝑑 𝐴𝐺𝐼 𝑝𝑒𝑟 𝑦𝑒𝑎𝑟 3.86 172.5 665𝑡𝑜𝑡𝑎𝑙 𝑐𝑜𝑠𝑡𝑠 𝑓𝑜𝑟 𝑖𝑛𝑓𝑒𝑐𝑡𝑒𝑑 𝑝𝑒𝑟𝑠𝑜𝑛𝑠 𝑤𝑖𝑡ℎ 𝑚𝑜𝑑𝑒𝑟𝑎𝑡𝑒 𝐴𝐺𝐼 𝑝𝑒𝑟 𝑦𝑒𝑎𝑟 0.482 633.0 305𝑡𝑜𝑡𝑎𝑙 𝑐𝑜𝑠𝑡 𝑓𝑜𝑟 𝑖𝑛𝑓𝑒𝑐𝑡𝑒𝑑 𝑝𝑒𝑟𝑠𝑜𝑛𝑠 𝑤𝑖𝑡ℎ 𝑠𝑒𝑣𝑒𝑟𝑒 𝐴𝐺𝐼 𝑝𝑒𝑟 𝑦𝑒𝑎𝑟 0.0438 11,712.0 513(1 𝑖)𝑁 1𝑃𝑉 𝑜𝑓 𝑡ℎ𝑒 𝑐𝑜𝑚𝑚𝑢𝑛𝑖𝑡𝑦 𝑡𝑜𝑡𝑎𝑙 𝑖𝑙𝑙𝑛𝑒𝑠𝑠 𝑐𝑜𝑠𝑡𝑠 𝐴 ()𝑖(1 𝑖)𝑁(1 0.03)30 1 ( 665 305 513) () 29,0800.03 (1 0.03)30Table 5. Health Costs EstimationIllness severityFrequencyMildTotal cost percase ( )Infected persons (/yr)3.86Percent8817310Total annual cost forcommunity( )666
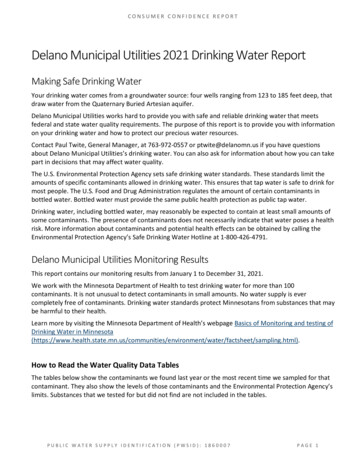
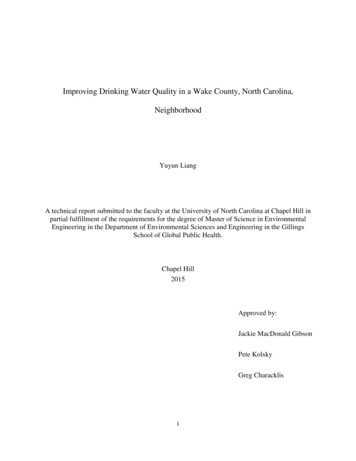
ModerateSevere0.482116333050.0438111,712513Total annual cost1,484Present value of total community illness costsover 30 years29,080Option 2Under option 2, each household will purchase a delivery service for bottled purified waterfrom Crystal Springs.I assumed that the individual consumption of bottled water in the target community is 3.5L/day on the basis of the Dietary Reference Intakes for water established by the Food andNutrition Board in 200412. The average number of persons in each household is 1.75. Thus, eachhousehold will purchase 5 bottles of 5 gallons per bottle of purified water every half month at theprice of 7.49 per bottle13. Additionally, Crystal Springs will charge 2.41 as a variable energysurcharge for each delivery13. The present value of the total costs of bottled water delivery byCrystal Springs over 30 years is 18,916 per household.𝑤𝑎𝑡𝑒𝑟 𝑛𝑒𝑒𝑑𝑒𝑑 3.5 𝐿 𝑑𝑎𝑦 1.75 15 𝑑𝑎𝑦 0.264 𝑔𝑎𝑙𝑙𝑜𝑛𝑠/𝑙𝑖𝑡𝑒𝑟 25 𝑔𝑎𝑙𝑙𝑜𝑛𝑠 𝑝𝑒𝑟 ℎ𝑎𝑙𝑓 𝑚𝑜𝑛𝑡ℎ𝑁𝑃𝑉 𝐴 (0.03 30 12 2(1 12 2) 1(1 𝑖) 1) ( 7.49 5 2.41) ()𝑖(1 𝑖)𝑁0.030.03 30 12 2 (1 )12 212 2 18,916Option 3Under option 3, each household will install a 500,000 gallon well water Rhino WholeHouse Filter System (produced by Aquasana) (Figure 4) and will conduct the annual well water11
quality tests recommended by the Wake County Human Services Laboratory to guarantee thefilter system performance.Figure 4. Whole House Filter System 500,000 Gallon Well Water Rhino 14Household Well Water Filter System Installation and Operation Upfront CostsThe upfront capital cost of the whole filter system is 1,28614. The filter system requiresinstallation by skilled labor. I assumed that the Mr. Rooter Plumbing Company would providethe labor with the original installation fees of 38015. Thus, the total upfront costs of the filtersystem is 1,666.𝑡𝑜𝑡𝑎𝑙 𝑢𝑝𝑓𝑟𝑜𝑛𝑡 𝑐𝑜𝑠𝑡𝑠 1,285.70 380 1,666 Operation and Maintenance CostsThis system is composed of a sediment pre-filter, main tanks (copper-zinc and mineralstone, activated carbon filter), sub-micron post-filter and UV-disinfection system (Table 6).12
Table 6. Components of Household Filter System14ComponentConsumption periodCost(years)( )FunctionSediment pre-filterCatches rust, sediment and siltCopper-zinc & mineralReduces chlorine, water solublestoneheavy metals, and scale andinhibits bacteria and algae growthActivated carbon filter0.257.495769.990.7529.951100.00Reduces herbicides, pesticidesand other chemical compoundsSub-micron post-filterReduces any remaining sedimentand organic particles down to0.35 micronsUV-disinfection systemFurther protects against bacteria(40 W)and virusesThe consumption period-based schedule of component replacement is recommended toensure the filter system’s effectiveness. I calculate the costs of components replacement over theperiod of 30 years as below.The present value of the costs of the filter system’s component replacements is composedof pre-filter (estimated at 591.08), main tank (estimated at 2,842.67), post-filter (estimated at 784.50), and UV bulb (estimated at 1,960.04) costs.30(1 𝑖)𝑁 1Pre-filter: 𝑃𝑉 𝐴 (𝑖(1 𝑖)𝑁) 7.49 ((1 0.03 0.25)0.25 130) 591.080.03 0.25 (1 0.03 0.25)0.2530/5Main tanks: 𝑃𝑉 𝐹/(1 𝑖)𝑁 𝑁 1 769.99/(1 0.03)5𝑁 2842.6713
30(1 𝑖)𝑁 1Post-filter: 𝑃𝑉 𝐴 (𝑖(1 𝑖)𝑁) 29.95 (𝑖(1 𝑖)𝑁30) 784.500.03 0.75 (1 0.03 0.75)0.75(1 𝑖)𝑁 1UV bulb: 𝑃𝑉 𝐴 ((1 0.03 0.75)0.75 1(1 0.03)30 1) 100.00 (0.03 (1 0.03)30) 1,960.04Summing these component costs estimates yields a total components update cost of 6,178.𝑃𝑉 591.08 2,842.67 784.50 1,960.04 6,178I assumed that the Mr. Rooter Plumbing Company would provide the labor for thereplacement every 3 months of the component with the fees of 100 per trip15. Thus, I estimatethe present value of the labor cost of component replacement at 7,894.Component replacement fee:30(1 𝑖)𝑁 1(1 0.03 0.25)0.25 1𝑃𝑉 𝐴 () 100 (30 ) 7,894𝑖(1 𝑖)𝑁0.03 0.25 (1 0.03 0.25)0.25The filter system’s power requirement is rated at 40 W. I estimated the electricity feesresulting from the filter system operation based on the charge rates of Duke Energy Carolinas,LLC (Table 7)16.Table 7. Energy Charge Rates of Duke Energy Carolinas, LLC16Summer monthsNon-summer months(June 1 – September 30)(October 1 – May 31)On-peak energy cost per month, per kWh 0.138381 0.124290Off-peak energy cost per month, per kWh 0.065013 0.065013On-peak period hours12:00 noon – 6:00 p.m.7:00 a.m. – 1:00 p.m.Monday - FridayMonday – FridayOff-peak period hoursAll other weekday hours and all Saturday and Sundayhours. All hours for the following holidays shall beconsidered as Off-Peak: New Year’s Day, MemorialDay, Good Friday, Independence Day, Labor Day,14
Summer monthsNon-summer months(June 1 – September 30)(October 1 – May 31)Thanksgiving Day, Day after Thanksgiving Day andChristmas Day.I assume that this filter system will be operated 24 hours a day over the period of 30years.In a year, there are 260 weekdays and 105 weekend days; excluding the holidays whichfall on weekends; the number of days counted as off-peak holidays is 6.Thus, the number of on-peak period hours for the summer months is 508.𝑂𝑛 𝑃𝑒𝑎𝑘 𝑝𝑒𝑟𝑖𝑜𝑑 ℎ𝑜𝑢𝑟𝑠 𝑓𝑜𝑟 𝑠𝑢𝑚𝑚𝑒𝑟 𝑚𝑜𝑛𝑡ℎ𝑠 (260 6) 4 6 508 ℎ𝑜𝑢𝑟𝑠12The number of on-peak period hours for the non-summer months is 1016.𝑂𝑛 𝑃𝑒𝑎𝑘 𝑝𝑒𝑟𝑖𝑜𝑑 ℎ𝑜𝑢𝑟𝑠 𝑓𝑜𝑟 𝑛𝑜𝑛
Option 3: Household well water filter system installation plus well water testing - each household will install a 500,000 gallon well water Rhino Whole House Filter System (produced by Aquasana). To ensure the filter is performing as intended, each household will also conduct annual tap water quality tests (bacteria, nitrates, lead) as recommended