Transcription
Children and Youth Services Review 87 (2018) 86–94Contents lists available at ScienceDirectChildren and Youth Services Reviewjournal homepage: www.elsevier.com/locate/childyouthThe effects of placement and school stability on academic growthtrajectories of students in foster careT⁎Elysia V. Clemensa, , Kristin Klopfensteinb, Trent L. Lalondea, Matt TisaabUniversity of Northern Colorado, 501 20th St., Greeley, CO 80639, United StatesColorado Evaluation and Action Lab, University of Denver, United StatesA B S T R A C TAs a result of the Every Student Succeeds Act and its requirement that students in foster care be included ineducation report cards, states have a renewed sense of urgency surrounding accountability for the academicachievement of this vulnerable group of students. This study examined the effects of placement and schoolstability on students' academic growth before, during, and after out-of-home placements. The sample consistedof 7674 youth in 4th through 10th grades from one Mountain region state who were also in foster care at anypoint between 2008 and 2014. The findings from the current study underscore the importance of: (a) supporting“catch-up” growth when students initially enter the child welfare system; (b) considering the detrimental effectsof co-occurring placement changes and school moves in case planning for students in foster care; (c) maintainingacademic progress for those students who are meeting grade-level expectations; and, (d) implementing supportsand services that extend beyond the duration of time that students are in foster care.1. IntroductionStudents in foster care often have large gaps in academic achievement across subject areas and grade levels and, as a result, may requiremultiple years of successful interventions to catch-up to grade-levelstandards (Barrat & Berliner, 2013; Clemens & Tis, 2016). While researchers acknowledge that the experience of being in foster care maydisrupt learning, some researchers have also suggested that studentsoften enter the foster care system already exhibiting low levels ofacademic proficiency. For example, a comparison of performance onstate achievement tests indicated that the largest deficits in reading andmath achievement are evident in the months immediately precedingremoval from the home (Berger, Cancian, Han, Noyes, & Rios-Salas,2015). It is true that experiences of maltreatment, high mobility, familyinstability, domestic violence, and poverty, which are prevalent forchild welfare-involved youth, are associated with low achievement(Berger et al., 2015; Herbers et al., 2012; Romano, Babchishin, Marquis,& Fréchette, 2015). It is unclear, however, how academic growth yearafter year is affected when students enter into foster care.In recent years, researchers and policymakers have demonstrateddramatically increased awareness of the gap in academic achievement forstudents in foster care. In 2015, the Every Student Succeeds Act (ESSA)introduced a new requirement that this population of students be included in education agency state report cards (Section 1111.h.1.C.ii;⁎Section 1111.h.1.C.iii.II). Inclusion in state report cards means that theeducational outcomes of students in foster care must be disaggregated andvisible in the same way as outcomes are tracked for other populations ofstudents. Prior to ESSA, relatively few states tracked educational outcomes for students in foster care (Data Quality Campaign, 2017). As aresult, the population of students in foster care was described as having an“invisible achievement gap” (Barrat and Berliner, 2013, p. 1). With thepassage of ESSA, we can expect that in the coming years increased attention will be paid to the academic achievement of students in foster carewith an eye toward closing this chasm.The current study elucidates how academic growth is related tofactors such as the timing of the first removal from the home and thelength of time in the child welfare placement, issues contributing toschool instability. The investigation is motivated by the need for childwelfare and education agencies to collaborate on improving the educational stability of students in foster care in order to encourage theiracademic success. This research helps to identify key points in timeduring which public policies can deliberately support students in fostercare to mitigate the adverse impact of mobility events on academicgrowth. The actionable variables of interest include school moves associated with a home placement change, duration of time in care, andage at first removal. The implications of this study are framed in termsof opportunities for child welfare and education agencies to improvethe academic growth of students in foster care.Corresponding author at: Campus Box 131, University of Northern Colorado, Greeley, CO 80639, United States.E-mail address: Elysia.Clemens@unco.edu (E.V. .02.015Received 28 November 2017; Received in revised form 7 February 2018; Accepted 8 February 2018Available online 09 February 20180190-7409/ 2018 Elsevier Ltd. All rights reserved.
Children and Youth Services Review 87 (2018) 86–94E.V. Clemens et al.experience a placement disruption each year (Blakey et al., 2012).Findings also suggest that lack of integration into the new out-of-homeplacement increases the likelihood of further placement disruption inthe future (Leathers, 2006). The anticipation of a child welfare placement change, as well as uncertainty about the duration of a placement,can be constant sources of distress and fear for youth (Unrau,Chambers, Seita, & Putney, 2010). Researchers studying the effect ofplacement instability describe emotional consequences, which includefeelings of rejection, lack of control, and insecurity (Hébert, Lanctôt, &Turcotte, 2016; Munford & Sanders, 2015).Placement instability can sometimes translate into school instability. In one Mountain state, 31% of initial home removals resultedin a school move (Clemens, Klopfenstein, et al., 2017). When a subsequent placement change occurred, school moves occurred for 42% oftransitions between family-like settings, and they occurred 50% of thetime when the transition was from congregate care to a family-likesetting (Clemens, Klopfenstein, et al., 2017). When a change in childwelfare placement is associated with a school move, youth are facedwith the difficult challenge of simultaneously adjusting to a new livingsituation and a new school.Regardless of whether the school move is associated with a placement change, educational researchers acknowledge that students whomove schools during an academic year may experience discontinuity ofcourse content, variations in teachers' instructional styles, and differences in school culture, all of which may disrupt student learning(Cutuli et al., 2013; Herbers et al., 2012; Lash & Kirkpatrick, 1990;Mehana & Reynolds, 2004; Temple & Reynolds, 1999). Theorists suggest that each time a child experiences a school move, the school-basedrelationships that support learning may also be disrupted (Coleman,1988). In a qualitative study, youth described the need for educationalstability, a sentiment captured in a poignant statement by one participant:1.1. Academic achievement, proficiency, and growthAcademic achievement is typically reported for groups of studentsbased on their level of proficiency using descriptors such as unsatisfactory, partially proficient, proficient, and advanced. The distributionof proficiency levels provides insight into how far a subgroup is frommeeting grade-level standards. For students in foster care, the distributions are positively skewed compared to their non-foster carepeers, meaning that across subject areas and grade level, there are highpercentages of foster care students scoring in the lowest proficiencycategories and fewer students scoring in the highest proficiency categories (Barrat & Berliner, 2013; Clemens & Tis, 2016). This distributional pattern is particularly pronounced in math (Clemens & Tis,2016).Achievement gaps are typically defined as the difference betweenthe percentage of students in a subgroup who score at or above gradelevel on end-of-grade assessments (i.e., meeting or exceeding proficiency standards) versus the scores of students in the state as a whole.According to statewide research studies comparing students in fostercare and their non-foster care peers, there is at least a 20 percentagepoint gap between these groups in math, reading, and writing (Barrat &Berliner, 2013; Clemens & Tis, 2016). Similarly, the Washington Stateaccountability data also showed 20 percentage point gaps acrossmany years, grade levels, and assessment categories (Office ofSuperintendent of Public Instruction, 2017). Washington State is theonly state that includes academic achievement data in its state education report cards (Data Quality Campaign, 2017). The size of the gapmay serve as a call to action, but does not necessarily inform educatorsand policymakers on how to approach the problem.Students with particularly low levels of proficiency in a subject areamay require multiple years of successful interventions to catch-up tograde-level standards. For this reason, one promising focal point inthese efforts involves analyzing academic growth trajectories.Academic growth describes the amount of progress students make in agiven subject area (e.g., math, reading, writing) in the span of a year.Academic growth scores can be considered a leading indicator of progress toward grade-level standards for populations of students who tendto score well below their peers on achievement tests. The current studywill analyze and describe longitudinal academic growth trajectories forstudents in foster care, which can be used by child welfare and education agencies to set targets for interventions aimed at acceleratingstudents' academic growth in reading, writing, and/or math.Stability is the biggest issue, because that's your main issue in lifeand that's the biggest [thing] that you desire. And school is like themost normal it gets for stability (Clemens, Helm, Myers, Thomas,& Tis, 2017, p. 72)Additional research is needed to determine how the interplay between child welfare placement changes and school moves relate toacademic growth.3. Child welfare placement type and length of time in care2. Placement and school instabilityThe types of placement and length of time students are in out-ofhome care are particularly relevant to academic growth trajectories.According to the U.S. Department of Health and Human Services(2016), appropriateness of placement involves consideration of bothplacement stability (i.e., “two or fewer placement settings in a singlefoster care episode”) and types of placement settings (p. 27). Familylike settings, rather than congregate care settings with more than sixchildren, are typically considered the most appropriate placements,especially for children age 12 or younger (U.S. Department of Healthand Human Services, 2012; U.S. Department of Health and HumanServices, 2016).Like appropriateness of placement, shortening the time it takes toachieve permanency for children in out-of-home-care (e.g., reunification, living with other relatives, legal adoption, etc.) is supported byresearch and federal policy (U.S. Department of Health and HumanServices, 2016). The national data demonstrate that length of time incare is associated with differing amounts of placement and school stability. According to a recent report to Congress regarding nationwidechild welfare outcomes, in 2014 the majority of children(median 85.4%) in out-of-home care for 12 months had no morethan two placements (Children's Bureau, 2017). However, only 66% ofyouth in care for 12–24 months and 35.3% in care for 24 monthsexperienced no more than two placements. These national statisticsThe existing literature base regarding students in foster care tends tohighlight the negative consequences of either placement instability orschool instability (Fawley-King, Trask, Zhang, & Aarons, 2017). However, less is known about the combined effect of these changes onstudents' academic progress (Berger et al., 2015). Recently, researchershave begun to investigate the connection between placement changesand school moves (e.g., Clemens, Klopfenstein, Tis, & Lalonde, 2017).Some scholars have suggested that adjusting to new caregivers andhome-based routines may stifle academic progress, even when studentsremain in their school of origin, due to the stress and disruption of theplacement (Berger et al., 2015). Only once these combined effects areunderstood can effective solutions be further developed and clear expectations set for measuring progress.Researchers have argued that placement instability is among thegreatest threats to the well-being of child-welfare-involved youth(Moore, McDonald, & Cronbaugh-Auld, 2016; Waid, Kothari, Bank, &McBeath, 2016). The initial removal is a highly stressful and potentiallytraumatic event (Baugerud & Melinder, 2012) that may “disrupt children's emotional, relational, psychological, and cognitive development”(Conners-Burrow et al., 2013, p. 1830). Once part of the foster caresystem, studies have shown, anywhere from 22% to 70% of youth87
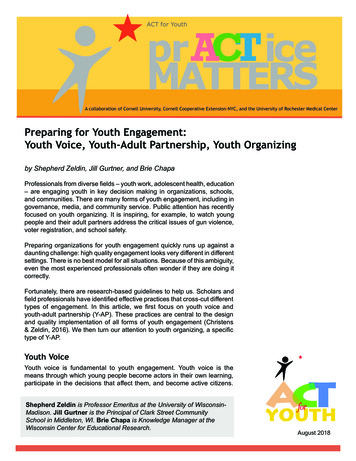
Children and Youth Services Review 87 (2018) 86–94E.V. Clemens et al.display the dramatic reduction in placement stability as length of timein care increases. Given that states are not required to track placementstability for youth who are in care for less than six months, it is unknown how much placement instability occurs during short-term care.Researchers found that students in out-of-home placements for less thansix months experienced fewer school moves per placement change thanthose in longer-term out-of-home placements (Clemens, Klopfenstein,et al., 2017).Table 1Student-level descriptive statistics for time-invariant characteristics.4. Purpose of the studyThis study describes reading, writing, and math academic growthtrajectories by testing the predictive power of age at first removal,duration of time in care, and the annual numbers of placement changesunassociated with a school change, school changes unassociated with aplacement change, and school changes associated with a placementchange. The purpose of this study is to identify key points in timeduring which public policies can deliberately support students in fostercare to mitigate the adverse impact of mobility events on academicgrowth. The actionable variables of interest include school changesassociated with a placement change, duration of time in care, and age atfirst removal.During first removal from homeMeanSDAge at first removalN of placements during first removalaN of school changes during first removalaN of school changes associated with placements during firstremovalaLength of first removal episode in monthsaTotal length of time in care in monthsCategorical variables 2008–2015Experienced more than one removal episodeFamily-like settings only (relative and non-relative foster homes)One or more congregate care placements (group home orinstitution)English language learner services eligible ever between 2008 and2015Special education services eligible ever between 2008 and 2015FemaleUnderrepresented racial minority (not White or te. Sample includes all students appearing in any of the reading, writing, and/or mathsamples.aSample size for all variables related to first removal is 7499 due to missing detaileddata on first removal episode for 175 youth.5. MethodPartnership for Assessment of Readiness for College and Careers(PARCC) assessment starting in Spring 2015. The PARCC tests aresufficiently different from prior assessment instruments that growthscores from 2014 to 15 were not calculated. Hence, analysis stops in2014.Decisions regarding describing the demographic characteristics ofthe sample were based upon how local education agencies reported thedata to the state education agency. Some cases had discrepancies acrossschool records, and those were resolved by first identifying the mostfrequently reported characteristic; if multiple modes were identified,the most recently reported mode was used. Table 1 presents time-invariant, student-level descriptive statistics for the sample.The first portion of Table 1 is a snapshot in time during the year offirst removal and is not representative of all youth in foster care (i.e.,age 0–21) because students in the sample are limited to grades 4–10(i.e., when growth data based on standardized testing are available). Inthis sample, the mean and standard deviation of age at first removalsuggests that the majority of these students were first removed from thehome as school-aged children. There was substantial variation in thelength of time students were in out-of-home care. On average, studentsin this sample experienced more placement instability than school instability.The second portion of Table 1 displays the categorical child welfareand education variables, which may inform alignment of public policiesand implementation of targeted support. The finding that nearly half ofstudents experienced one or more out-of-home placement in a congregate care setting suggests that efforts to improve academic growth ofstudents during out-of-home placements need to consider all types ofout-of-home settings, not just family-like foster homes. Alignment tospecial education policy, such as transition planning, and procedures isalso relevant, given that 40% of the sample was eligible for specialeducation services.5.1. SettingThe study was conducted in Colorado using state-level child welfareand education data. Facilitating data collection, each county uses thesame child welfare data system and the state human service agency hasdirect access to data entered at the county level. In this county-administered child welfare state, there are a total of 178 school districtsthat utilize a variety of information management systems. Each schooldistrict reports core information about each student to the state education agency. Using this combined state-level data allowed the research team to track child welfare placement changes, school moves,and academic achievement measures for students who moved acrosscounty and school district boundaries.The state human service agency and education agency have a datasharing agreement such that annually, state human service agency dataare used to create a flag in the education data set indicating a child wasin out-of-home care between July 1 and June 30th of that year. Inaddition to creating a flag in the education agency data set, the humanservices agency provides a standard set of additional information (e.g.,placement dates, placement types, reasons for placement changes) forresearch purposes. In this study, the match rate for these records wasapproximately 93%, meaning that approximately 7% of the humanservices records for school age children do not have a match in theeducation dataset. If a student is attending a private school or is notenrolled in school that year (i.e., has dropped out), then they may showunmatched records. It is also possible that some of these unmatchedrecords are attributable to errors in data entry.5.2. SampleThe sample (n 21,000 observations on 7600 students dependingon the subject area) in the current study consisted of a statewide sampleof students who were first removed from the home between July 1,2007, and June 30, 2014, were enrolled in grades 4–10 in a publicschool at any point in the same window, and had valid reading, writing,or math growth scores on one or more end of year assessments (excluding alternative assessments). This sample was inclusive of all gradelevels for which end of year academic growth data were available, requiring students to be tested in consecutive years. During the timeperiod examined, mandatory testing occurred in grades 3–10, so growthdata are available for grades 4–10. Colorado implemented the5.3. Measures5.3.1. Academic growth outcomesAcademic growth is the subject-specific comparison of a student'sachievement test score compared to the previous year test score.Growth scores were calculated by the state education agency using aquantile regression model.The student growth percentile tells us how a student's current test88
Children and Youth Services Review 87 (2018) 86–94E.V. Clemens et al.date of the new placement. Note: For a new placement that beginsduring the first week of December, school move is considered to beassociated with the placement if school entry date occurs between3 days prior to the placement start date and January 10. (Clemens,Klopfenstein, et al., 2017, p. 212).score compares with that of other similar students (students across thestate whose previous test scores are similar). This process can be understood as a comparison to members of a student's academic peergroup. So, Colorado's measure of growth is a normative rather than anabsolute one. (Colorado Department of Education, 2016, para. 3).By definition, the median growth percentile among students inevery grade across the state is 50. In other words, policymakers consider a student with a growth score of 50 to be making exactly one yearof growth in one year's time. Students with growth scores 50 areconsidered to be falling behind (or failing to maintain earlier gains)while students with growth scores 50 are considered to be catchingup (or building on earlier gains). The model was estimated separatelyfor math, reading, and writing using subject-specific student-levelgrowth percentiles in time t.In the summer months, different business rules were used to identifywhen a child welfare placement change likely triggered a school move:Initial or new placements beginning in the summer (May 1–August9): school move is considered to be associated with the placement ifschool entry date occurs between 3 days prior to the start date of thenew placement and August 31. (Clemens, Klopfenstein, et al., 2017, p.212).5.4. The regression model5.3.2. Stability measures5.3.2.1. Child welfare placements. Placement counts were defined as aninitial child welfare placement or subsequent child welfare placementsthat are counted as a change in placement under AFCAR rules.Placement counts were inclusive of family-like, congregate care, orother settings.The predictive power of child welfare placement changes and schoolmoves on student growth for math, reading and writing was modeled asfollows:Gist β0 β1 Xi β2 Wit β3 Ais (t 1) β4 Fit β5 Hit β6 Nit β7 Pit β8 Mit β9 Rit εist5.3.2.2. School moves. School moves were counted if students entered awhereColorado public school outside of the typical academic progression asdefined by Colorado Department of Education (2017). The total numberof school moves referred to all such non-normative school movesoccurring during the sample window regardless of whether studentswere removed from the home at the time. The count was inclusive ofpublic schools (including on-line and charter schools), but did notinclude transitions into private schools or facility schools. An entry intoa public school from a private school was counted. The count includedschool entries for students in kindergarten through 12th grade.and t ran from 7/1-6/30 each year unless otherwise indicated.The variables of primary interest were: Pit, the number of childwelfare placements in year t without an associated school change; Mit,the number of school changes without an associated child welfareplacement in year t; and Rit, the number of school moves and childwelfare placements that occur together in year t. It was hypothesizedthat average student growth in reading, math, and writing would all benegatively impacted by both child welfare placements and schoolmoves, while holding other variables in the model constant (β7 0and β8 0). It was expected that students experiencing child welfareplacement and school changes simultaneously would experience additional adverse effects (β9 0).Model coefficients were estimated while controlling for a removalepisode starting during the testing year with impacts allowed to differfor first removal (Fit) and subsequent removals (Hit). Both were expected to be negative (β4 0 and β5 0). The number of months astudent was out of the home from May–April in year t was also controlled for with Nit. β6 was expected to be positive because longer spellsout-of-home while holding the number of placement changes constantreflected greater stability.A time-varying student-level variable Ais(t-1) was included as an5.3.2.3. School moves associated with child welfare placements. Theoperational definition for identifying school moves that are associatedwith child welfare placements was based on prior work by Clemens andcolleagues. School moves were considered to be associated with a childwelfare placement change during the academic year according to thefollowing description:Initial or new placements beginning during the academic year(August 10–April 30, excluding the first week of December): schoolmove is considered to be associated with the placement if schoolentry dates occurs between 3 days prior to and 21 days after the start89
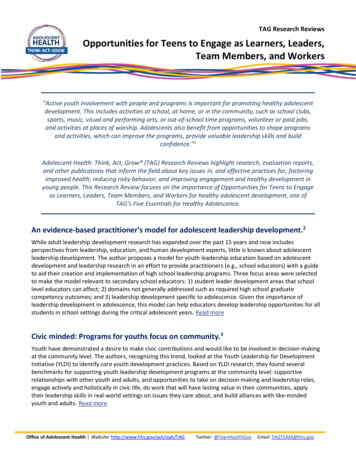
Children and Youth Services Review 87 (2018) 86–94E.V. Clemens et al.in the relative difficulty of tested subject matter, as well as a academicyear trend to account for variation in test items over time. Studentsappeared multiple times in the sample, so standard errors were clustered at the student level.Table 2Descriptive statistics for all observations in regression sample.Variable nameMeanSDGrowth percentile in t, ReadingGrowth percentile in t, WritingGrowth percentile in t, MathProficient or advanced in t-1, ReadingProficient or advanced in t-1, WritingProficient or advanced in t-1, MathRemoved for first time in May–April before testingRemoved for second time in May–April before testingMonths in out-of-home care in May–April before testingGrade in school when .9929.9329.7429.636. ResultsThe results of this study describe the academic growth trajectoriesof students who experienced foster care between 2008 and 2014. Thefindings are not limited to the time spent in out-of-home care, but instead provide insight into patterns in academic growth before, during,and after foster care. Many students are removed from the home priorto having completed the two consecutive years of testing necessary togenerate a growth percentile, so the entire sampling time frame must beconsidered to examine these variables. The proficiency and growthstatistics and regression model for the full sample are presented. Inthese statistics some, but not all students have available academic databefore, during, and after out-of-home care. Then, descriptive statisticsfor the subsample of foster students with valid academic growth datafor at least one year before, during, and after a single removal episodebetween 2008 and 2014 are reported.3.181.93Note. Mean and standard deviation (for continuous variable) based on the Math sample,N 21,063. Reading and writing achievement variables are based on slightly smallersamples: 20,884 and 20,929 respectively. These descriptive statistics reflect one observation for each year a student was enrolled in Colorado public schools and had a validgrowth score in reading, writing, or math. Thus, the sample contains multiple observations for the same students, but not necessarily the same number of observations for eachstudent.indicator for whether a student scored proficient or advanced (relativeto partially proficient/unsatisfactory) on the prior year assessment inthe same subject. If foster students on a strong academic path continueto do well, on average, it can be expected that β3 0. However, ifsupports decline once students reach the proficiency threshold, then itwould likely be β3 0. Regression to the mean would also result inβ3 0. On net, the expected sign of β3 was ambiguous.Xi was included as a vector of theoretically important time-invariantvariables for student i, including: age at first removal from the home;ever identified as eligible for English language learner services; everidentified as eligible for special education services; female; and, traditionally underserved racial minority (not White or Asian). Students whohave ever been identified as English language learners or as eligible forspecial education services typically struggle on standardized assessments. Female students tend to perform better on standardizedachievement tests than males in reading and writing, and recently thegender gap has closed in math (Institute of Education Sciences, 2017).Students from underrepresented racial minority groups tend not toperform as well across all subjects (Institute of Education Sciences,2017). Age at first removal was also included in this vector becausethere was not sufficient foster care literature to anticipate if initial removal from the home would have a greater disruption in academicgrowth for younger or older students.A linear grade-level variable was included to account for differences6.1. Proficiency and growth descriptive resultsStudents' growth scores indicate how students' achievement testscores in a given year compare to students who scored similarly in theprior year (Colorado Department of Education, 2016). Table 2 showsthat 30–42% of students in a given year were proficient or advanced inreading, writing, or math in the previous year and that student growthpercentiles in all subjects hovered around the 43rd percentile. Althoughthe 43rd percentile is within the range of “typical growth” as defined byCDE, it is below the 50th percentile that indicates making exactly onefull year's progress in a year's time (Colorado Department of Education,2016, para. 9). Thus, on average, child-welfare-involved youth startedeach school year below grade level and then continued to fall furtherbehind year-over-year.6.2. Regression model resultsThree s
Once part of the foster care system, studies have shown, anywhere from 22% to 70% of youth experience a placement disruption each year (Blakey et al., 2012). Findings also suggest that lack of integration into the new out-of-home placement increases the likelihood of further placement disruption in the future (Leathers, 2006).