Transcription
PTC System Monitor(PSM)Jason HallJune 2015
Agenda What is PTC System Monitor (PSM)? Why use PSM? Solution ntsMonitored TransactionsDashboards Analyzing Data Success Stories FAQs Questions2
What is PTC System Monitor (PSM)? PTC System Monitor (PSM) is a complete systems monitoring solution– Monitors both System and Application level PSM is customized solution built on Compuware’s dynaTrace product– dynaTrace is the Leader in the Application Performance Monitoring (APM) market It is PTC’s standardized monitoring solution– Many PTC products have PSM solutions More that just a monitoring solution– Supports custom actions– Supports third party plugin’s3
Why use PSM? Core Systems Monitoring– CPU, Memory, Disk Space, etc Integrity Transaction Monitoring– Items, Queries, Checkpoints, Admin Operations, etc– Monitor deadlocks & contention Custom Actions– Email Notifications when an issue is detected– Automated stacktrace, heapdump collection Faster Issue Resolution– Speeds up PTC support analysis– Helps facilitate self assistance Planning and Trending– Track how many licenses are in use4
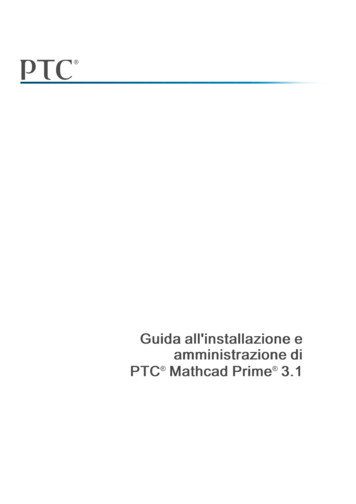
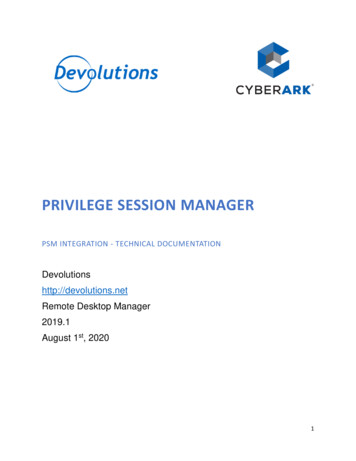
Solution OverviewSolution Architecture PSM supports a distributed deployment with minimal overhead Agents are embedded in the Integrity Server for optimal monitoring Rich client for analysis and dashboards Collectors bundle the raw data for optimized WAN transfer to PSM ServerAdministrator5
Solution OverviewInstrumented Areas Core Integrity Server– Items, Computations, Triggers– Queries, Reports, Charts, Dashboards Proxies, Staging Server– Proxies are monitored for CPU, Memory, Disk Space, etc.– Integrity Staging servers are monitored like a normal Integrity Server Integrity Client– All CLI usage– Some GUI usage Web Interface– The web interface itself is not instrumented however the backing server operations are6
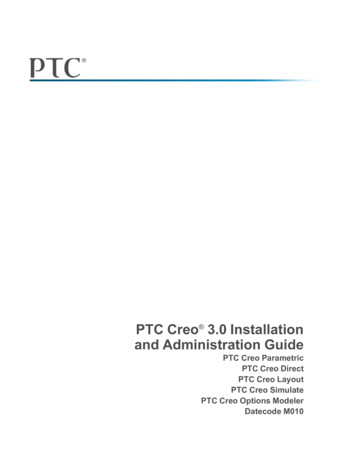
Solution OverviewPurePaths PSM PurePaths are Integrity Transactions– For example, a PurePath could be a Source Checkpoint or a Query execution– PurePaths capture all the guts of the transaction (user, SQL, method execution, etc)Drill down into theraw SQL from thePurePath!7
Solution OverviewIncidents A PSM Incident is triggered when a Business Transaction passes itsthreshold. Incidents trigger appropriate actions:–––––––Thread DumpHeap DumpPSM Session DumpExecute Integrity Diag’sSend emailsExecute custom scripts/appsAnd more!8
Solution OverviewBusiness Transactions Many out of the boxmonitored transactions Most transactions are sorted byuser Provides quick and easy way to findtransactions Incident thresholds can becustomized for various BusinessTransactions9
Solution OverviewIntegrity Systems Overview Dashboard Single health status iconper server Displays current healthstate and historic Heath icon is anaggregation of allincident status’10
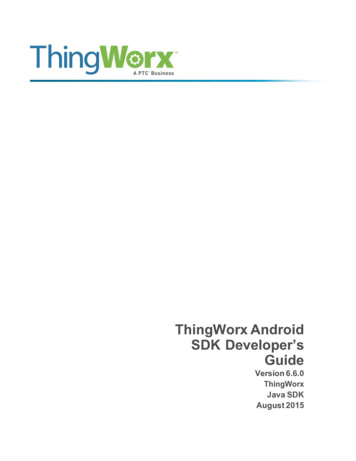
Solution OverviewIntegrity Server Dashboard Provides quick view intothe application state JVM Memory, CPU,Threads, etc are graphed Critical status icons aredisplayed at the top Graphs can be zoomedinto and can drill downinto correspondingtransactions11
Solution OverviewBusiness Transactions Overview Dashboard Quick view into all Integrity transactions counts, runtimes (avg & max) andfailure rate12
Solution OverviewHost Health Dashboard Displays all criticalsystem information CPU, Memory, DiskNetwork, etc OS and VM details13
Solution OverviewDatabase Dashboards Oracle and MS SQL Dashboardsincluded OOTB14
Analyzing Data Examples High Application CPU Usage– This example will go through a situation where a ‘High Application CPU Usage’ Incident was triggered*Sort PurePaths by CPU SumIncident action automatically collectsThread Dumps as wellForward looking information subject to change without notice15
Analyzing Data Examples High Application Memory Usage– This example will go through a situation where a ‘High Application Memory Usage’ Incident was triggeredPSM does not capture memory usage data pertransaction. The only definitive way to determinewhat caused the spike.PSM automatically collects a Heap Dump when theHigh Application Memory Usage incident fires.Forward looking information subject to change without notice16
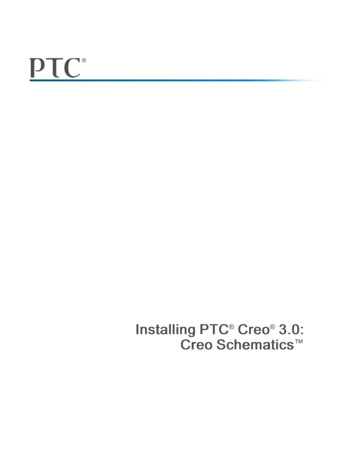
Analyzing Data Examples Slow Business Transaction– This example will go through a situation where a ‘Slow Business Transaction’ Incident was triggeredHere you can see the JDBC API is the main culpritActual database queries that contributed to the slowness:Forward looking information subject to change without notice17
Success Stories TRW Automotive– “PSM for Integrity has been helpful to us in a multitude of areas. We now get immediatenotification for high impact events. We get “At a Glance” system and server health monitoring.We’ve been able to compare performance from any given day to any other over time. On a dailybasis, we can even locate the users running the longest running interactions and identify whatthey’re doing for use in further analysis. The additional information is also helpful in reducing theturnaround time for our PTC support tickets.“Chris Segard – TRW Automotive Huawei– “With PSM we are able to monitor the performance of our systems at all time. And when we doperformance testing, PSM helps us identify the root cause much faster. This then speeds up theinteraction with PTC Support and R&D.”Echo Denghui – Huawei Technologies18
FAQ’s How much does PSM cost?– PSM is free to all PTC customers who have active maintenance What other Applications does PSM support?– PSM also supports Windchill, FlexPLM, Servigistics, Axeda What additional hardware is needed for PSM?– A separate monitoring server is needed (64bit, 8GB Ram, 4 core, 50GB storage) Where can I get PSM?– PSM is available for download on the PTC downloads site under the Integrity Product Is there training available?– Training video’s can be found on the PSM site– Training can also be requested through PTC University Where can I get more information?– More info can be found at our PSM site and our PSM Knowledge Base Article19
Questions20
PSM is customized solution built on Compuware's dynaTrace product -dynaTrace is the Leader in the Application Performance Monitoring (APM) market It is PTC's standardized monitoring solution -Many PTC products have PSM solutions More that just a monitoring solution -Supports custom actions -Supports third party plugin's