Transcription
SLAC-PUB-12545astro-ph/0704.0255The Astrophysical Journal, submittedPreprint typeset using LATEX style emulateapj v. 10/09/06June 2007MODELING THE GALAXY THREE-POINT CORRELATION FUNCTIONFelipe A. Marı́n1,* , Risa H. Wechsler1,2 , Joshua A. Frieman1,3 and Robert C. Nichol4Submitted to The Astrophysical JournalABSTRACTWe present new theoretical predictions for the galaxy three-point correlation function (3PCF) using high-resolution dissipationless cosmological simulations of a flat ΛCDM Universe which resolvegalaxy-size halos and subhalos. We create realistic mock galaxy catalogs by assigning luminositiesand colors to dark matter halos and subhalos, and we measure the reduced 3PCF as a function ofluminosity and color in both real and redshift space. As galaxy luminosity and color are varied,we find small differences in the amplitude and shape dependence of the reduced 3PCF, at a levelqualitatively consistent with recent measurements from the SDSS and 2dFGRS. We confirm that discrepancies between previous 3PCF measurements can be explained in part by differences in binningchoices. We explore the degree to which a simple local bias model can fit the simulated 3PCF. Theagreement between the model predictions and galaxy 3PCF measurements lends further credence tothe straightforward association of galaxies with CDM halos and subhalos.Subject headings: cosmology: large-scale structure of universe — galaxies: formation — galaxies:statistics — galaxies: halos1. INTRODUCTIONObservations of the higher-order statistics of the galaxydistribution can provide fundamental tests of the standard cosmological model. For example, higher-order correlation functions of the mass are predicted to be zeroin linear perturbation theory for Gaussian initial conditions, which are expected in the simplest inflation modelsof the early Universe (Peebles 1980, Bernardeau et al.2002, Szapudi 2005 and references therein). In thelate Universe, however, non-linear gravitational clustering and biased galaxy formation lead to non-Gaussianityin the galaxy density field, resulting in non-zero connected N-point correlation functions (NPCFs) with N 2. By studying higher-order galaxy statistics on largescales, we can test the nature of the initial conditions;on smaller scales, the NPCFs can constrain models ofbiased galaxy formation (e.g., Fry & Gaztanaga 1993;Frieman & Gaztanaga 1994) and the relationship between galaxies and their host dark matter halos.The three-point correlation function (3PCF, or ζ), andits Fourier-space equivalent, the bispectrum, are the firstin the hierarchy of higher-order statistics and measurethe shape dependence of the number of galaxy tripletsas a function of scale. The 3PCF is sensitive to, for example, the shapes of dark matter halos and the presenceof filamentary structures in the large-scale structure ofthe Universe (Sefusatti & Scoccimarro 2005). Since thepioneering work of Peebles and collaborators (see Peebles1980 and references therein), there have been many measurements of the 3PCF and bispectrum using a variety of1 Department of Astronomy & Astrophysics, Kavli Institutefor Cosmological Physics, The University of Chicago, Chicago, IL60637 USA2 Kavli Institute for Particle Astrophysics & Cosmology, PhysicsDepartment, and Stanford Linear Accelerator Center, StanfordUniversity, Stanford, CA 943053 Center for Particle Astrophysics, Fermi National AcceleratorLaboratory, P.O. Box 500, Batavia, IL 60510 USA4 Institute of Cosmology & Gravitation,University ofPortsmouth, Portsmouth, PO1 2EG, UK* e-mail: fmarinp@uchicago.eduangular (Peebles & Groth 1975; Gaztanaga & Frieman1994; Frieman & Gaztañaga 1999; Huterer et al. 2001;Szapudi et al. 2001, 2002; Ross et al. 2006) and redshift (Gaztanaga & Frieman 1994; Jing & Börner1998; Verde et al. 1998; Scoccimarro et al. 2001;Feldman et al. 2001; Jing & Börner 2004) catalogs.There has also been considerable theoretical workto understand the 3PCF and bispectrum using nonlinear perturbation theory (see Bernardeau et al. 2002and references therein) and cosmological simulations(Barriga & Gaztañaga 2002; Scoccimarro et al. 1999;Gaztañaga & Scoccimarro 2005; Hou et al. 2005).In recent years, there has been renewed interest in the 3PCF due to the availability of largeredshift surveys. These surveys now provide boththe volume and the number of galaxies requiredto make robust measurements of the 3PCF over arange of scales.For example, recent papers byKayo et al. (2004), Hikage et al. (2005), Nichol et al.(2006), Nishimichi et al. (2006), Kulkarni et al. (2007)have presented measurements of the 3PCF from theSloan Digital Sky Survey (SDSS; York et al. 2000)as a function of scale, galaxy luminosity, and color.Nichol et al. (2006) also quantified the effect of largescale structures on the shape dependence of the 3PCF.Likewise, several recent papers (Jing & Börner 2004;Baugh et al. 2004; Croton et al. 2004; Gaztañaga et al.2005; Pan & Szapudi 2005; Croton et al. 2006) providenew measurements of the 3PCF and high-order correlations from the Two-degree Field Galaxy Redshift Survey(2dFGRS; Colless et al. 2001).The main results from these recent SDSS and 2dFGRS analyses of the 3PCF are: i) on large scales, theobserved 3PCF is in qualitative agreement with expectations for the growth of structure from Gaussian initialconditions; ii) on smaller scales (i.e., in the non-linearand weakly non-linear regimes), the 3PCF measured inredshift space scales with the redshift-space two-pointcorrelation function (2PCF, or ξ) as ζ ξ 2 , consistent with the “hierarchical clustering” ansatz (PeeblesWork supported in part by US Department of Energy contract DE-AC02-76SF00515
2Marı́n, Wechsler, Frieman and Nichol1980); iii) the shape dependence of the reduced 3PCFdepends at most weakly on galaxy luminosity; iv) theamplitude of the 3PCF is larger for elongated triangleconfigurations than for more symmetric triangle shapes(Gaztañaga & Scoccimarro 2005; Gaztañaga et al. 2005;Nichol et al. 2006; Kulkarni et al. 2007) — again consistent with expectations from non-linear clustering theory.It is important to make detailed comparisons of these3PCF observations with theoretical predictions that incorporate a realistic prescription for modeling galaxies and that account for observational effects such asredshift-space distortions. Such comparisons can be carried out in two ways: either the observations can becorrected for the redshift-space effects and compared totheory in real space, e.g., using the projected 3PCF(Zheng 2004), which is analogous to the projected 2PCF(Zehavi et al. 2005), or one can build mock galaxy catalogs from cosmological simulations and measure the theoretical 3PCF directly in redshift space. Since we alsohave access to the real-space 3PCF from such mock catalogs, we can investigate in detail the relationship betweenthe real- and redshift-space correlation functions.In this paper, we pursue the second of these methodologies, using state-of-the-art high-resolution dissipationless dark matter cosmological simulations. These simulations have the spatial resolution required to identify the dark matter (DM) halos and subhalos thathost individual galaxies and at the same time encompass a large enough volume to probe large-scale structure in a statistically reliable way. The model we useassigns galaxy properties (luminosity, color, etc.) directly to these DM galactic halos and subhalos using simple, empirically-based assumptions about theseproperties. This approach differs in both assumptionsand the resolution required from methods which buildgalaxy catalogs by statistically assigning several galaxies to each (more massive) halo using a Halo Occupation Distribution (HOD; e.g. Berlind & Weinberg 2002;see Kulkarni et al. (2007) for constraints on HOD parameters from the SDSS Luminous Red Galaxy sample’s3PCF) or from semi-analytic methods. The method usedhere was first implemented by Kravtsov et al. (2004),and has been applied successfully to different statistical studies, including the 2PCF (Conroy et al. 2006),galaxy-galaxy lensing (Tasitsiomi et al. 2004), and closepair statistics (Berrier et al. 2006) among others (see alsoVale & Ostriker 2004, 2006; Conroy et al. 2007). Herewe extend the study of this model to the 3PCF as afunction of luminosity, color, and redshift. Where possible, we make direct comparisons in redshift space withrecent observations.In §2, we describe the simulations used in this paperand our methods for constructing mock galaxy catalogsbased on resolved DM halos. We also review the techniques used to estimate the NPCFs. In §3, we presentmeasurements of the 3PCF in both real and redshiftspace for both the dark matter and galaxy catalogs, whilein §4, we study the dependence of the model 3PCF ongalaxy luminosity and color. In §5, we compare themodel 3PCF with SDSS observations and discuss the effects of binning. We relate the 3PCF to a simple nonlinear bias model in §6. In §7, we summarize and discussour findings.2. METHODS2.1. Dark matter simulationsWe investigate clustering statistics using cosmologicalN -body simulations of structure formation in the concordance, flat ΛCDM cosmology with ΩΛ 0.7 1 Ωm ,h 0.7, and σ8 0.9, where Ωm , ΩΛ are the presentmatter and vacuum densities in units of the critical density, h is the Hubble parameter in units of 100 km s 1Mpc 1 , and σ8 specifies the present linear rms mass fluctuation in spheres of radius 8 h 1 Mpc. The simulationsused here were run using the Adaptive Refinement TreeN body code (ART, see Kravtsov et al. 1997 for details), which implements successive refinements in spaceand time in high-density environments. The primarysimulation box we use is 120 h 1 Mpc on a side (hereafter,L120); the number and mass of each dark matter particleare Np 5123 1.34 108 and mp 1.07 109 h 1 M respectively. This simulation has been previously usedto measure several properties of dark matter halos andsubhalos (e.g., Allgood et al. 2006; Wechsler et al. 2006;Conroy et al. 2006; Berrier et al. 2006). In order to include more massive halos and study the effects of thesize of the sample in the statistical analysis, we also usea second simulation with the same cosmological parameters in a bigger box, with 200 h 1 Mpc on a side (whichwas also used to measure halo shapes in Allgood et al.2006). This box contains Np 2563 particles with massmp 3.98 1010 h 1 M , therefore it will lack low mass(and luminosity) objects that are included in the L120box.From these dark matter samples, virialized concentrations of particles are identified as halos. In order to findthese halos and their constituent subhalos (concentrations of virialized matter inside bigger halos), a variantof the Bound Density Maxima halo finding algorithm ofKlypin et al. (1999) is used. This algorithm assigns densities to each particle using a smoothing kernel on the 32nearest neighbors; centering on the highest-overdensityparticle, each center is surrounded by a sphere of radiusrfind 50h 1 kpc. The algorithm removes unbound particles when calculating the properties of the halos.Henceforth, we will use the terms “distinct halo” tomean any halo that is not within the virial radius of alarger halo, “subhalo” to indicate a halo that is withinthe virial radius of a larger halo, and “galactic halo” torefer to the halo directly hosting a galaxy. Using thisterminology, the galactic halo of a satellite galaxy is asubhalo while the galactic halo of a central or isolatedgalaxy will be a distinct halo.2.2. From halos to ‘galaxies’The primary galaxy samples used here are created byassigning galaxy luminosities and colors drawn from theSDSS redshift survey to dark matter halos and subhalos, using the maximum circular velocity at z 0, Vmax ,as an indicator of the halo virial mass. A luminosity(in the r band) is assigned to each halo by matchingthe cumulative velocity function n( Vmax ) of all galactic halos (distinct halos and subhalos) to the observedSDSS r-band luminosity function (Blanton et al. 2003b)at z 0.1 (the approximate mean redshift of the mainspectroscopic SDSS galaxy sample used to estimate theluminosity function). To correct to z 0 magnitudes,
Modeling galaxy three-point statisticsments of both clustering statistics and of the propertiesof galaxies in groups and clusters should help to furtherrefine these galaxy assignment models.TABLE 1Subsamples at z pleAll objects Mrh 19 19 Mrh 20 20 Mrh 21red (g r 0.7)blue (g r 0.7)All objects Mrh 20 20 Mrh 21 21 Mrh 22red (g r 0.7)blue (g r 0.7)Numberof 237483Density[(h 1 Mpc) 3 ]1.5 10 28.9 10 34.7 10 35.8 10 38.9 10 35.4 10 33.8 10 31.2 10 32.2 10 32.9 10 3we use the code kcorrect v3 2 (Blanton et al. 2003a).Since the limited size of the box gives us an upper limiton the luminosities which can be reliably studied (in thestatistical sense), and at the same time we cannot sample the lowest-luminosity objects due to limited spatialresolution, for the L120 box we present results for galaxies in the absolute magnitude range 19 Mrh 22,where Mrh Mr 5 log h. The L200 box has a lower resolution, therefore it contains only brighter objects, withMrh 20. In order to assign colors to the galaxies,we use the procedure described by Wechsler (2004) andTasitsiomi et al. (2004). This method uses the relationbetween local galaxy density (defined as the distance tothe tenth nearest neighbor brighter than Mrh 19.7and within cz 1000 km/s) and color observed in theSDSS, using the CMU-Pitt Value Added Catalog constructed from DR1 (Abazajian et al. 2003), to assign acolor to each mock galaxy. We use the distant observerapproximation (Bernardeau et al. 2002) to obtain positions in redshift space. Table 1 describes the subsamplesused in this study.Although the general association of galaxies with darkmatter subhalos seems quite robust, the detailed association of galaxy properties with subhalo properties isless clear. While galaxy luminosity is expected to bequite tightly connected to velocity, the circular velocityof a given subhalo decreases with time due to tidal stripping as it interacts with its host halo. Observable galaxyproperties such as luminosity and color will likely be lessaffected by this process. This implies that galaxy observables may be more strongly correlated with Vmax,acc ,the maximum circular velocity of the halos at the moment of accretion onto their host, than with the currentmaximum circular velocity, Vmax,now . This conclusionis supported by measurements of two-point statistics onboth large and small scales in simulations (Conroy et al.2006; Berrier et al. 2006). Motivated by these considerations, we construct galaxy catalogs using both Vmax,accand Vmax,now . We also use galaxy catalogs at differentredshifts in order to study the evolution of the 3PCFwith time. All these additional catalogs use the L120 boxand have the same spatial density as the sample of halosselected by Vmax,now . We note that the model for assigning color is also not uniquely determined. It is, however, sufficient to match the two-point clustering lengthfor red and blue galaxies and several observed propertiesof galaxy clusters (Zehavi et al. 2005). Future measure-2.3. Measuring the 3PCFJust as the 2PCF measures the excess probability offinding two objects separated by a distance r, the 3PCFdescribes the probability of finding three objects in aparticular triangle configuration compared to a randomsample. The probability of finding three objects in threearbitrary volumes dV1 , dV2 and dV3 is given by (Peebles1980)P [1 ξ(r12 ) ξ(r23 ) ξ(r31 ) ζ(r12 , r23 , r31 )] n̄3 dV1 dV2 dV3 ,(1)where n̄ is the mean density of the objects, ξ is the 2PCF,and ζ is the 3PCF:ξ(r12 ) hδ(r1 )δ(r2 )i(2)ζ(r12 , r23 , r31 ) hδ(r1 )δ(r2 )δ(r3 )i;(3)here δ is the fractional overdensity in the dark matterfield or in the distribution of galaxies. Since the 3PCFdepends on the configuration of the three distances, itis sensitive to the 2-D shapes of the spatial structures,at large and small scales (Sefusatti & Scoccimarro 2005;Gaztañaga & Scoccimarro 2005). Motivated by the “hierarchical” form of the N-point functions, ζ ξ 2 , foundby Peebles & Groth (1975), we use the reduced 3PCFQ(r, u, α) to present our results:Q(r, u, α ) ζ(r, u, α).(4)ξ(r12 )ξ(r23 ) ξ(r23 )ξ(r31 ) ξ(r31 )ξ(r12 )This quantity is useful since Q is found to be close tounity over a large range of scales even though ξ and ζ varyby orders of magnitude (Peebles 1980). To parametrizethe triangles for the 3PCF measurements, r r12 setsthe scale size of the triangle, while the shape parameters are given by the ratio of two sides of the triangle, u r23 /r12 , and the angle between the two sidesof the triangle α cos 1 (r̂12 · r̂23 ), where r̂12 , r̂23are the unit vectors of the first two sides. FollowingGaztañaga & Scoccimarro (2005), triangles where α isclose to 0 or 180 are referred to as “elongated configurations”, while those with α 50 120 are referredto as “rectangular configurations”,We calculate the 2PCF using the estimator ofLandy & Szalay (1993),DD 2DR RR.(5)ξ RRHere, DD is the number of data pairs normalized byND ND /2, DR is the number of pairs using data andrandom catalogs normalized by ND NR , and RR is thenumber of random data pairs normalized by NR NR /2.The 3PCF is calculated using the Szapudi & Szalay(1998) estimator:DDD 3DDR 3DRR RRR,(6)ζ RRRwhere DDD, the number of data triplets, is normalized3by ND/6, and RRR, the random data triplets, is nor2malized by NR3 /6. DDR is normalized by NDNR /2, and2DRR by ND NR .
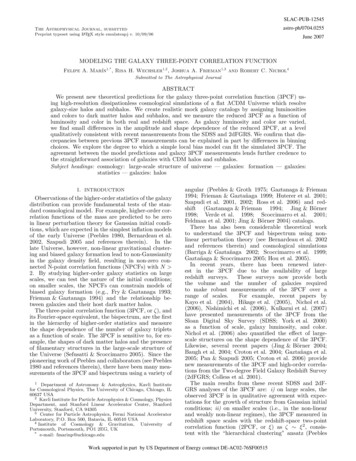
4Marı́n, Wechsler, Frieman and Nichol2.521.510.5110Fig. 1.— The reduced 3PCF, Qeq (r), for equilateral triangles in the L120 box. Left: Results in real space. Thick solid line (black): darkmatter; thin solid line (black): galactic halos selected by Vmax,now at z 0; short-dashed (green): galactic halos selected by Vmax,now atz 1; dotted (red): galactic halos selected by Vmax,now at z 2; long-dashed (blue): galactic halos selected by Vmax,acc at z 0; thicklong-dashed (red): leading-order perturbation theory, dark matter. Right: Results in redshift space. Line types correspond to the samedark matter and halo samples as in the left-hand plot. Error bars are calculated using jack-knife resampling and are only shown for one ofthe samples for 00150 050100150 050100150050100150050100150Fig. 2.— Measurement of the reduced 3PCF as a function of triangle shape, Q(α), for different scales r, with side ratio u r23 /r12 2fixed. Left: Results in the L120 box for r 0.75, 1.5, and 3 h 1 Mpc (from left to right) in real space (top panels) and redshift space(bottom panels) for dark matter and galaxies; line types correspond to the same dark matter and halo samples as in Figure 1. Right:Results in the L200 box for r 6 (left) and 9 h 1 Mpc (right) in real (top) and redshift space (bottom); Thick solid line (black): darkmatter; open circles: galaxies in halos selected by Vmax,now at z 0; thin solid line (blue): predicted galaxy 3PCF using the dark matter3PCF Qdm and eqn. (10) with best-fit bias parameters c1 , c2 obtained from fitting the galaxy 3PCF at r 9h 1 Mpc (see §6); longdashed (red): leading order non-linear perturbation theory prediction for dark matter reduced 3PCF. Error bars calculated using jack-kniferesampling method.We estimate the errors using jack-knife re-sampling.From each galaxy catalog, we construct sixteen subsamples of L120 or L200; within each of them we remove adifferent region (30 602 (h 1 Mpc)3 for the L120 box,and 50 1002 (h 1 Mpc)3 for the L200 box). The varianceσJK of Q is calculated as:N2σJKN 1X(Qi Q̄i )2 , N i 1(7)where N 16 is the number of subsamples, Qi is thevalue for the i th subsample, and Q̄i is the mean of theQi . We note in passing that the validity of jack-kniferesampling as a method to estimate the errors has notbeen explicitly tested with mock catalogs for three-pointstatistics. Although it is beyond the scope of this paper,this may be an interesting topic of future investigationespecially once the statistical power of the measurementsimproves.
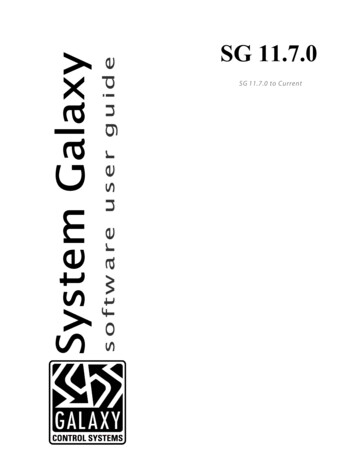
Modeling galaxy three-point statisticsTo compute the 2PCF and 3PCF, we use the NPTsoftware developed in collaboration with the Auton Labat Carnegie Mellon University. NPT is a fast implementation of the NPCFs using multi-resolution kd-trees tocompute the number of pairs and triplets in a dataset.For more details and information on the algorithm, seeMoore et al. (2001), Gray et al. (2004), and Nichol et al.(2006).3. THE 3PCF OF GALAXIES AND DARK MATTERWe estimate the reduced 3PCF for the distribution ofdark matter and for galaxies for different triangle configurations, focusing on the scale and shape dependenceof the 3PCF. We also investigate its time evolution andhow it depends on the selection criterion for subhalos.We study Q(r, u, α) in both real and redshift space, inorder to compare our results with current observationsand disentangle galaxy biasing effects from those whichare consequences of redshift distortions.In order to distinguish scale and, most importantly,shape effects, and to keep the errors as small as possible, we have chosen an intermediate-resolution binningscheme. For studies of equilateral triangles (u 1 andα π/3 rad), we use bins of size log(r) 0.1. Formeasurements of the shape dependence of the 3PCF, weuse triangles with four different scales r12 0.75, 1.5,3, 6, and 9 h 1 Mpc, with scale bin size r 0.3r ,shape parameter u 2, and angular bin size α π/15rad. This resolution is sufficient to see the most important features of the 3PCF even on small scales, althoughit is not sufficient to distinguish the “finger-of-god” effect at the smallest scales in redshift space, where Q(α)varies very little except at very small or elongated angles, where it increases to many times the mean value(Gaztañaga & Scoccimarro 2005).3.1. The 3PCF in real spaceFigures 1 and 2 show the 3PCF for dark matter particles and for galaxies from the L120 and L200 simulations. Here we plot results for dark matter (thick solidline), galaxies in halos selected by Vmax,now (thin solidline), and galaxies in halos selected by Vmax,acc (longdashed line) for z 0 and for halos selected by Vmax,nowat z 1 (short-dashed line) and z 2 (dotted line).Figure 1 shows the reduced 3PCF for equilateral triangles, Qeq (r), in real (left panel) and redshift space (rightpanel). In real space, the reduced 3PCF for the darkmatter is only weakly scale dependent on small scales,decreases rapidly with increasing scale around r 3h 1Mpc, and falls off more slowly on larger scales. Thisbehavior is broadly consistent with previous N-body results (e.g. Scoccimarro et al. 1998) and with expectationsfrom leading order non-linear perturbation theory on thelargest scales (shown as the thick red long-dashed curvein Figure 1 left panel), with loop-corrected perturbationtheory on intermediate scales where the rms perturbation amplitude δ(r) is of order unity (the transition tothe strongly non-linear regime), and with quasi-stablehierarchical clustering on the smallest scales. Tests withthe L200 box indicate that the downturn in Qeq for darkmatter at scales larger than r 8h 1 Mpc is likely dueto finite volume effects.At scales below r 10h 1 Mpc, the dark matter Qeq islarger than that for the galaxies; this behavior is broadly5expected if galaxies are more strongly clustered than(positively biased with respect to) the mass, cf. eqn.(10).At higher redshift, evolution is seen in Qeq (r) that is consistent with expectations from non-linear gravitationalevolution: on the largest scales, the amplitude of Qeq isunchanging, as predicted from leading order perturbationtheory, while the sharp break associated with the transition to the strongly non-linear regime moves to largerscales as the density perturbation amplitude increaseswith time.Comparing results for subhalos selected by Vmax,nowand by Vmax,acc , differences in the amplitude of Qeq appear on small scales, r . 3 h 1 Mpc. In halo-modellanguage, on these scales the 3PCF is sensitive to theinternal structure of halos, i.e., to the one- and two-haloterms, while the three-halo term dominates the 3PCF onlarger scales (Wang et al. 2004; Takada & Jain 2003).In Figure 2, the top panels show how the reduced3PCF depends on triangle shape in real space. In general, the 3PCF for elongated configurations is greaterthan for rectangular configurations. This is a consequence of the fact that, in non-linear gravitational instability, velocity flows tend to occur along gradients ofthe density field (Bernardeau et al. 2002). The 3PCF islarger for dark matter than for galaxies for all shapesand scales, although the difference is larger for elongatedconfigurations. The difference in 3PCF amplitude between rectangular and elongated configurations is largeron large scales, in broad agreement with theoretical predictions (Bernardeau et al. 2002): on large scales, thestrong shape dependence is determined by perturbativenon-linear dynamics; on smaller scales, the shape dependence is washed out since the coherence between the velocity and density fields gives way to virialized motions.This scale dependence of the 3PCF shape is also reflectedin the redshift evolution: in the L120 box (left panel),the galaxy 3PCFs at z 1 and 2 (green-dashed andred-dotted curves) essentially retain the primordial shapedependence of leading-order non-linear perturbation theory, i.e., at those redshifts, these scales are still close tothe quasi-linear regime. At r 3 h 1 Mpc, the largestevolution in Q(α) is found for elongated configurations.As was seen in Figure 1, the effect of changing halo selection from Vmax,acc to Vmax,now on the 3PCF shape appears only on small scales, r . 1.5h 1 Mpc, i.e., roughlywithin the scale of a typical cluster-mass host halo.On the larger scales probed in the L200 box (rightpanel of Figure 2), the galaxy reduced 3PCF (open circles) tracks the shape of the dark matter 3PCF fairlywell. The difference between the galaxy and dark matter3PCF amplitudes on these scales is reasonably well fitby a simple bias prescription: the thin blue curve is thebiased 3PCF that results from fitting the galaxy 3PCFwith eqn. (10); see §6. We also see that the jack-knifeerrors increase on the largest scales, where the effects ofthe finite box size start to become evident. For comparison, the red long-dashed curve is the 3PCF of the darkmatter from leading-order non-linear perturbation theory (Bernardeau et al. 2002; Jing & Borner 1997). Onthe largest scales, it is in reasonable agreement with themeasured 3PCF for the dark matter.3.2. The 3PCF in redshift space
6Marı́n, Wechsler, Frieman and Nicholother. With regard to halo selection, as in real space wefind that QV max,now QV max,acc, but the differencesbetween them are smaller than in real space.Together, these results suggest that the shape and scaledependence of the reduced 3PCF in redshift space on thescales shown here are largely determined by redshift distortions, with non-linear gravitational evolution playinga subdominant role.2by luminosityby colorreal spacereal spaceby luminosityredshift spaceby colorredshift space1.510.504. OBSERVING THE 3PCF: LUMINOSITY AND COLORDEPENDENCE10.50110110Fig. 3.— The reduced 3PCF, Q(r), for equilateral triangles as afunction of galaxy luminosity and color in real and redshift space.Top left: Qeq (r) in real space for galaxies divided into luminositybins; long dash-dotted (cyan): 19 Mrh 20; short-dashed(green): 20 Mrh 21; dotted (magenta): 21 Mrh 22.The brightest sample comes from the L200 box, the other two arefrom the L120 box. Bottom left: Results in redshift space; linetypes correspond to the same galaxy samples as in the top leftpanel. Top right: Qeq (r) in real space for galaxies divided according to color, using the L120 box; long-dashed (red): red galaxies(g r 0.7); short dash-dotted (blue): blue galaxies (g r 0.7).Bottom right Results in redshift space; line types correspond tothe same galaxy samples as in the top right panel. Error bars arecalculated using jack-knife respampling.Redshift distortions have been studied in depth (andare a useful tool to constrain cosmological parameters)for the power spectrum (e.g., Bernardeau et al. 2002;da Ângela et al. 2005; Tinker 2007) and for the bispectrum (Scoccimarro et al. 1999; Verde et al. 2002;Sefusatti et al. 2006). Some comparisons have beenmade for the 3PCF as well (Matsubara & Suto1994; Takada & Jain 2003; Wang et al. 2004).Gaztañaga & Scoccimarro (2005) found that theredshift distortions do not have a strong dependence onthe cosmological parameters.The right panel of Figure 1 and the bottom panelsof Figure 2 show the 3PCF in redshift space. The firstfeature that can be seen is a dramatic decrease in theamplitude and in the scale and shape dependence of Qcompared to the real-space measurements. For example, for equilateral triangles, the redshift space Qz (r)is reduced compared to the real space Q(r) at smallscales and increased with respect to the real-space results on larger scales. The overall effect is that Qz (r)is nearly scale-independent, i.e., the clustering appearsmore hierarchical in redshift space (Suto & Matsubara1994; Matsubara & Suto 1994; Scoccimarro et al. 1999).Moreover, in redshift space, the suppression of the galaxy3PCF relative to that of the dark matter is apparenton all scales; it appears to be relatively independent ofscale and configuration and is larger than the relativesuppression in real space, consistent with earlier results(Wang et al. 2004; Gaztañaga et al. 2005). It also appears that there is very little redshift evo
larger halo, "subhalo" to indicate a halo that is within the virial radius of a larger halo, and "galactic halo" to refer to the halo directly hosting a galaxy. Using this terminology, the galactic halo of a satellite galaxy is a subhalo while the galactic halo of a central or isolated galaxy will be a distinct halo. 2.2.