Transcription
3iIS “PROBABLE MAXIMUMLOSS” (PML) A USEFUL CONCEPT?JOHN S. McGUINNESSPurpose of this Paper. The term “PML” or “probable maximum loss”is one of the most widely used terms #in property insurance underwriting.But it represents one of the least clear concepts in all insurance. This factis reflected by the results of a four-year study that involved collecting thepersonal and company definitions of PML from over one hundred underwriters and underwriting executives. No two of their definitions fully agree.In the absence of a clear and specific meaning, the term can be a trueinvitation to disaster, because it thus provides a foundation of sand for thequantitative part of risk selection. The Lake Charles, Louisiana, oil refineryand McCormick Place, Chicago, fires of the 1960’s dramatically demonstrated this fact to several insurers. On the other hand, if buttressed by aclear and specific definition and if based on properly collected and analyzedfacts, the term can be an extremely useful and valuable tool. The purposeof this paper is to show how it can be made such a tool by suggesting (1)a precise definition, (2) how accuracy of PML estimates is related to thestability of a portfolio of risks, and (3) methods of measurable accuracyfor determining the PML of a risk.DEFINITIONThe following definitions are suggested:The probable maximum loss for a property is that proportion of thetotal value of the property which will equal or exceed, in a statedproportion of all cases,the amount of loss from a specified peril orgroup of perils.The probable maximum loss under a given insurance contruct isthat proportion of the limit of liability which will equal or exceed, ina stated proportion of all cases, the amount of any loss covered bythe contract.In more familiar statistical language, tha,t is more clearly related to credibility criteria for example, the insurance definition may be restated:
32PMLThe probable maximum loss under a given insurance contract is thatproportion [ lOO(m k)%] of the limit of liability which with probability P is greater than or equal to any loss covered by the contract,where m is the mean or “expected” proportion of loss.The first of these two definitions is pertinent to the insured and his riskmanager, while the second definition is of course more directly pertinentto the underwriter, since i,t is tied directly to his underwriting results. Thefirst definition requires four pieces of information and the second calls for/three pieces. These merit a closer look.The first datum required for the property definition is the value of theproperty. The second required datum is a proportion of that value. Theseare definite, measurable quantities. The first can be expressed as a monetary amount, and the second either as a monetary amount or as a percentage of value. The fourth required datum is the peril or group of perilsthat is being considered. Since there are apt to be considerably differentPML’s for the different major perils, it is usually wise to determine thesePML’s separately and then to select the largest for use. For the insurancedefinition, the amount of insurance is needed instead of the value of theproperty, and the second needed datum differs correspondingly. The fourthdatum is not needed explicitly for insurance.The third datum is the major essential which is missing from existingdefinitions of PML. Unless we state in specific numerical terms the degreeof probability which we desire, PML cannot have a clear or precise meaning. This probability must be factually based and should be measured asaccurately as possible, not just pulled from the air or based on unaidedjudgment. The probability should also be selected on the basis of factualcriteria that suitably link it to the objective underlying its selection: a definitedegree of stability in underwriting results.Benckert and Sternberg have secured evidence that the distribution bysize (monetary amount) of fire losses to dwellings follows a Paretoan curve.’Mandelbrot has given a theoretical justification why all fire losses should beso distributed.” It is reasonable to assumetherefore that the distribution of1Benckert, L-G. and Sternberg,I. “An Attempt to Find an Expression for the Distribution of Fire Damage Amount,” Trctnsuctior s X Vttt Itt tertmtiotdCongress ofActtraries Vol. II, p. 288, New York, 1957.2 Madelbrot, B., “Random Walks, Fire Damage .Amount and Other Paretoan RiskPhenomena,” Operrrtiotw Resenrctr, Vol. XII, p. 582, 1964.
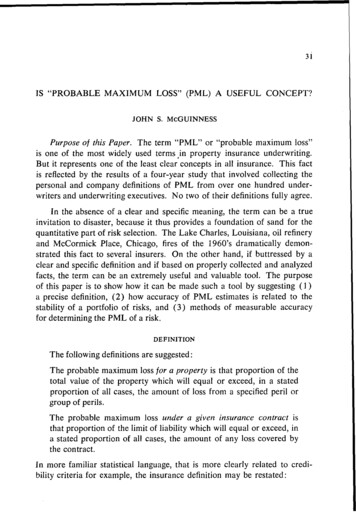
33PMLlosses by proportion of value from any peril for a group of similar risks or over a very long period of time for the same risk- also follows theParetoan distribution, as indicated in Figure 1. The use of the variance andsimilar statistics re!ated to such a curve, especially in determining probabilities or setting confidence intervals, accordingly requires some discretion:It is easier to develop a confidence interval by transforming the relativefrequency distribution into a cumulative or ogive form, which coincideswith the “greater than or equal to” form of our definition of PML. This hasbeen done in Figure 2.It is also worth noting that the probability pertinent to PML involvesonly one tail - the upper end - of the relative frequency distribution ofclaims, as shown in Figure 2. With respect to PML we are only interestedin adverse fluctuations, those above the PML value. This differs from mostratemaking situations, in which both upward and downward fluctuationsabout the mean or some other statistic must be considered.PMLANDTHESTABILITYOF A PORTFOLIOPML is used in at least two types of situations. Its primary uses is in thequantitative part of underwriting or risk selection. Here it is used as thebasis for attempting to secure an adequate spread of risk, by limiting theamount of an insurer’s liability to loss from a single occurrence. It is usedprimarily in connection with the fire peril, and to a lesser extent in connectionwith other perils giving rise to localized losses, for example sprinkler leakage, water damage, and explosion. It is still less used in connection withwindstorm, earthquake, and similar loss to individual properties. It is usedvery little and with extreme imprecision in connection with catastrophicexposures that give rise to losses to several’insured properties at the sametime. With respect to the financial soundnessof insurers, however, a preciseuse in connection with the catastrophic exposure is its potentially mostimportant type of employment.The term is also used in connection with engineering inspection of existing properties, and engineering analysis for safety and loss prevention ofproposed building designs. Its present use in these connections, however,is just as imprecise as in connection with underwriting.The immediate purpose of determining the PML for any specific property or risk is to provide a basis for selecting the maximum amount of
\34PMLClaimFigureAmount as a Percentagel.-of InsuredAmountShape of a Relative Frequency Distribution of Property Claim Amounts asPercentages of Insured Amounts
35PML02040Claim Amount as a PercentageFigure2.-6080of. Insured100AmountShape of a Cumulative Relative Frequency Distributionof Property ClaimAmounts as Percentages of InsuredAmounts
36PMLinsurance that an insurer should retain on the risk for its own account. Thisamount is commonly called the insurer’s “net retention.” PML is a toolto be used in achieving a particular result - the retention - not an end initself. Parallel to determining the company’s own retention or exposure toloss on a particular risk, the maximum amount to which an insurer wishesto expose its treaty reinsurers on the same risk is also based on the underwriter’s assessmentof the PML.In turn, the purpose ,of setting underwriting retentions is to stabilize aninsurer’s experience so that one or more large individual losses will notadversely affect its over-ah underwriting result by more than a specifiedamount during any one year.The ultimate objective for determining the PML of an individual risk istherefore to help stabilize the over-all claim results of a portfolio or groupof risks during each year or other accounting period. Most insurers set agoal each year of a specific monetary amount of claims. This may be doneexplicitly, or it may be done implicitly by stating a target premium volumeand a target loss ratio.The stability objective is, then, to experience an actual total amountof claims, C,, no greater than the target (“expected”) amount, C,, plus k,a constant. C, - C, k can be equated either with the accumulated amountof unexpended catastrophe loadings to all premiums received since a certainstarting date, or with a certain proportion of surplus designated as acatastrophe reserve.Realistically, some chance fluctuation (as well as fluctuation from othercauses) above or below the targeted amount of claims must be expected.Any favorable fluctuation below the target is welcome and requires no defense. But any adverse fluctuation, above the target, must be limited inaccordance with the financial resources available to the insurer to absorb it.The size of an insurer’s surplus, and the relative size of its surplus and thetargeted amount of claims, determine how much of an adverse fluctuationthe insurer can safely absorb and how high a probability it requires that aselected maximum allowable adverse fluctuation will not be exceeded.Even if the PML’s on all of an insurer’s risks are determined with greataccuracy, however, adequate stability of results will not be achieved unlessthe insurer’s retentions on the different classes of risks are appropriatelygraded. How to achieve these appropriate gradings lies outside the scope
37PMLof this paper, even though closely related to its subject. It needs emphasis, however, that unstable underwriting results can not properly beattributed to inaccurate determination of PML’s unless the influence of aninsurer’s retention schedule (line sheet) and other pertinent factors isfirst examined and found to be favorable.METHODSOF MEASURINGPMLMethods now in use for determining PML’s are necessarily based onsketchily informed judgment, since the degree of accuracy to which PMLcan be measured depends largely on the quality and quantity of pertinentstatistical information that is available. It is not possible, for example, todetermine the probabilities previously described without having facts onwhich to base them, and such facts are not presently being collected, exceptfor dwellings, in the manner required.It is therefore appropriate to examine what facts are needed to measurePML and then to investigate how and if these facts can economically beobtained. There are also different methods by which PML can be measured.These all deserve examination so that, even if at present only the simplestand least accurate is feasible to use, it can be seen whether at a later timemore accurate methods can be substituted.The simplest approach to measuring PML is to obtain the amount ofclaim and the amount of insurance on each risk that has sustained a lossduring a given year, and to classify these paired figures by major statisticalclass (occupancy, construction, protection, and peril or coverage). Separation by major individual peril is to be preferred. The pairs of figures canbe translated into loss percentages, a frequency distribution of these percentages made for each of the sub-classes described, and the maximumpercentage of loss involved in 90, 95, 99, or some higher percentage of allthe claims in each category determined. The use of data for more thanone year would increase the spread and probably the stability of theseresults.An adjustment to reflect the different proportions of insurance to valuewould materially improve accuracy. This could take the form of a furthersubdivision of data by type of average or coinsurance clause. It would be afour-way or five-way split (none, 80%) 90%, and lOO%, or all these plus70% ) that would further fragment the data. It might alternatively be simplified into a two-way split (i.e., with or without an average clause) by
38PMLmultiplying the loss percentage of each risk insured with an average clauseby the percentage of that clause. This would approximately put all theresults from these latter risks on a 100 per cent average-clause basis, asTable I illustrates. It is clear from the table how the average clause achievesequity by holding claim payments to exactly the same percentage of theamount of insurance, whether or not the insured honors his commitmentto purchase the specified amount of insurance. At the same time it avoidsdistortions in ratemaking from 0004,5005,0005,000to ge lSW-6,0006,0006,00010,00010,000-(4)-of Claim p&g -Table 1. Adjustment of Average-Clause Results to a Full-insurance BasisA further step towards increased accuracy would be to analyze the totalresults of all six sub-classesat one time by multiple correlation. The effectsof differences between the different years during which data were collected,between states and other geographical subdivisions, and effects of othervariables included in the statistical collecting plan should be included in thecorrelation model. This step could also be taken with currently collectedstatistics if corresponding claim amounts and insurance amounts were kepttogether.A third stage would be to include in a correlation model all of the variables included in the schedules and other rating plans. This would involvemaking available to a central statistical agency the schedule-rating makeupsfor individual risks that are now kept at the state level by the individualrating and inspection bureaus.
PML39At present probably only the first stage is possible. While this wouldprobably produce PML estimates with a wide variance, they would still be amajor improvement because they would be fact-based and because thevariance would be known. Nothing required for measuring PML’s on a.class basis is not already required for accurate ratemaking. Indeed, establishment of such fact-based PML’s could be a step in improving ratemakingaccuracy. Once the third stage described above is reached, a suitable multiple-correlation model would be made available to insurers for transferfrom underwriters to a computer the determining of PML’s for individualrisks of any degree of complexity. Such a model would also permit thecomplex retention guides or line sheets of property insurers to be baseddirectly and precisely on factual data.Judging Underwriters’ Performance in Estimating PML. Only if thereis feedback to underwriters that shows them which estimates are good andwhich are poor can they and their superiors hope for improvement in PMLestimates. Also, the superiors cannot soundly judge this aspect of job performance without such information. For these two internal purposes it istherefore useful for an insurer to secure regularly from its statistical recordsa summary of PML performance for each underwriter, yearly or perhapsmore often.This can be accomplished by recording the insurance PML percentagefor each risk estimated by an underwriter, by similarly recording the actualpercentage of loss to insured amount for each claim on such risks during aunit time period, by calculating the error of estimate (actual percentageminus estimated percentage) for each claim, and by calculating the meanand variance of the whole group of these errors of estimate for each timeperiod.It might be desirable to weight the errors of estimate by the amounts ofinsurance involved, since a small percentage error on a large risk couldaffect an insurer’s results as much as large percentage errors on severalsmall risks. Although errors in both directions art: to be avoided (too conservative PML’s lead to wastefully high reinsurance purchases and excessive reinsurance processing costs, while too liberal PML’s lead to anexcessive number of unstabilizing large claims) any error would preferablybe in a conservative direction. It is therefore important to consider thesign of the mean error as well as its size.
40PMLFor each.time period, the mean error and variance of each underwritercould be compared with the over-all company mean and variance, or withthe over-all mean and variance of underwriters handling the same types ofrisks. Separate consideration of results with family risks and with business risks would be the minimum split needed if underwriters are specialized on that basis in the company. A review and analysis of the largestpercentage errors from each underwriter’s results could lay the foundationfor better results in succeeding periods. A comparison of the mean errorsand variances over time, both for individuals and for the company as awhole, could keep management abreast of whether the desirable downwardtrend was present in each case and of which underwriters needed help inimproving their results.DISCUSSION BY ROBERT L. HURLEYThere is much that the reader may find remarkable in the paper, “IsProbable Maximum Loss (PML) a Useful Concept?” The term, itself, isbelieved one of those esoteric symbols of the underwriting fraternity whosemembers must. in turn, sometimes find certain actuarial arcana a bitmystifying. It is not possible that PML can convey to the actuary the associations (not necessarily all pleasant) that these letters can suggest to theexperienced fire underwriter. Presented with the McGuinness warnings onlarge fire losses, an underwriter may well reflect that there have been firecatastrophies before McCormick place, which he, incidentally, might notregard as likely destined to be the last of such disasters. Nevertheless, a lifelong schooling not to hazard, needlessly, an undue portion of his company’sassetsin a single occurrence would typically dissuade the underwriter fromplacing any significant reliance upon a purely fatalist approach to riskevaluation. Moreover, he could not help being at least a bit curious aboutany such approach as Dr. McGuinness’s which might be construed as showing the underwriter how much he could safely write on the risks offered tohim. The actuary, too, would have more than a passing interest in anysuch demonstration, although, understandably, the underwriter would bethe most immediate beneficiary of any such mathematical solution to theage old problem of determining PML.But before attempting to evaluate the McGuinness proposal, it may behelpful to identify his mathematical sources since they stem more from theeconomics and sociological than from the actuarial literature. About the
exposures that give rise to losses to several'insured properties at the same time. With respect to the financial soundness of insurers, however, a precise use in connection with the catastrophic exposure is its potentially most . the insurer can safely absorb and how high a probability it requires that a selected maximum allowable adverse .