Transcription
Integration GuideIntegrating Zscaler Internet Access CentralAuthority (CA) with EventTrackerEventTracker v9.2x and abovePublication Date:October 28, 2021 Copyright Netsurion. All Rights Reserved.1
AbstractThis guide provides instructions to configure the Zscaler Internet Access CA to send its syslog toEventTracker.ScopeThe configuration details in this guide are consistent with the EventTracker version v9.2x or above and theZscaler Internet Access CA.AudienceThe Administrators who are assigned the task to monitor the Zscaler Internet Access CA events using theEventTracker. Copyright Netsurion. All Rights Reserved.2
Table of ContentsTable of Contents .31.Overview .42.Prerequisites.43.Configuring Zscaler Internet Access CA .44.5.6.3.1To configure a feed for the Web Logs .43.2To configure a feed for the Firewall Logs .63.3To configure a feed for the DNS Logs .83.4To configure a feed for the Alerts.93.5To configure a feed for the Tunnel Logs.93.6To configure a feed for the SaaS Security logs. 10EventTracker Knowledge Packs . 114.1Categories . 114.2Alerts . 114.3Reports . 124.4Dashboards . 14Importing Zscaler Internet Access CA Knowledge Pack into EventTracker. 185.1Categories . 195.2Alerts . 195.3Reports . 205.4Knowledge Objects . 225.5Dashboards . 23Verifying Zscaler Internet Access CA Knowledge Pack in the EventTracker . 246.1Categories . 246.2Alerts . 246.3Knowledge Objects . 256.4Reports . 266.5Dashboards . 26About Netsurion . 28 Copyright Netsurion. All Rights Reserved.3
1. OverviewThe Zscaler Internet Access (ZIA) Central Authority (CA) is the vital system in the Zscaler cloud. It monitorsthe cloud and provides a central location for the software and database updates, policy and configurationsettings, and threat intelligence.The Nanolog Streaming Service (NSS) server can send the traffic logs to EventTracker. Using EventTracker,you can monitor the web traffic logs, firewall logs, tunnel logs, and alerts. You can easily track the maliciousweb activities, inbound and outbound traffic activities, and alerts even when the CPU memory is full, andthe CPU utilization is high.EventTracker can help organizations monitor the Zscaler Internet Access CA alerts triggered by the ZIA CA.EventTracker captures login and logout events into Zscaler Internet Access CA application and alerts theadministrators in real-time.2. Prerequisites Admin access to the Zscaler Internet Access CA console.3. Configuring Zscaler Internet Access CAThe NSS feed specifies the data from the logs, which the NSS sends to EventTracker: Web logs, firewall logs,DNS logs, alerts, tunnel logs, SaaS security logs.There are two reliable log delivery mechanisms in the NSS.NSS to SIEM: The NSS buffers the logs in the Virtual Machine (VM) memory to increase its resilience totransit the network issues between the SIEM and the NSS. If the connection drops, the NSS replays thebuffer logs, according to the Duplicate Logs setting.Nanolog to SIEM: If the connectivity between Netsurion’s cloud and the NSS is interrupted, the NSS will missthe logs that have arrived at the Nanolog cluster during the interruption, and the logs won’t be delivered tothe SIEM. Once the connection restores, the NSS one-hour recovery allows the Nanolog to replay the logs upto one hour back.Note: Enable the TCP with port number 514 from the EventTracker to receive the Zscaler Internet Access CAlogs.3.1 To configure a feed for the Web Logs1. Go to the Administration Nanolog Streaming Service.2. In the NSS Feeds tab, click Add NSS Feed.The Add NSS Feed window appears. Copyright Netsurion. All Rights Reserved.4
3. In the Add NSS Feed window, enter the following details. Feed Name: Enter the name as Web logs.NSS Type: Select NSS for Web.NSS Server: Choose the NSS from the list.Status: The NSS feed is Enabled by default.SIEM Destination Type: The type of destination.o SIEM IP Address: Enter the IP address of EventTracker to which the logs stream.SIEM TCP Port: Enter port number 514.Log Type: Choose Web Log.SIEM Rate Limit (Events per Second): Leave as unrestricted or unlimited.Feed Output Type: Select Custom.Feed Output Format: For the NSS feeds for web logs, copy and paste the pre-populated FeedOutput format with the following.%s{mon} %02d{dd} %02d{hh}:%02d{mm}:%02d{ss} zscaler-nss-web CEF:0 Zscaler NSSWeblog 5.7 %s{action} %s{reason} 3 act %s{action} reason %s{reason} app %s{proto} dhost %s{ehost} dst %s{sip} src %s{cintip} sourceTranslatedAddress %s{cip} in %d{respsize} out %d{reqsize} request %s{eurl} requestContext %s{ereferer} outcome %s{respcode} requestClientApplication %s{ua} requestMethod %s{reqmethod} suser %s{login} spriv %s{location} externalId %d{recordid} fileType %s{filetype} destinationServiceName %s{appname} cat %s{urlcat} deviceDirection 1 cn1 %d{riskscore} cn1Label riskscore cs1 %s{dept} cs1Label dept cs2 %s{urlcat} cs2Label urlcat cs3 %s{malwareclass} cs3Label malwareclass cs4 %s{malwarecat} cs4Label malwarecat cs5 %s{threatname} cs5Label threatname cs6 %s{bamd5} cs6Label Copyright Netsurion. All Rights Reserved.5
md5hash rulelabel %s{rulelabel} ruletype %s{ruletype} urlclass %s{urlclass} devicemodel %s{devicemodel} devicehostname %s{devicehostname}\n User Obfuscation: Choose Disable to display the usernames. Timezone: By default, this is set to the organization's time zone. Duplicate Logs: Enter the number of 60 (minutes).4. Click Save and activate the change.3.2 To configure a feed for the Firewall Logs1. Go to Administration Nanolog Streaming Service.2. In the NSS Feeds tab, click Add NSS Feed.The Add NSS Feed window appears.3. In the Add NSS Feed window, enter the following details. Copyright Netsurion. All Rights Reserved.6
Feed Name: Enter or edit the name as Firewall logs.NSS Type: Select NSS for Firewall.NSS Server: Choose an NSS from the list.Status: It is Enabled by default.SIEM Destination Type: The type of destination.o SIEM IP Address: Enter the IP address of EventTracker.SIEM TCP Port: Enter port number 514.Log Type: Choose Firewall Logs.Choose the Firewall Log Type: Both Session and Aggregate Logs.SIEM Rate Limit (Events per Second): Leave as unrestricted or unlimited.Feed Output Type: Select Custom.Feed Output Format: NSS Feeds for firewall logs, copy and paste the pre-populated FeedOutput format with the following:%s{mon} %02d{dd} %02d{hh}:%02d{mm}:%02d{ss} zscaler-nss-fw CEF:0 Zscaler NSSFWlog 5.7 %s{action} %s{rulelabel} 3 act %s{action} suser %s{login} src %s{csip} spt %d{csport} dst %s{cdip}dpt %d{cdport} deviceTranslatedAddress %s{ssip} deviceTranslatedPort %d{ssport} destinationTranslatedAddress %s{sdip} destin Copyright Netsurion. All Rights Reserved.7
ationTranslatedPort %d{sdport} sourceTranslatedAddress %s{tsip} sourceTranslatedPort %d{tsport} proto %s{ipproto} tunnelType %s{ttype} dnat %s{dnat} spriv %s{location} reason %s{rulelabel} in %ld{inbytes} out %ld{outbytes} deviceDirection 1 cs1 %s{dept} cs1Label dept cs2 %s{nwsvc} cs2Label nwService cs3 %s{nwapp} cs3Label nwApp cs4 %s{aggregate} cs4Label aggregated cs5 %s{threatcat} cs5Label threatcat cs6 %s{threatname} cs6label threatname cn1 %d{durationms} cn1Label durationms cn2 %d{numsessions} cn2Label numsessions cs5Label ipCat cs5 %s{ipcat} destCountry %s{destcountry} avgduration %d{avgduration}\n User Obfuscation: Choose Disable to display the usernames.Time zone: By default, this is set to the organization's time zone.Duplicate Logs: Enter the number of 60 (in minutes).4. Click Save and Activate the change.3.3 To configure a feed for the DNS Logs1. Go to Administration Nanolog Streaming Service.2. In the NSS Feeds tab, click Add NSS Feed.The Add NSS Feed window appears.3. In the Add NSS Feed window, enter the following details. Feed Name: Enter the name as DNS logs.NSS Type: Select NSS for Firewall.NSS Server: Choose an NSS from the list.Status: It is Enabled by default.SIEM Destination Type: The type of destination.o SIEM IP Address: Enter the IP address of EventTracker.SIEM TCP Port: Enter port number 514.Log Type: Choose DNS Logs.Feed Output Type: Select Custom.Feed Output Format: For NSS Feeds for Web logs, copy and paste the pre-populated FeedOutput format with the following.%s{mon} %02d{dd} %02d{hh}:%02d{mm}:%02d{ss} zscaler-nss-fw-dnsCEF:0 Zscaler NSSFWlog 5.7 %s{action} %s{rulelabel} 3 act %s{action} suser %s{login} cip %s{cip} cpt %d{cport} spriv %s{location} reason %s{rulelabel} in %ld{inbytes} out %ld{outbytes}deviceDirection 1 durationms %d{durationms} ruleresponse %s{resrulelabel} responseaction %s{resaction} suser %s{login} serveripaddress %s{sip} serverport %d{sport} externalId %d{recordid} FQDN %s{req} Domaincategory %s{domcat} requesttype %s{reqtype} encoded %s{eedone} datacentername %s{datacenter} detecentercity %s{datacentercity} datacentercountry %s{datacentercountry}\n User Obfuscation: Choose Disable to display the usernames. Copyright Netsurion. All Rights Reserved.8
Time zone: By default, this is set to the organization's time zone. Duplicate Logs: Enter the number to 60 (in minutes).4. Click Save and Activate the change.3.4 To configure a feed for the Alerts1. Go to Administration Nanolog Streaming Service.2. In the NSS Feeds tab, click Add NSS Feed.The Add NSS Feed window appears.3. In the Add NSS Feed window, enter the following details. Feed Name: Enter the name as Alerts.NSS Type: Select NSS for Web.NSS Server: Choose an NSS from the list.Status: The NSS feed is Enabled by default.SIEM Destination Type: The type of destination.o SIEM IP Address: Enter the IP address of EventTracker. SIEM TCP Port: Enter port number 514. Log Type: Choose Alerts.4. Select at which levels alerts will be sent: Critical.5. Click Save and activate the change.3.5 To configure a feed for the Tunnel Logs1. Go to Administration Nanolog Streaming Service.2. From the NSS Feeds tab, click Add NSS Feed.The Add NSS Feed window appears.3. In the Add NSS Feed window, enter the following details. Feed Name: Enter the name as Tunnel logs.NSS Type: Select NSS for Web.NSS Server: Choose an NSS from the list.Status: The NSS feed is Enabled by default.SIEM Destination Type: The type of destination.o SIEM IP Address: Enter the IP address of EventTracker.SIEM TCP Port: Enter port number 514.SIEM Rate (Events per Second): Leave as unrestricted or unlimited.Log Type: Choose Tunnel.Record Type: Specify the tunnel log record types to send in the single NSS Feed:o Tunnel Event: Status change events (applies to both GRE and IPSec)Feed Output Type: Select Custom.Feed Output Format: For NSS Feeds for Web logs, copy and paste the pre-populated FeedOutput Format with the following.%s{mon} %02d{dd} %02d{hh}:%02d{mm}:%02d{ss} zscaler-nss-tunnel CEF:0 Zscaler NSSWeblog 5.7 %s{action} %s{reason} 3 act %s{action} Copyright Netsurion. All Rights Reserved.9
reason %s{reason} app %s{proto} dhost %s{ehost} dst %s{sip} src %s{cintip} sourceTranslatedAddress %s{cip} in %d{respsize} out %d{reqsize} request %s{eurl} requestContext %s{ereferer} outcome %s{respcode} requestClientApplication %s{ua} requestMethod %s{reqmethod} suser %s{login} spriv %s{location} externalId %d{recordid} fileType %s{filetype} destinationServiceName %s{appname} cat %s{urlcat} deviceDirection 1 cn1 %d{riskscore} cn1Label riskscore cs1 %s{dept} cs1Label dept cs2 %s{urlcat} cs2Label urlcat cs3 %s{malwareclass} cs3Label malwareclass cs4 %s{malwarecat} cs4Label malwarecat cs5 %s{threatname} cs5Label threatname cs6 %s{bamd5} cs6Label md5hash rulelabel %s{rulelabel} ruletype %s{ruletype} urlclass %s{urlclass} devicemodel %s{devicemodel} devicehostname %s{devicehostname}\n. Timezone: By default, this is set to the organization's time zone.Duplicate Logs: Enter the number of 60 (in minutes).3. Click Save and activate the change.3.6 To configure a feed for the SaaS Security logs1. Go to Administration Nanolog Streaming Service.2. In the NSS Feeds tab, click Add NSS Feed.The Add NSS Feed window appears.3. In the Add NSS Feed window, enter the following details. Feed Name: Enter the name as SaaS security logs.NSS Type: Select NSS for Web.NSS Server: Choose an NSS from the list.Status: The NSS feed is Enabled by default.SIEM Destination Type: The type of destination.o SIEM IP Address: Enter the IP address of EventTracker.SIEM TCP Port: Enter port number 514.Log Type: Choose SaaS Security API.SIEM Rate Limit (Events per Second): Leave as unrestricted or unlimited.Feed Output Type: Select Custom.Feed Output Format: For NSS Feeds for Web logs, copy and paste the pre-populated FeedOutput Format with the following.%s{mon} %02d{dd} %02d{hh}:%02d{mm}:%02d{ss} zscaler-nss-saas CEF:0 Zscaler NSSWeblog 5.7 %s{action} %s{reason} 3 act %s{action} reason %s{reason} app %s{proto} dhost %s{ehost} dst %s{sip} src %s{cintip} sourceTranslatedAddress %s{cip} in %d{respsize} out %d{reqsize} request %s{eurl} requestContext %s{ereferer} outcome %s{respcode} requestClientApplication %s{ua} requestMethod %s{reqmethod} suser %s{login} spriv %s{location} externalId %d{recordid} fileType %s{filetype} destinationServiceName %s{appname} cat %s{urlcat} deviceDirection 1 cn1 %d{riskscore} cn1Label riskscore cs1 % Copyright Netsurion. All Rights Reserved.10
s{dept} cs1Label dept cs2 %s{urlcat} cs2Label urlcat cs3 %s{malwareclass} cs3Label malwareclass cs4 %s{malwarecat} cs4Label malwarecat cs5 %s{threatname} cs5Label threatname cs6 %s{bamd5} cs6Label md5hash rulelabel %s{rulelabel} ruletype %s{ruletype} urlclass %s{urlclass} devicemodel %s{devicemodel} devicehostname %s{devicehostname}\n User Obfuscation: Choose Disable to display the usernames.Timezone: By default, this is set to the organization's time zone.Duplicate Logs: Enter the number to 60 (in minutes).4. Click Save and activate the change.4. EventTracker Knowledge PacksAfter the logs are received by EventTracker, the Knowledge Packs can be configured into EventTracker.The following Knowledge Packs are available in the EventTracker to support the Zscaler Internet Access CA.4.1 Categories Zscaler Internet Access CA: DNS activities - This category provides information related to the domainname services events.Zscaler Internet Access CA: Firewall activities - This category provides information related to thefirewall traffic events like allowed, denied, blocked traffic.Zscaler Internet Access CA: SaaS security activities - This category provides information related tothe current state of the organization’s security posture for the SaaS application events.Zscaler Internet Access CA: Tunnel activities - This category provides information related to tunneltraffic events.Zscaler Internet Access CA: Web access activities - This category provides information related to theweb access details on your organization.4.2 Alerts Zscaler Internet Access CA: IPS traffic detected - This alert generates whenever the Zscaler detectsIntrusion prevention traffic. Zscaler Internet Access CA: Malicious file has been detected - This alert generates whenever theZscaler detects a malicious file. Copyright Netsurion. All Rights Reserved.11
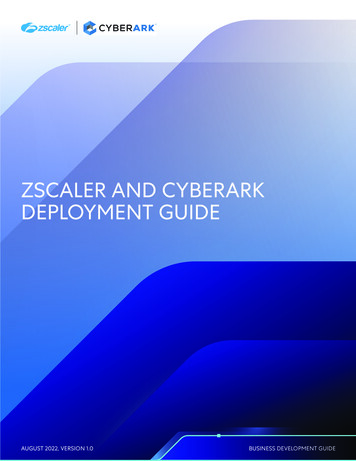
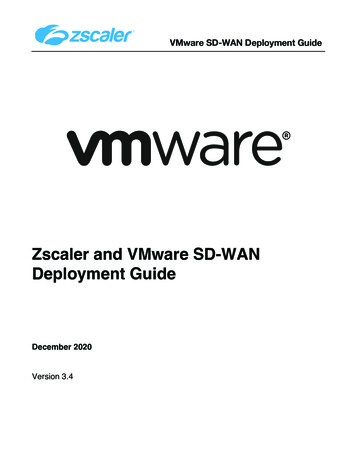
4.3 Reports Zscaler Internet Access CA – Web access activities – This report gives information about the web accessdetails on your organization. It contains the field information like the username, source IP, destinationIP, hostname, action, reason, URL address, a risk score of URL, total bytes in, total bytes out, etc.Sample ReportSample LogsOct 22 11:26:13 10.10.110.63 Oct 22 10:24:30 zscaler-nss-webCEF:0 Zscaler NSSWeblog 5.7 Denied Not allowed to use this File Share site 4 act denied reason Not allowed to use this File Share site app IPSECdhost WKSETRWE24 dst 17.247.135.233 src 108.6.212.216sourceTranslatedAddress 203.0.113.5, 192.168.2.200 in 101500 out 13010 request www.trythisencode2url.com/index%1A%09 requestContext ksjdjsyriwiojdj outcome 403requestClientApplication Mozilla/5.0(Windows NT 6.1; WOW64; Trident/7.0;rv:11.0) requestMethod invalid suser kenneth@contoso.com spriv HeadquartersexternalId 4745655 fileType ZIP destinationServiceName Dropbox cat deviceDirection 0 cn1 6 cn1Label riskscore cs1 Sales cs1Label dept cs2 cs2Label urlcat cs3 Win32.Rans0m.WannaCry cs3Label malwareclass cs4 Adwarecs4Label malwarecat cs5 tres.venim cs5Label threatnamecs6 196a3d797bfee07fe4596b69f4ce1341 cs6Label md5hash rulelabel URL Filtering 1ruletype Sandbox urlclass PrivacyRisk devicemodel 20L8S7WC18devicehostname THINKPADkenneth Zscaler Internet Access CA – SaaS security activities – This report gives information about the currentstate of organization security posture for the SaaS application. It contains the field information likeaction, hostname, application, source IP address, destination IP address, threat name, URL address, etc.Sample ReportSample LogsOct 22 11:26:13 10.10.110.63 Oct 22 10:24:30 zscaler-nss-saasCEF:0 Zscaler NSSWeblog 5.7 Denied Not allowed to use this File Share site 3 act denied reason Not allowed to use this File Share site app IPSECdhost WKSETRWE24 dst 17.248.13.233 src 108.6.211.21sourceTranslatedAddress 203.0.113.5, 192.168.2.200 in 10500 out 1300 request www.trythyfisencodeurl.com/index%1A%09 requestContext ksjdjsyriwiojhyjdjoutcome 403 requestClientApplication Mozilla/5.0(Windows NT 6.1; WOW64;Trident/7.0; rv:11.0) requestMethod invalid suser smith spriv Headquarters Copyright Netsurion. All Rights Reserved.12
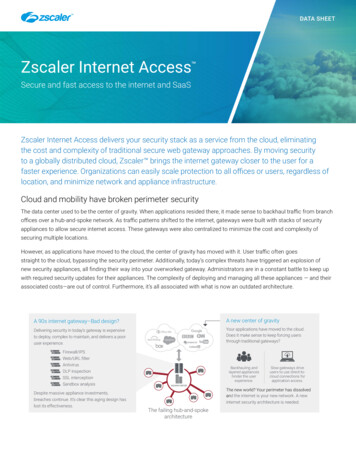
externalId 4754534655 fileType ZIP destinationServiceName Dropbox cat deviceDirection 1 cn1 6 cn1Label riskscore cs1 Sales cs1Label dept cs2 cs2Label urlcat cs3 Win32.Ransum.WannaCry cs3Label malwareclass cs4 Adwarecs4Label malwarecat cs5 trs.venum cs5Label threatnamecs6 196a3d797bfee07fe4596b69f4ce11211 cs6Label md5hash rulelabel URL Filtering 1 ruletype Sandbox urlclass PrivacyRisk devicemodel 20L8S7WC08devicehostname THINKPADSMITH Zscaler Internet Access CA – Tunnel activities - This report gives information about the tunnel traffic. Itcontains the field information like the IP address, location, destination IP address, tunnel type, VPNname, etc.Sample ReportSample LogsOct 22 11:26:13 10.10.110.63 Oct 22 10:24:30 zscaler-nss-tunnelCEF:0 Zscaler NSSWeblog 5.7 Denied Not allowed to use this File Share site 5 act denied reason Not allowed to use this File Share site app IPSECdhost WKSETRWE28 dst 16.248.135.233 src 108.6.211.21sourceTranslatedAddress 203.0.113.5, 192.168.2.200 in 10500 out 1300 request www.troythisencodeurl.com/index%1A%09 requestContext ksjdjssyriwiojdjoutcome 403 requestClientApplication Mozilla/5.0(Windows NT 6.1; WOW64;Trident/7.0; rv:11.0) requestMethod invalid suser joe@contoso.comspriv Headquarters externalId 475989655 fileType ZIPdestinationServiceName Dropbox cat deviceDirection 1 cn1 5 cn1Label riskscorecs1 Sales cs1Label dept cs2 cs2Label urlcat cs3 Win32.Ransom.WannaCrycs3Label malwareclass cs4 Adware cs4Label malwarecat cs5 trs.venimcs5Label threatname cs6 196a3d797bfee07fe4596b69f4ce1141 cs6Label md5hashrulelabel URL Filtering 1 ruletype Sandbox urlclass PrivacyRiskdevicemodel 20L8S7WC28 devicehostname THINKPADjoe Zscaler Internet Access CA – DNS activities - This report gives information about the domain nameservice events. It contains the field information like the client IP address, server IP address, datacentername, datacenter location, record type, username, response type, reason, action, etc.Sample ReportSample LogsOct 22 11:26:13 10.10.110.63 Oct 22 10:24:30 zscaler-nss-fw-dnsCEF:0 Zscaler NSSFWlog 5.7 REQ ALLOW %s{rulelabel} 3 act REQ ALLOWsuser kenneth cip 100.20.11.13 cport spriv Headquarters reason dns request in out deviceDirection 1 durationms 456345 ruleresponse dns default request Copyright Netsurion. All Rights Reserved.13
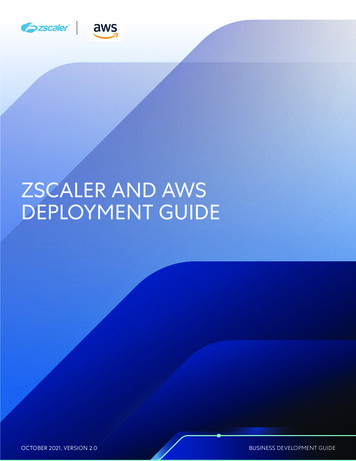
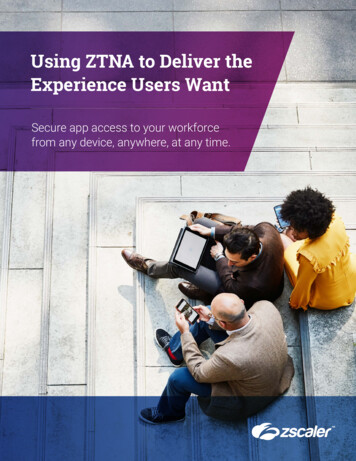
responseaction allowed suser serveripaddress 192.168.2.200 serverport 4536externalId 2142342 FQDN mail.safemarch.com Domaincategory Professional Servicesrequesttype A record encoded faffawrjghkyrth datacentername CA Client Node DCdetecentercity Sa datacentercountry US Zscaler Internet Access CA – Firewall activities - This report gives information about the firewall trafficevents like allowed, denied, blocked traffic. It contains the field information like reason, action, sourceIP address, source port, destination IP address, destination port, total duration, total bytes in, total bytesout, protocol, etc.Sample ReportSample LogsOct 22 11:26:13 10.10.110.63 Oct 22 10:24:30 zscaler-nss-fwCEF:0 Zscaler NSSFWlog 5.7 allowed Default firewall filtering rule 3 act allowed suser maxx@safemarch.com src 12.52.56.45 spt 2526 dst 198.52.100.54dpt 22 deviceTranslatedAddress 18.51.65.42 deviceTranslatedPort 22destinationTranslatedAddress destinationTranslatedPort 192.0.2.100sourceTranslatedAddress 192.0.2.15 sourceTranslatedPort 22 proto TCPtunnelType IPSEC dnat yes spriv Suboffice reason Default firewall filtering rulein 51556 out 6269665 deviceDirection 1 cs1 Development cs1Label dept cs2 HTTPcs2Label nwService cs3 teams cs3Label nwApp cs4 aggre cs4Label aggregatedcs5 clean cs5Label threatcat cs6 clean cs6label threatname cn1 58555cn1Label durationms cn2 6 cn2Label numsessions cs5Label ipCat cs5 FinancedestCountry USA avgduration 600,0004.4 Dashboards Zscaler Internet Access CA - Malicious file hashes Copyright Netsurion. All Rights Reserved.14
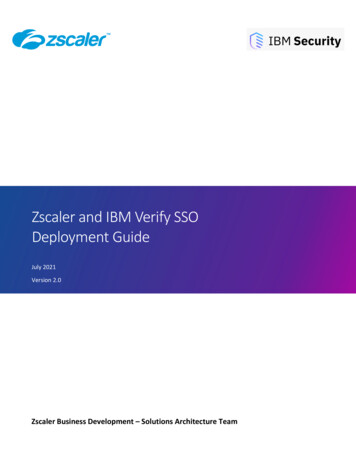
Zscaler Internet Access CA - Traffic by the Source IP Zscaler Internet Access CA - Traffic by the destination IP Copyright Netsurion. All Rights Reserved.15
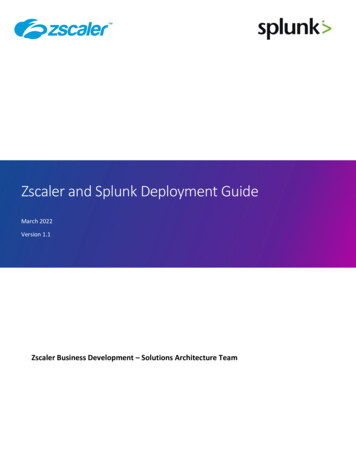
Zscaler Internet Access CA - Source IP traffic by the geo-location Zscaler Internet Access CA - Traffic by Action Copyright Netsurion. All Rights Reserved.16
Zscaler Internet Access CA - Suspicious URL Zscaler Internet Access CA - Malicious file by names Copyright Netsurion. All Rights Reserved.17
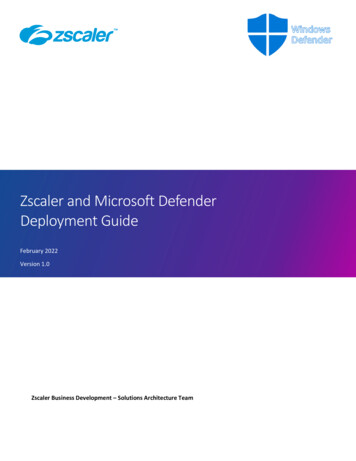
5. Importing Zscaler Internet Access CA Knowledge Pack intoEventTrackerNOTE: Import the Knowledge Pack items in the following sequence: CategoriesAlertsKnowledge ObjectsFlex ReportsDashboards1. Launch the EventTracker Control Panel.2. Double click Export-Import Utility.3. Click the Import tab. Copyright Netsurion. All Rights Reserved.18
5.1 Categories1. After opening the Export-Import Utility via the EventTracker Control Panel, click the Categoryoption, and then click Browse.2. Navigate to the Knowledge Pack folder and select the file with the extension “.iscat”, e.g.,“Categories Zscaler Internet Access CA .iscat” and click the Import button.EventTracker displays a success message.5.2 Alerts1. Click the Alert option, and then click the Browse Copyright Netsurion. All Rights Reserved.button.19
2. Locate the Alerts Zscaler Internet Access CA.isalt file, and then click the Open button.3. To import the alerts, click the Import button.4. EventTracker displays a success message.5. Click the OK button, and then click the Close button.5.3 Reports1. In the EventTracker Control Panel, select Export/ Import utility and select the Import tab. Then, clickthe Reports option, and choose New (*.etcrx). Copyright Netsurion. All Rights Reserved.20
2. After selecting the New (*.etcrx) file, a new pop-up window appears. Click the Select File button andnavigate to the file path with a file having the extension “.etcrx”, e.g., Reports Zscaler InternetAccess CA .etcrx.3. Wait while the reports populate in the below tables. Now, select all the relevant reports and then clickthe Importbutton.EventTracker displays a success message. Copyright Netsurion. All Rights Reserved.21
5.4 Knowledge Objects1. Click Knowledge Objects under the Admin option on the EventTracker page.2. Click the import object icon.3. A pop-up box appears, click Browse and navigate to the Knowledge Packs folder (type%et install path%\Knowledge Packs in the navigation bar) with the extension “.etko”, e.g.,KO Zscaler Internet Access CA .etko, and then click Upload.4.A list of available Knowledge Objects will appear. Select the relevant files and click the Importbutton. Copyright Netsurion. All Rights Reserved.22
5.5 Dashboards1. Login to EventTracker.2. Navigate to Dashboard My Dashboard.3. In My Dashboard, Click the Import button.4. Select the browse button and navigate to the Knowledge Pack folder (type%et install path%\Knowledge Packs in the navigation bar) where the .etwd file is saved, e.g.,Dashboards Zscaler Internet Access CA .etwd and click Upload.5. Wait while EventTracker populates all the available dashboards. Now, choose Select All and click theImport button. Copyright Netsurion. All Rights Reserved.23
6. Verifying Zscaler Internet Access CA Knowledge Pack in theEventTracker6.1 Categories1. Login to EventTracker.2. Click the Admin dropdown, and then click Categories.3. In the Category Tree scroll down and expand the Zscaler Internet Access CA group folder to viewthe imported categories.6.2 Alerts1. Login to EventTracker.2. Click the Admin menu, and then click Alerts.3. In the Search box, type Zscaler Internet Access CA, and then click the Go button. Copyright Netsurion. All Rights Reserved.24
The Alert Management page will display all the imported alerts.4. To activate the imported alerts, select the respective checkboxes in the Active column.EventTracker displays a success message.5. Click OK, and then click the Activate Now button.Note: Specify the appropriate systems in the alert configuration for better performance.6.3 Knowledge Objects1. In the EventTracker web interface, click the Admin dropdown, and then click Knowledge Objects.2. In the Knowledge Objects tree, expand the Zscaler Internet Access CA group folder to view theimported Knowledge Objects. Copyright Netsurion. All Rights Reserved.25
6.4 Reports1. In the EventTracker web interface, click the Reports menu, and then select Report Configuration.2. In the Reports Configuration pane, select the Defined option.3. Click the Zscaler Internet Access CA group folder to view the imported reports.6.5 Dashboards1. In the EventTracker web interface, click the Home Button2. Select Customize daslets Copyright Netsurion. All Rights Reserved.and select My Dashboard.and type Zscaler Internet Access CA in the search bar.26
Copyright Netsurion. All Rights Reserved.27
About NetsurionFlexibility and security within the IT environment are two of the most important factors driving businesstoday. Netsurion’s cybersecurity platforms enable companies to deliver on both. Netsurion’s approach ofcombining purpose-built technology and an ISO-certified security operations center gives customers theultimate flexibility to adapt and grow, all while maintaining a secure environment.Netsurion’s EventTracker cyber threat protection platform provides SIEM, end protection, vulnerabilityscanning, intrusion detection and more; all delivered as a managed or co-managed service.Netsurion’s BranchSDO delivers purpose-built technology with optional levels of managed services to multilocation bus
The Zscaler Internet Access (ZIA) Central Authority (CA) is the vital system in the Zscaler cloud. It monitors the cloud and provides a central location for the software and database updates, policy and configuration settings, and threat intelligence. The Nanolog Streaming Service (NSS) server can send the traffic logs to EventTracker.