Transcription
H1 FY18 EARNINGSNovember 7, 20171
Yves Guillemot, President and Chief Executive OfficerAlain Martinez, Chief Financial OfficerD I S C L A I M E RThis statement may contain estimated financial data, information on future projects andtransactions and future business results/performance. Such forward-looking data are provided forestimation purposes only. They are subject to market risks and uncertainties and may varysignificantly compared with the actual results that will be published. The estimated financial datahave been presented to the Board of Directors and have not been audited by the StatutoryAuditors. (Additional information is specified in the most recent Ubisoft Registration Document filedon July 21, 2017 with the French Financial Markets Authority (l’Autorité des marchés financiers)).
KEY TAKEAWAYSOUTPERFORMANCE DRIVEN BYHIGH QUALITY OFFERINGS& LONG TERM SUPPORT OF OUR GAMESA LOT MORE TO COME WELL BEYOND FY193
AGENDAO U T S TA N D I N G G A M E S X P L O N G T E R M S U P P O R TDRIVE FINANCIAL OUTPERFORMANCEAGM: MASSIVE SHAREHOLDERS SUPPORTH1 FY18 PERFORMANCEF Y 1 8 & F Y 1 9 TA R G E T S4
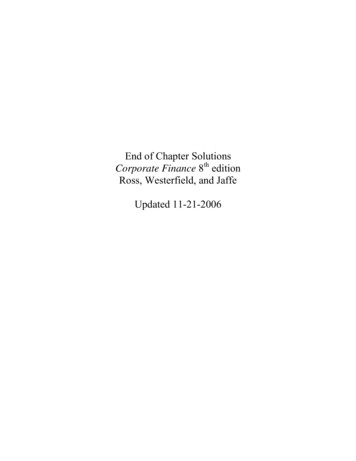
MAJOR NEW RELEASES 83**8581***Weighted average reviews for PS4, Xbox One, PC as of 11/06/17 5
GREAT CONTENT UPDATE SUPPORTING OUR GAMESFOR THE LONG TERM6
AND MORE TO COME 7
ARE DRIVING PERFORMANCEDIGITAL TRANSFORMATIONPROFITABILITY & RECURRENCEADDITIONAL MEANS FOR CREATIONQUALITY, STRENGTH & REGULARITY OF CONTENT PROVEN MULTISTUDIOS ORGANIZATION LONG TERM INVESTMENT IN OUR TEAMS CAPABILITIESSTRONG & HIGHER-THAN-EXPECTED H1 PERFORMANCE8
AGENDAO U T S TA N D I N G G A M E S X P L O N G T E R M S U P P O R TDRIVE FINANCIAL OUTPERFORMANCEAGM: MASSIVE SHAREHOLDERS SUPPORTH1 FY18 PERFORMANCEF Y 1 8 & F Y 1 9 TA R G E T S9
ANNUAL GENERAL MEETING - SEPTEMBER 22, 2017MASSIVE SUPPORT FROM OUR SHAREHOLDERS10
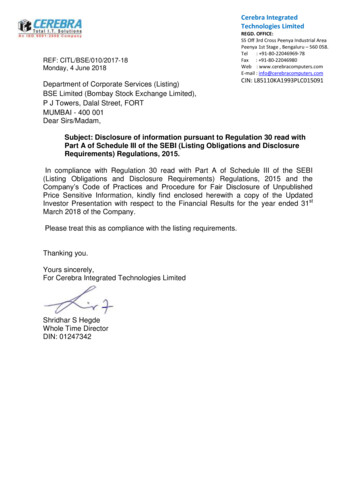
STRONG VALUE CREATION FOR THE YEARS TO COMETOTAL SHAREHOLDER RETURNSince IPO5-year2-year1-yearUBISOFT 3,337% 814% 140% 111%NASDAQ 462% 140% 36% 31%CAC40 Net Return 332% 81% 18% 25% 101% 81%(1%) 8%Euro Stoxx Media Supersector ReturnSource: FactSet as of October 31, 2017IPO as of July 1, 1996*Includes net dividends (post-tax)11
AGENDAO U T S TA N D I N G G A M E S X P L O N G T E R M S U P P O R TDRIVE FINANCIAL OUTPERFORMANCEAGM: MASSIVE SHAREHOLDERS SUPPORTH1 FY18 PERFORMANCEF Y 1 8 & F Y 1 9 TA R G E T S12
H1 FY18 PERFORMANCEH1 SALES: 466 M , 66 % yoyQ2 Sales: 264 M (target of 190 M )OUTPERFORMANCE FROMH1FY18& FROM MOBILE13
LONG TERM SUPPORT OF OUR GAMES & COMMUNITIES14
ACQUISITION & ENGAGEMENT CONTINUE TO GROWViewership 525% yoyTotal MAUsup 29 %(excl. Mobile)Mobile DAUsup 234 %Top 7most watchedon Youtube 300 M weekly Ubisoft Club 25 million playerschallenges played over thepast 22 months by R6 playersFree weekend Solid conversionrate of new activeplayersFree Weekend Ghost WarPvP mode DAUs x215
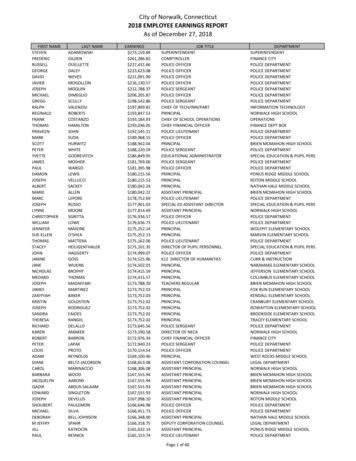
H1 FY18 PERFORMANCE - DIGITALDIGITAL SPLIT343 M 175 69% yoyPlayer RecurringInvestment* 83% yoy202 M 95100 M 41168107DigitalDistribution 57% yoy59H1 FY16H1 FY17* Includes ingame items, DLCs/season pass, subscription & advertisingH1 FY1816
H1 FY18 PERFORMANCEH1FY18VERY SOLID BACK-CATALOG:379 M , 48% FY16 full year back-catalogINCREASING RECURRENCE OF OUR MODEL17
H1 FY18 PERFORMANCEH1FY18NON-IFRS OPERATING INCOME: 3M , up 65M yoyCASH FLOW FROM OPERATION: -84 M ,NET DEBT: 186up 97M yoyM Working capital impact18
H1 FY18: NON-IFRS P&L million, except for per share dataH1 2017-18H1 2016-17%SalesGross 23,8)(44,0)Non-IFRS Selling expenses(138,6)(29,7)(113,4)(40,3)Non-IFRS G & A expenses(61,9)(13,3)(51,0)(18,1)Non-IFRS SG & A expenses(200,5)(43,0)(164,4)(58,4)Non IFRS operating income3,10,7(61,8)(22,0)Non-IFRS R&D expensesNet Financial Income(7,3)(1,6)Share in profit of associates(0,1)0,0Income Tax23,727,4Non IFRS Net Income19,4(35,9)Non IFRS Diluted earnings per share0,16(0,32)122 554111 393Non IFRS nbr of shares fully diluted Gross margin up 164 M & 3 points : backcatalog (physical & digital) Gross Margin up R&D up 63 M & down 4 points : Live Ops growth, Mario Rabbids, teams bonus SG&A up 36 M & down 15 points : Mario Rabbids & change in accounting for bonus variable marketing expenses : 88 M (72 M in H1 FY17), down 7 points fixed structure costs : 113 M (93 M in H1 FY17), down 9 points19
H1 FY18: R&DH1 2017-18H1 2016-17107,472,1Depreciation of external software-related production and licenses3,27,2Royalties4,92,8 millionDepreciation of in-house software-related productionNon Capitalized R&D & others*70,941,7Total R&D P&L186,5123,8Capitalized in-house software-related productionCapitalized external software-related production and licenses(excluding future commitments)238,9231,08,011,24,92,8RoyaltiesNon Capitalized R&D & others*Total R&D Cash70,941,7322,8286,7*mostly Post-Launch content 63 M increase in total R&D P&L : Mario Rabbids, Post-Launch content, teams bonus 36 M increase in total R&D Cash : Mostly Post Launch Content, teams bonus20
H1 FY18: IFRS / NON-IFRS RECONCILIATIONH1 2017-18 million,except for per share dataIFRSAdjustment466,2SalesH1 2016-17Non IFRSIFRS466,2281,4AdjustmentNon ng Income(34,4)37,53,1(90,3)28,5(61,8)Net Financial income(11,4)4,1(7,3)(3,9)2,3(1,6)(0,1)0,0Total Operating expensesStock-based compensationNon-current operating incomeand expensesShare in profit of associates(0,1)0,0Income tax25,1(1,4)23,728,1(0,7)27,4Net Income(20,8)40,219,4(66,1)30,2(35,9)Diluted earnings per share(0,19)0,350,16(0,59)0,27(0,32) Non-current operating expenses : 10 M related to brand and goodwill depreciation Net Financial charge adjustment : 4 M related to the implicit convertible bond option costs21
H1 FY18: CASH FLOWS & CLOSING CASH POSITION millionOpening cash positionCash flows from operationsChange in WCRCash flows from operating activitiesNet investment in capital assetsNet free cash flowNet acquisitions/disposalsProceeds from issue of capital and other financial flowsNet acquisitions/disposals of own sharesEffect of exchange rate fluctuationsEquity componentDecrease/(increase) in net debtClosing cash positionH1 2017-18H1 1)39,6(13,9)(1,8)(105,7)79,4(186,2)37,7 97 M increase in CF from operations : EBIT improvement narrowing of R&D P&L/Cash gap 2 M improvement in WCR : Lower improvement vs last year H1 due mostly to Trade Receivables : strong revenue growth & end of August release of Mario Rabbids Kingdom Battle Inventories : End of August Release of Mario Rabbids Kingdom Battle & mid October release of SouthPark the Fractured but Whole Other Receivables : no factoring of Quebec subsidies in H122
AGENDAO U T S TA N D I N G G A M E S X P L O N G T E R M S U P P O R TDRIVE FINANCIAL OUTPERFORMANCEAGM: MASSIVE SHAREHOLDERS SUPPORTH1 FY18 PERFORMANCEF Y 1 8 & F Y 1 9 TA R G E T S23
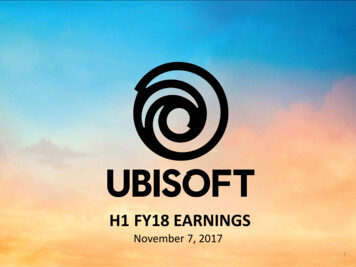
FY18: FURTHER EARNINGS GROWTHREVENUES: 1 700 M , 16%Q3: 630 M NON-IFRS OPERATING INCOME: 270 M FY18Growth driven by:Stronger new releasesStronger Player Recurring Investment6 Live games operated Full Year (vs. 3)Digital: 50% of total rev.Back-Catalog: 40% of total rev.24
FY18: THE ASSASSIN’S CREED FRANCHISE IS OFFICIALLY BACKFIRST 10 DAYS UNIT SALES X2 VS SYNDICATE*DIGITAL DISTRIBUTION UP 20 POINTSPRI TRENDING VERY NICELYBIGGESTPOST LAUNCH CONTENTEVER25*sources : comparable basis, internal estimates based on 10 days of sales
FY18: H2 LINE-UPQ3Q4EXPANSIONS Q326
FY19: STRONG YEAR CONFIRMEDREVENUES: 2.1BN FY19NON-IFRS OPERATING INCOME: 440 M 21% MARGINFREE CASH FLOW: 300M 27
BEYOND FY19We are delighted that the 3-year plan we presented to youback in February 2016 is going so well thanks to the strongoutperformance from our teams and the humbling support of ourgrowing player communities.We continue to do what we do best. That is building Ubisoft step by step,with a long term view of what is in the best interest for our players,employees and shareholders.You can be assured that we will not stop there and that there is a lotmore to come well beyond 2019. We are indeed committed to creategreat value over the long term.Yves Guillemot, President and Chief Executive Officer28
THANKTHANKYOUYOU29
Depreciation of in-house software-related production 107,4 72,1 Depreciation of external software-related production and licenses 3,2 7,2 Royalties 4,9 2,8 Non Capitalized R&D & others* 70,9 41,7 Total R&D P&L 186,5 123,8 Capitalized in-house software-related production 238,9 231,0 Capitalized external software-related production and licenses 8 .