Transcription
How to ImproveHealthcare PayerOperations with DataAndy Dé, Senior Industry Director for Healthcare and Life Sciences
The Root Cause for Better CareMore than ever, the healthcare industry is challenged with corralling and understandingmassive amounts of data to drive operational efficiencies and improve patient outcomes.As healthcare payers adopt new practices to align with the value-based care paradigm,they are critically challenged with identifying root causes to solve issues in order toimprove and sustain performance.Many healthcare payer organizations are transitioning from old business models to anew risk-based approach, and will need operational frameworks that enable monitoring,measuring, and continuous process improvement to help drive new revenue opportunities,lower costs, and better enable efficiencies. Along the way, organizations are discoveringoperational excellence simply isn’t possible without meaningful data insights.Here are four ways leading healthcare payers are using data tomodernize operations:1 234Enabling wellnessand diseasemanagementwith self-serviceanalyticsIncreasingcustomer serviceeffiiencies withreal-timeanalyticsImprovinghealthcare workerproductivity withdata blendingPowering ad-hocanalyticsfor claimsmanagement2
1. E nabling Wellness and Disease Managementwith Self-Service AnalyticsSelf-service analytics allow healthcare payers to access and find insights from publichealth data sources like Medicare and Medicaid. These insights are used by healthcarepayers to segment, target, and improve population health to drive wellness and diseasemanagement initiatives for their customers—who are patients.By enabling anyone with the ability to explore public health data, any nurse case manager,analyst, business leader, or even a patient can see and understand the current state andrisks associated with a portfolio of diseases.If an everyday citizen can access and review a self-service dashboard with health anddisease information about their specific issue, demographic or zip code, they are moreempowered to proactively take the next best steps to seek treatment or implementpreventative measures.The federal and state governments can also use self-service to monitor, measure, analyzeand improve impact for their health programs.The Blue Cross Blue Shield Association (BCBSA), a national group of 36 independent andcommunity-based companies, used self-service analytics to deliver a new populationhealth index in November of 2016. The Blue Cross Blue Shield Health Index is a uniquemetric illustrating the state of America’s health. The health index is powered by claimsdata from more than 40 million BCBS members, and it measures the impact of more than200 common diseases.Blue Cross and Blue Shield companies are committed to transforming our healthcaresystem and the health of our nation through actionable data. This Health Index usesthe breadth and depth of BCBS data to bring critical health insights to policymakers,community leaders, business leaders and healthcare professionals, helping themfurther focus efforts to improve their communities’ health.— S COTT SEROTA, PRESIDENT AND CEO, BLUE CROSS BLUE SHIELD ASSOCIATION (BCBSA)3
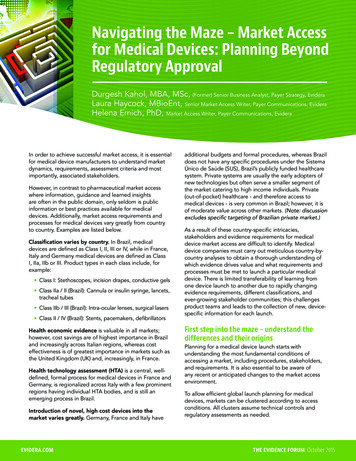
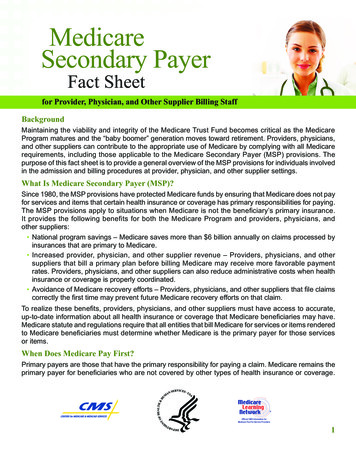
This self-service dashboard shows that depression, anxiety, hypertension, diabetes,high cholesterol, and substance use disorders are the top five conditions nationally,causing approximately 30% of insured Americans’ overall reduction in health.The BCBS Health Index is an excellent tool for improving healthcare payers operationsbecause it offers population health segmentation down to a zip code level, and canproactively identify the counties with the highest risks for chronic diseases likehypertension and diabetes. This analysis can then help shape the programs for addressingthese chronic diseases at a national, state, and county level.Additionally, the self-service index brings critical health insights to policymakers,community leaders, business leaders and healthcare professionals, helping them furtherfocus efforts to improve their communities’ health.4
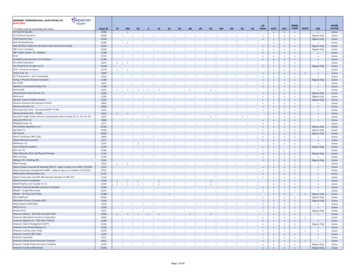
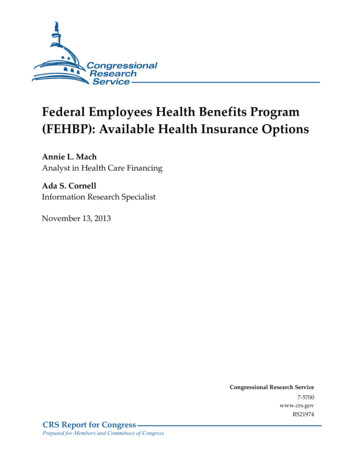
2. Increasing Customer Service Efficiencieswith Real-Time AnalyticsMost healthcare payers offer web and mobile portals, as well as call centers, for customerservice. However, most customers do not take the time to acquaint themselves withthe capabilities of a self-service customer portal and choose to call a customer servicerepresentative instead. This common behavior generates higher demands on call centersfor even trivial questions— which significantly increases the cost of operating the callcenters, all the while the web and mobile portals remain underutilized.Blue Shield of California, a nonprofit healthcare payer serving more than 3.5 millionmembers, needed to make improvements with their customer service inefficiency. Bymonitoring and accessing real-time customer behavior data, they were able to comparetheir customer web and mobile portal metrics to their call center metrics.Utilizing visualizations with real-time data, they found that only 12% of membersaccess the self-service portal and these same members also drive more than 40% of thecall volume. Sub-optimal usage of the portals increases the load on the call centers anddramatically drives up the cost of customer service.By using real-time data, Blue Shield of California identified 57 MM in potential incost-savings. BSC then took action and created campaigns specifically to educate theircustomers on the capabilities and functionality offered by their self-service portals.Real-time data helped BSC–improve delivery of customer service and lower the cost of theoperation.Post Login 78%14.85%Dec67.32%16.80%No Call in 30 DaysCalled in 1 DayCalled in 10 DaysSame DayCalled in 5 DaysCalled in 15 Days14.44%Called in 30 DaysThis dashboard, crafted by Blue Shield of California, monitors, measures, and analyzesthe behaviors of customers who access call centers in real-time. It is used for identifyingefficiencies and cost savings.5
3. Improving healthcare worker productivity with data blendingHealthcare payer organizations accumulate massive amounts of customer data that’sstored in silos across the entire enterprise. Connecting these islands of information is keyto understanding a 360-degree view of each patient and their access to care. So the abilityto aggregate and blend data across completely disparate data sources is key.Empowering healthcare workers, like nurse case managers, with a single source of truthfor each patient will offer more insights needed to improve productivity. Insights foundwith blended data can help nurse case managers better point patients to services ortreatments, and reduce costs along the way.For example, if a patient needs an additional service or test, a nurse case manager can pullup a dashboard with blended data to quickly discern what treatments the patient can haveaccess too, and whether payers will cover it or not.Blue Cross Blue Shield of North Carolina (BCBS NC) blends data across 13 different datasources, and delivers a holistic view of each patient to their case managers. This solution,named ‘Minerva’, was built from prototype to productized solution in just 90 days.The dashboard aggregates and blends patient data from thirteen disparate datasources—like demographics, group coverage, benefits, risk information, claims history,program enrollments, care gaps, and group incentives.This single unified dashboard allows nurse case managers to quickly access patientinsights in seconds, not hours. Not only does higher employee productivity ensure a bettercustomer experience, it also improves costs savings.6
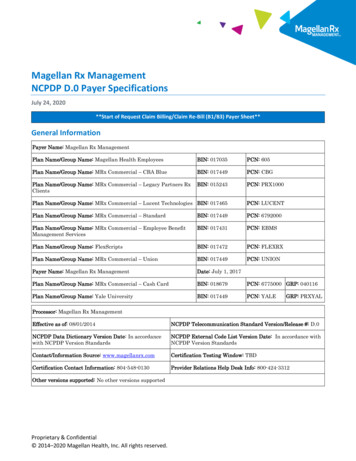
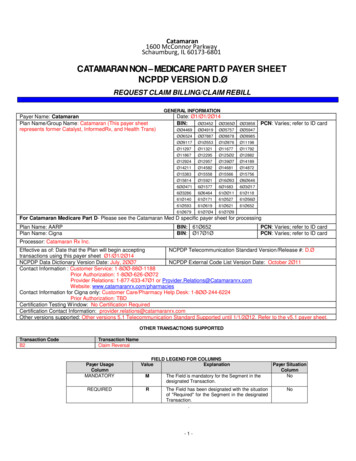
4. Powering ad-hoc analytics for claims managementHealthcare payers have to process millions of claims each year, and also screen these forfraud, waste, and abuse, which is often manual, tedious, time consuming, and fraughtwith human errors.This involves capturing data from multiple, disconnected systems, cleansing andnormalizing the data, and then analyzing the data to segment the covered patientpopulation based on risk. Ad-hoc analytics helps claims managers answer their specificquestions on a case-by-case basis more efficiently.Optum, a subsidiary of United Health Care, is the largest healthcare payer in the U.S.Optum aggregates their claims data from its disparate IT systems, and uses ad-hocanalytics to deliver actionable insights on a daily basis to its C-suite, business leaders,and analysts.With ad-hoc analysis and automation, claims monitoring now takes four hours insteadof four weeks. With early warning indicators that are color coded for analysts to expediteresolutions, a Sankey diagram provides traceability of each claim by each facility/healthplan between multiple Optum operational teams.7
Optum’s Command Center dashboard has visible key performance indicators (KPIs) forreal-time assessment of key metrics. Users can focus on rapid prioritization of contractsbased on risk and proactively identify members who need escalated intervention andengagement.Reports pertaining to health management, claims management, utilization management,provider relations are also shared with external healthcare provider clientele.ConclusionMonitoring, measuring, and analyzing healthcare payer data will improve operationsby increasing employee productivity, lower costs, and enable a risk-based approach towellness and disease management. It will also secure new customers and improve patientoutcomes. Finding efficiencies in claims management, patient safety, and compliance withdata is easier than you think—and integrating self-service data visualizations into yourhealthcare operations and processes is even easier.About TableauTableau Software helps people see and understand their data no matter how big it is,or how many systems it is stored in. Quickly connect, blend, visualize and share datadashboards with a seamless experience from the PC to the iPad. Create and publishdashboards with automatic data updates, and share them with colleagues, partners orcustomers—no programming skills required.Begin a free trial today www.tableau.com/trial.8
About the AuthorAndy Dé, Senior Industry Director for Healthcare and Life Sciences, Tableau Software.Andy Dé is the industry strategist and solutions leader for healthcare and life sciences atTableau. He has more than 20 years of enterprise software innovation strategy, portfoliomanagement and go-to-market strategy, planning and execution experience at GEHealthcare, SAP, Health-Sciences and i2.Tableau and Tableau Software are trademarks of Tableau Software, Inc. All other companyand product names may be trademarks of the respective companies with which they are associated.
Here are four ways leading healthcare payers are using data to modernize operations: Enabling wellness 1 and disease management with self-service analytics 2 Increasing customer service effiiencies with real-time analytics 3 Improving healthcare worker productivity with data blending 4 Powering ad-hoc analytics for claims management