Transcription
Practical Example of The Use of a Vector Network AnalyzerRecently I noticed that my 20 m homebrew vertical was exhibiting a high SWR on my radio. Thisantenna had been working fine; however, it abruptly stopped working. So, I used my Vector NetworkAnalyzer (VNA) to determine what was wrong without visual inspection or removing the coax system.Here is the story.BACKGROUNDThis 20 m antenna is a 16 ft tall monopole made from ¾” copper pipe insulated at the base with twocounterpoise wires attached to the coax shield at the base of the vertical. It cost less than 40 to build.A coaxial balun of 8 turns of RG8X is coiled up near the base of the antenna. In addition, to get from theantenna to the radio the signal goes through a lightning arrester and a wall feedthrough. Some portionsof the coax system also go through conduit making removal a requirement for inspection. Removing theentire coax system could be done; however, it would require time and effort that is unnecessary withthe approach used here.The VNA that I used was a nanoVNA-F model purchased from Amazon but built in China and thesoftware was nanoVNA-Saver written by Rune Broberg, 5Q5R. The software is free and the nanoVNAF is available for about 115 to 140 depending on where you get it and how quickly it is delivered toyour door. The nanoVNA device was calibrated from 50 kHz to 30 MHz and used for collecting thedata shown. The nanoVNA-Saver software saves “.s1p” files which are S11 files in a relativelystandard format that can be read by a variety of software including Microsoft Excel. All of the plotscreated here were created using the nanoVNA-Saver software.PROCESS AND DATAI disconnected the coax to the antenna from the radio and connected the coax to the VNA which hadbeen calibrated over the 50 kHz to 30 MHz band. Figure 1 shows the measured return loss at the shackend of the cable. This figure does not show a good return loss at any frequency between 50 kHz and 30MHz. There are only 101 points in the data set. The frequency step size is 299.5 kHz which is adequatefor our purposes. Figure 2 is the SWR and doesn’t look any better. As we know, these two plots aredifferent ways of looking at the same thing. Clearly there is a problem.B. L. Burns, WA5VAH13/13/2020
Practical Example of The Use of a Vector Network AnalyzerFigure 1. Measured return loss of the antenna at the shack end of the coax.Figure 2. Measured SWR of the antenna at the shack end of the coax.Using the complex data collected for the return loss and SWR measurement, PC software and VNAfirmware can compute the Time-Domain Reflectometry (TDR.) Basically this is a way of looking forreflections and measuring impedance as a function of time. It is as though we sent a pulse containing 30MHz of bandwidth along the transmission line and looked for reflections that show up at the input tothe transmission line. If we have a good transmission line which is open on the far end we will see 50B. L. Burns, WA5VAH23/13/2020
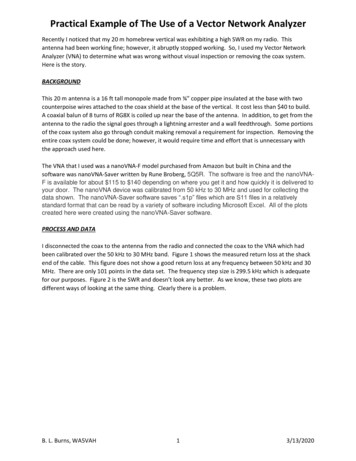
Practical Example of The Use of a Vector Network Analyzerohms for the impedance for the length of the transmission line followed by a high impedance at adistance beyond the length of the transmission line since the transmission line is not terminated.Figure 3 is the plot of the broken antenna’s TDR functions. The blue plot is the impulse response of thetransmission line system and the green plot is the impedance versus time of the system. The scale onthe left side is the impedance calibrated in ohms for the green plot. No calibration for the impulseresponse is provided or needed. It is simply a normalized function in this presentation. From the greenplot we can see that the impedance is approximately 50 ohms until we get near the end of thetransmission line where the impedance rises to several hundred ohms.If we understand the meaning of the two plots in Figure 3 we can quickly deduce that the entiretransmission line is just fine but there is a high impedance and probably an open circuit at the far end ofthe transmission line. For the blue plot we can see that there is one small reflection until we get to24.72 m. If we wish greater fidelity in the distance measurement we need to use more bandwidth in themeasurements (for example 50 kHz to 100 MHz.) For our purposes the measurements over 50 kHz to 30MHz are sufficient.Figure 3. TDR of the antenna with poor return loss and high SWR.The velocity factor of the cable (0.82) must be included for this measured length to be similar to thephysical length of the cable. In this case, I did put the velocity factor into the nanoVNA-Saver softwarethat produced the TDR plot. It turns out that the cable is approximately 81 ft long. The TDRmeasurement shows the first major reflection to occur at 24.72 m. This is equivalent to 81.1 ft of cablewhich is clearly close enough for our purposes.B. L. Burns, WA5VAH33/13/2020
Practical Example of The Use of a Vector Network AnalyzerINSPECTION AND REPAIRInspecting the antenna at the base revealed that a connection from the center conductor of the coax tothe radiating element of the vertical antenna had become corroded over time and weather. By cleaningup and improving this single connection I was able to return the antenna to service. There was no needto remove the entire coax system and inspect every inch for problems. All of these components wereexonerated without removing them or visually inspecting them. We had already done all of this by usingthe TDR measurement shown above. Indeed, the radio now shows a low SWR on the 20 m band as well.VNA DATA AFTER REPAIRThe return loss measurement after repair is shown in Figure 4. The SWR measurement after repair isshown in Figure 5. The red marker in Figure 4 and Figure 5 is set to 14.126 MHz which is in the low endof the 20 m band. The return loss at this frequency is -18 .1 dB and the SWR is 1.29. These numbersclearly indicate the antenna is now connected properly to the coax and that the impedance match at theshack end of the cable is very good. The antenna was originally tuned to have low SWR in the low endof the band because I use it frequently for PSK31 on 14.07015 MHz and FT8 operations on 14.074 MHz.These measurement indicates that the antenna is still tuned to that end of the band. However, if othertuning is desired, this data gives information that will be useful in tuning the antenna to a different partof the band.Figure 4. Measured return loss of the antenna at the shack end of the coax after repair.B. L. Burns, WA5VAH43/13/2020
Practical Example of The Use of a Vector Network AnalyzerFigure 5. Measured SWR of the antenna at the shack end of the coax after repair.Although the plots shown in Figure 4 and Figure 5 are clearly enough to verify that the antenna is nowworking correctly, it is interesting to look at the TDR response after repair for this simple verticalantenna. Figure 6 shows the TDR plots for the antenna after repair.Figure 6. TDR of the antenna after repair.Careful comparison of the two TDR plots shows important differences. The impedance (the green trace)beyond the length of the cable is now decidedly different than before. At the end of the cable we see aslower rise in the impedance until reaching about 125 ohms where the impedance flattens out for aB. L. Burns, WA5VAH53/13/2020
Practical Example of The Use of a Vector Network Analyzershort distance and then another slow rise in the impedance toward 400 ohms. This is the effect of thevertical radiator doing its job now that it is connected to the coax. Complete understanding of theseplots is well beyond the scope of this document. Modeling software is readily available to assist withthis understanding, if desired.I hope this example helps folks understand one useful application of a VNA device to ham radioantennas and transmission lines. Here are a few key points.1. An antenna system failure was isolated without removing or visually inspecting all of thecomponents in the transmission line and antenna system.2. Appropriate measurements using an inexpensive VNA and free software were used.3. It is important to know the velocity factor for the coaxial cables in your antenna system to utilizeTDR capabilities of this type.4. VNA measurements of return loss and SWR can readily verify when an antenna system isoperating correctly from an impedance matching perspective.5. While not shown above, the data provided by a VNA can be used to tune an antenna to adifferent frequency if the user desires.73,Bryan, WA5VAH208-960-2001B. L. Burns, WA5VAH63/13/2020
Practical Example of The Use of a Vector Network Analyzer B. L. Burns, WA5VAH 3 3/13/2020 ohms for the impedance for the length of the transmission line followed by a high impedance at a distance beyond the length of the transmission line since the transmission line is not terminated. Figure 3 is the plot of the broken antenna's TDR functions.