Transcription
Financial StatementsWith Independent Auditor’s ReportJune 30, 2016Rose State College
Rose State CollegeTable of ContentsJune 30, 2016Independent Auditor’s Report .1Management's Discussion and AnalysisFinancial StatementsStatement of Net Position . 18Statement of Revenues, Expenses, and Changes in Net Position . 19Statement of Cash Flows . 20Notes to Financial Statements . 22Schedule of the College's Proportionate Share of the Net Pension Liability (OTRS). 55Schedule of the College's Contributions (OTRS) . 56Combining Schedule of Net Position . 57Combining Schedule of Revenues, Expenses, and Changes in Net Position . 58Reports Required by Government Auditing StandardsIndependent Auditor’s Report on Internal Control over Financial Reporting and on Complianceand Other Matters Based on an Audit of Financial Statements Performed in Accordance withGovernment Auditing Standards . 59Reports Required by Uniform GuidanceIndependent Auditor’s Report on Compliance for Its Major Federal Program and Report onInternal Control Over Compliance Required by Uniform Guidance. 61Schedule of Expenditures of Federal Awards . 63Notes Schedule of Expenditures of Federal Awards . 65Schedule of Findings and Questioned Costs . 66Summary Schedule of Prior Year Findings . 69
Independent Auditor’s ReportThe Board of RegentsRose State CollegeMidwest City, OklahomaReport on the Financial StatementsWe have audited the accompanying financial statements of Rose State College (the College) and thediscretely presented component unit of Rose State College Foundation, Inc. as of and for the year endedJune 30, 2016, and the related notes to the financial statements, which collectively comprise the College’sbasic financial statements as listed in the table of contents.Management’s Responsibility for the Financial StatementsManagement is responsible for the preparation and fair presentation of these financial statements inaccordance with accounting principles generally accepted in the United States of America; this includesthe design, implementation, and maintenance of internal control relevant to the preparation and fairpresentation of financial statements that are free from material misstatement, whether due to fraud orerror.Auditor’s ResponsibilityOur responsibility is to express opinions on these financial statements based on our audit. We conductedour audit in accordance with auditing standards generally accepted in the United States of America andthe standards applicable to financial audits contained in Government Auditing Standards, issued by theComptroller General of the United States. Those standards require that we plan and perform the audit toobtain reasonable assurance about whether the financial statements are free from material misstatement.An audit involves performing procedures to obtain audit evidence about the amounts and disclosures inthe financial statements. The procedures selected depend on the auditor’s judgment, including theassessment of the risks of material misstatement of the financial statements, whether due to fraud or error.In making those risk assessments, the auditor considers internal control relevant to the entity’s preparationand fair presentation of the financial statements in order to design audit procedures that are appropriate inthe circumstances, but not for the purpose of expressing an opinion on the effectiveness of the entity’sinternal control. Accordingly, we express no such opinion. An audit also includes evaluating theappropriateness of accounting policies used and the reasonableness of significant accounting estimatesmade by management, as well as evaluating the overall presentation of the financial statements.We believe that the audit evidence we have obtained is sufficient and appropriate to provide a basis forour audit opinions.w ww .ei de bai ll y .com1601 N.W. Expressway, Ste. 1900 Oklahoma City, OK 73118-1429 T 405.478.3334 F 405.478.5673 EOE1
OpinionsIn our opinion, the financial statements referred to above present fairly, in all material respects, therespective financial position of the College and the discretely presented component unit as of June 30,2016, and the respective changes in financial position and cash flows for the year then ended inaccordance with accounting principles generally accepted in the United States of America.Change in Accounting PrincipleAs discussed in Note 1 to the financial statements, the College has adopted the provisions of GASBStatement No. 82, Pension Issues, an amendment of GASB Statements No. 67, No. 68, and No 73, whichhas resulted in a restatement of the net position as of July 1, 2015. Our opinions are not modified withrespect to this matter.Other MattersRequired Supplementary InformationAccounting principles generally accepted in the United States of America require that the management’sdiscussion and analysis, the schedule of the College’s proportionate share of the net pension liability, andthe schedule of the College’s contributions be presented to supplement the basic financial statements.Such information, although not a part of the basic financial statements, is required by the GovernmentalAccounting Standards Board, who considers it to be an essential part of financial reporting for placing thebasic financial statements in an appropriate operational, economic, or historical context. We have appliedcertain limited procedures to the required supplementary information in accordance with auditingstandards generally accepted in the United States of America, which consisted of inquiries ofmanagement about the methods of preparing the information and comparing the information forconsistency with management’s responses to our inquiries, the basic financial statements, and otherknowledge we obtained during our audit of the basic financial statements. We do not express an opinionor provide any assurance on the information because the limited procedures do not provide us withsufficient evidence to express an opinion or provide any assurance.Other InformationOur audit was conducted for the purpose of forming opinions on the financial statements that collectivelycomprise the College’s basic financial statements. The information shown in the table of contents assupplementary information is presented for purposes of additional analysis and is not a required part ofthe basic financial statements. The schedule of expenditures of federal awards is presented for purposes ofadditional analysis as required by Title 2 U.S. Code of Federal Regulations (CFR) Part 200, UniformAdministrative Requirements, Cost Principles, and Audit Requirements for Federal Awards, and is alsonot a required part of the financial statements.The schedule of expenditures of federal awards and the combining schedules are the responsibility ofmanagement and were derived from and relate directly to the underlying accounting and other recordsused to prepare the financial statements. The information has been subjected to the auditing proceduresapplied in the audit of the financial statements and certain additional procedures, including comparing andreconciling such information directly to the underlying accounting and other records used to prepare thefinancial statements or to the financial statements themselves, and other procedures in accordance withauditing standards generally accepted in the United States of America. In our opinion the information isfairly stated in all material respects in relation to the financial statements taken as a whole.2
Other Reporting Required by Government Auditing StandardsIn accordance with Government Auditing Standards, we have also issued our report dated October 31,2016 on our consideration of the College’s internal control over financial reporting and on our tests of itscompliance with certain provisions of laws, regulations, contracts, and grant agreements and othermatters. The purpose of that report is to describe the scope of our testing of internal control over financialreporting and compliance and the results of that testing, and not to provide an opinion on internal controlover financial reporting or on compliance. That report is an integral part of an audit performed inaccordance with Government Auditing Standards in considering the College’s internal control overfinancial reporting and compliance.Oklahoma City, OklahomaOctober 31, 20163
Rose State CollegeA Component Unit of the State of OklahomaManagement’s Discussion and Analysis (Unaudited)Fiscal Year Ended June 30, 2016IntroductionThe discussion and analysis of Rose State College’s (the College) financial statements provides an overview of theCollege’s financial activities for the year ended June 30, 2016. Since the management’s discussion and analysis isdesigned to focus on the College’s financial performance based on current conditions, activities resulting in change,and other currently known facts, please read it in conjunction with the College’s basic financial statements andfootnotes. These financial statements are prepared in accordance with Governmental Accounting Standards Board(GASB) principles.These financial statements reflect the implementation of GASB statement 82, issued March 2016, dealing withamong other things, the classification of payments made by employers to a pension plan in fulfillment of theemployee’s contribution requirement. Statement 82 amends GASB No. 67 and No. 68 and No. 73, all implementedwith the FY15 statements, and dealt with the accounting and presentation of pension plan contributions and thepresentation of the unfunded liability of the Oklahoma Teachers Retirement System (OTRS). All regular RoseState College employees are members of the Oklahoma Teacher’s Retirement System and the College pays theemployee’s portion of the required contribution each month on behalf of the employee. The implementation ofGASB No. 82 required a restatement of the beginning net position carried forward from the fiscal 2015 statements.While the effect of all of these implementations have had a weighty impact on the resulting statements, managementdoes not believe that it indicates a true negative consequence to the financial condition of the institution.Using This Annual ReportThe accompanying financial statements reflect the activities of the College, its blended component unit, the RoseState College Technical Area Education District (the Tech District), and its discretely presented component unit,the Rose State College Foundation, Inc. (the Foundation). However, this MD&A focuses on highlights andexplanations of significant changes in financial operations and conditions only for the College and its blendedcomponent unit, the Tech District.The annual report consists of three basic financial statements: The Statement of Net Position; the Statement ofRevenues, Expenses, and Changes in Net Position; and the Statement of Cash Flows.The Statement of Net Position and the Statement of Revenues, Expenses, and Changes in Net Position reportinformation on the operation of the College. When revenues and other support exceed expenses, the result is anincrease in net position. When the reverse occurs, the result is a decrease in net position. The College’s net position- the difference between assets, liabilities and deferred inflows and deferred outflows - is one way to measure theCollege’s financial health or financial condition. As discussed above, the implementation of GASB statement 82required a restatement of the beginning net position brought forward from the College’s fiscal 2015 statementsaffecting the comparison between the two fiscal years. The reader will also need to consider other non-financialfactors, such as the quality of applicants, enrollment trends, student retention, accreditation status, the condition ofbuildings, academic programming changes and the safety of the campus in assessing the overall health of theinstitution.These statements report all assets and liabilities at current values except for capital assets which are reported athistorical costs less accumulated depreciation. All of the current year’s revenues and expenses are reported usingthe accrual basis of accounting.4
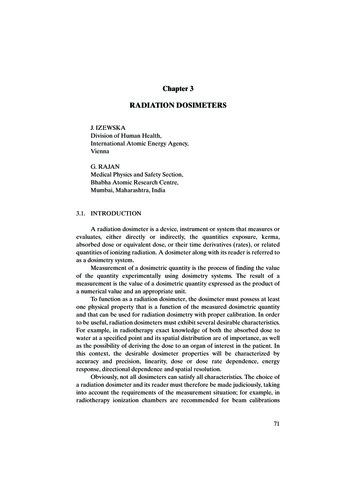
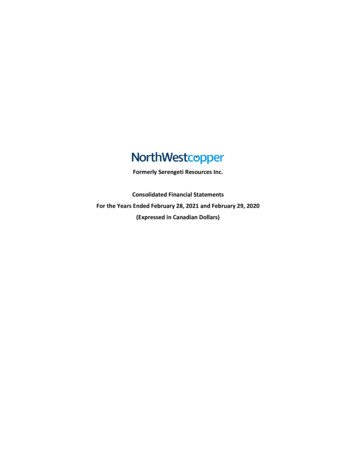
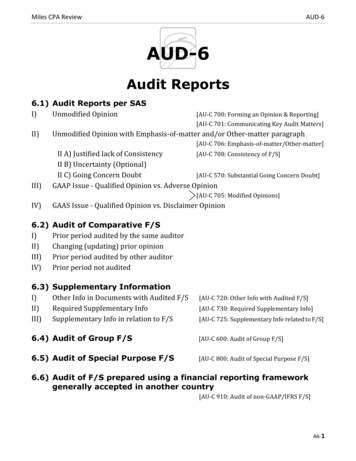
Rose State CollegeA Component Unit of the State of OklahomaManagement’s Discussion and Analysis (Unaudited)Fiscal Year Ended June 30, 2016Separate financial statements for the College’s component units are also available. Financial statements for theTech District may be obtained by contacting the Executive Vice President. The financial statements for theFoundation may be obtained by contacting their Executive Director.Financial HighlightsTotal Net PositionThis chart provides a graphicalbreakdown of net position by categoryfor the fiscal years ending June 30,2016 and 2015. 30,000,0002016 25,000,000 20,000,0002015The implementation of GASB 82 15,000,000required a restatement of FY15 ending 10,000,000Net Position to 25.7 million, a 5,000,000reduction of 1.5 million. This endingNet Position became the beginning Net Position for FY16 results. After taking (5,000,000)this restatement into account, the (10,000,000)College’s net position at June 30, 2016was 27.2 million, resulting in an (15,000,000)increase of 1.5 million compared to (20,000,000)the FY15 results. This increase, largelyNetfrom the effect of the GASB 82InvestmentRestrictedrequired restatement is reflected in thein CapitalNet PositionAssetsUnrestricted Net Position category. It2016 29,151,901 14,423,010is management’s feeling that theGASB implementations dealing with2015 29,905,919 13,589,798pensions in both FY16 and FY15 haveheavily and negatively impacted theunrestricted net position balance butthe results shown are not an indication of a decline in the financial condition of the College.UnrestrictedNet Position( 16,351,613)( 17,815,603)The net effect of implementation of GASB 82 is shown on the following table:Effect of GASB 82 Implementation:Net position, FY16 beginning as previously reportedImplementation of GASB Statement 82Deferred Outflow of ResourcesFY16 Beginning net position, restated FY201627,225,998(1,545,884)25,680,1145
Rose State CollegeA Component Unit of the State of OklahomaManagement’s Discussion and Analysis (Unaudited)Fiscal Year Ended June 30, 2016Changes in the Net Investment in Capital Assets and the Restricted Net Position balances roughly offset eachother, as shown in the graph above comparing FY16 and FY15 results. Investment in Net Capital Assets declinedslightly as a result of the recognition of increased leases payable while Restricted Net Position show increasedcash balances for short term use in debt service and scholarship activity.Results from Operations - Revenue and ExpensesTotal College revenues for fiscal 2016 decreased to 53.3 million, a decrease of 3.1 million or 5.4% in aggregatecompared to fiscal 2015 revenues of 56.4 million for all categories. Operating revenue for fiscal 2016 increased by 1.5 million or 17.5% as a result of improving enrollmentand gains in auxiliary revenue as a result of the opening of campus housing. Non-Operating Revenue decreased by 4.9 million or 10.4% compared to fiscal 2015. There are twomain factors driving the decrease: the loss of 2.8 million of appropriated state support experiencedduring the fiscal year due to mid-year state revenue failures and the reduction of 2.1 million of federalgrants related to financial aid and student loans. Other Revenue consists of capital appropriations and Oklahoma Capital Improvement Authority debtservice payments made on behalf of the college for bond proceeds funding capital improvements and theHealth Sciences building. These on-behalf payments require no cash outlay by the college thus thecollege recognizes them as revenue. In FY15 the OCIA bonds were refinanced to take advantage of lowerinterest rates and extended terms resulting in historically low on-behalf payments of 84 thousand. InFY16, returning to normal payment schedule, 529 thousand of on behalf payments were recordedresulted in the recognition of 444 thousand more in Other Revenue as compared to fiscal 2015.The following tables and charts present Total and Operating Revenues by category followed by a presentation oftotal expenses by category for the fiscal years ending June 30, 2016 and 2015.Total Revenues by Category FY16 DetailRevenue CategoryOperating RevenuesNon-OperatingRevenues2016 10,006,7172015 8,518,269ChangeF/15 to F/16 922,593)(10.4%)Other RevenuesTotal Revenues1,075,958 53,364,403713,436 56,436,026362,522 (3,071,623)50.8%(5.4%)6
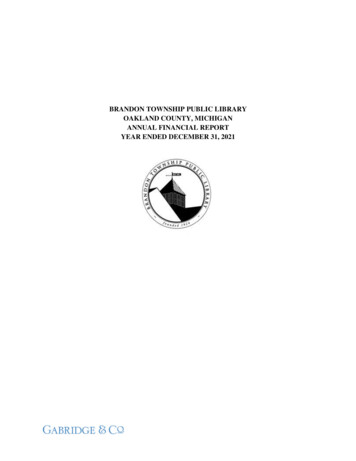
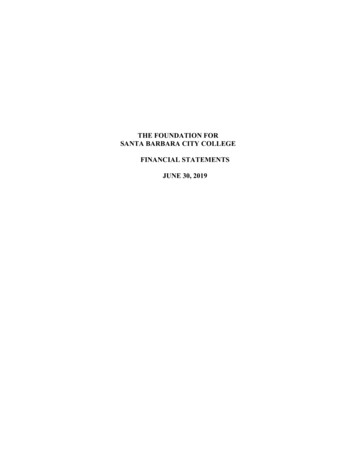
Rose State CollegeA Component Unit of the State of OklahomaManagement’s Discussion and Analysis (Unaudited)Fiscal Year Ended June 30, 2016Total Revenues by Category FY16 GraphOther Revenues 2%Non Operating Revenues 79%Consists of Capital Appropriations of 547,016 and OCIA debt servicepayments on behalf of the college of 528,942State Appropriations 18,433,446Federal and state grants 10,202,229OTRS On-behalf1,684,176Ad valorem taxes11,714,988Investment income246,889Total Non-operating 42,281,728Operating Revenue 19%See graphical and detailedbreakdown of OperatingRevenue by category, below.Operating Revenue by Category FY16Tuition & Fees 51%Auxiliary 30%Federal & LocalGrants 17%Operating RevenueCategoryFederal & LocalGrantsOther 2%2016 1,687,4362015ChangeF/15 ToF/16PercentChange 1,634,839 52,5973.2%Tuition & 952,155,101823,79438.2%275,717(31,680) 8,518,269 1,488,448(11.5%)17.5%OtherTotal Operating Rev.244,037 10,006,7177
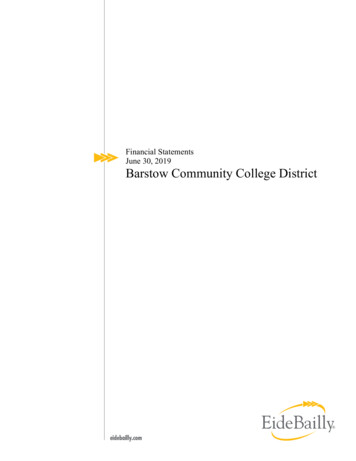
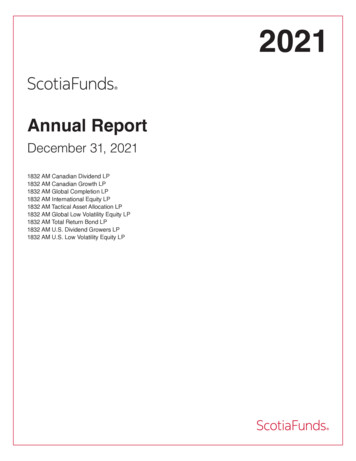
Rose State CollegeA Component Unit of the State of OklahomaManagement’s Discussion and Analysis (Unaudited)Fiscal Year Ended June 30, 2016Total Expenses by CategoryTotal expenses for fiscal 2016 were 51.8 million, an increase of 2.3 million or 4.6% compared to fiscal 2015adjusted total expenses of 49.5 million.The implementation of GASB 82, in addition to requiring a restatement of ending net position for FY15, alsorequired an adjustment to FY15 total Compensation & Employee Benefits expenses for the OTRS contributionsmade by the school on behalf of its employees. This adjustment decreased the FY15 compensation expenses by 300 thousand and makes a direct comparison of FY16 and FY15 less effective.The majority of the 2.3 million increase in FY16 recognized expenses were in categories somewhat out ofmanagement’s control. Scholarships and Other Student Aid increased 1.7 million compared to FY15 results. Thiscategory is very cyclical over the years due to the date that student refunds are made, particularly for the summerterms. For example, when comparing prior years’ results, it can be seen that this category decreased 2.7 millionin FY15 compared to FY14. This cycle is more a function of the academic calendar and will likely continue thiscyclical characteristic. Depreciation for FY16 was increased nearly 700 thousand compared to FY15 resultingfrom the addition of completed projects for infrastructure improvements, remodeling and the addition of the campushousing. Somewhat related, interest on the capital assets-related debt category increased by 600 thousandcompared to FY15 because of the newly recognized Housing Capital Lease and interest on the Tech District capitalimprovement bonds.Those expense categories that are more directly related to management’s day-to-day actions tended to show adecrease in FY16 compared to FY15 especially in the areas of Compensation (see note above about GASB 82implementation effect), Contractual Services, and Supplies and Materials. This is the result of spending reductionsin the last half of the fiscal year for the mid-year constriction of state support payments. The only major exceptionis the Other category which shows an increase mostly related to the placement of advertising (an Other categoryexpense) by College staff rather than having an advertising agency place the ads (a Contractual category expense).8
Rose State CollegeA Component Unit of the State of OklahomaManagement’s Discussion and Analysis (Unaudited)Fiscal Year Ended June 30, 2016The following graph and table may be useful in understanding the total expenses. These should be evaluated byreading the more detailed Statement of Revenues, Expenses and Changes in Net Position presentation anddiscussion, below, along with the other financial statements and footnotes.Total Expenses by Category - graph and detail tableScholarships andOther Student Aid6.2%Ad valorem taxespaid to Mid / DelPublic Schools8.8%Other3.7%Interest on capitalAsset-related debt3.2%Communications.3%Compensation &Employee Benefits56.3%Utilities2.2%Depreciation7.7%Supplies andMaterials5.2%ContractualServices6.4%Total Expenses by CategoryCompensation & Employee BenefitsContractual ServicesSupplies and rships and Other Student AidOtherAd valorem paid to Mid/DelPublic SchoolsInterest on capital asset-related debtTotal Expenses by Category2015Increase(Decrease)F/15 toF/16PercentChange 5053,233,6401,887,221 4,8270.6%1,662,8851,055,167607,71857.6% 51,821,219 49,536,5562,284,6624.6%20169
Rose State CollegeA Component Unit of the State of OklahomaManagement’s Discussion and Analysis (Unaudited)Fiscal Year Ended June 30, 2016Statement of Net PositionThe statement of net position presents the financial position of the College at the end of the fiscal year and includestotals of all assets, liabilities and deferred inflows and outflows. Net position and the change between fiscal yearsis one indicator of the current financial condition of the College. The fiscal 2016 information indicates an increaseof 1.5 million or 6% in total net position compared to fiscal 2015. This is largely due to the implementation ofGASB 82 and the restatement of FY 15 ending net position (see discussion above). The table and narrative belowwill illustrate some notable direct comparisons between the two fiscal years.This table summarizes the College’s Statement of Net Position with information as of June 30, 2016 and 2015.20162015Change F/15to F/16 31,062,060 42,414,950 4,3902,269,6554,044,735178.2%Current LiabilitiesNoncurrent LiabilitiesTotal %25.0%24.4%Deferred InflowsBookstore service concession arrangementGain on debt refinancingDeferred inflows related to pensionsTotal Deferred 23,010(16,351,613) 27,223,29829,905,91913,589,798(17,815,603) 25,680,114(754,018)833,2121,463,990 1,543,184(2.5%)6.1%8.2%6.0%Balances as of June 30thCurrent AssetsNoncurrent AssetsRestricted cash and cash equivalentsAccounts receivable, netCapital assets, net of depreciationTotal assetsDeferred OutflowsDeferred Outflows related to pensionsNet PositionNet investment in capital assetsRestricted expendableUnrestrictedTotal net positionPercentChange10
Rose State CollegeA Component Unit of the State of OklahomaManagement’s Discussion and Analysis (Unaudited)Fiscal Year Ended June 30, 2016 Please see the table on page 5, for an illustration of the impact of the GASB 82 implementation and therequired restatement of FY15 ending net position. Management continues to believe that theimplementations of GASB 68, GASB 69 and GASB 71 statements in the prior fiscal year and theimplementation of GASB 82 in the current fiscal year have had a substantial negative impact on the reportednet position of the College, especially in the unrestricted net position, deferred outflows and inflowscategories recognized in the financial statements but do not indicate a true detriment to the financialcondition of the College. Current assets, in fiscal 2016 declined by 11.4 million or 26.8% compared to fiscal 2015. This largelyreflects the use of 12.2 million of Tech District bond proceeds for the restricted purpose of capitalimprovements. As these bond funded projects are completed and put into service, there is a comparableincrease in capital assets. The increase in capital assets will be discussed below in the Non-current assetssection. The largest bond project yet to be completed is the complete remodel of the Learning ResourceCenter (LRC) which is expected to be completed in fiscal year 2017. Once the LRC project is finished, theremaining bond proceeds, approximately 3.9 million, will be exhausted. Non-current assets saw a significant increase of 20.9 million, or 39.1%, in fiscal year 2016 compared tofiscal year 2015 reflecting the increase in capital assets of 20.9 million. This primarily comes from 4.4million of completed Tech District bond projects and the addition of campus housing, the Village at RoseState valued at 13.9 million, which opened for occupancy in August 2015. The on-campus housing unitswere built using a capital lease purchase agreement with the developer. The Tech District bond projects areexpected to be finalized in calendar year 2017. Please see footnote #4 for detailed presentation of capitalasset activity and footnote #5 for a discussion of all long-term liabilities including the schedule ofamortization for the Tech District bonds and the housing capital lease payable schedule. Total liabilities increased 15.7 million between fiscal 2016 and fiscal 2015. The largest portion of theincrease results from an increase in debt related items. Current maturities of long-term debt increased 2million in FY16 compared to FY15 from principal and interest payable on the Tech District Bonds. Onlyinterest has been paid on the bonds in prior periods. The current portion of FY16 long-term liabilities reflectthe accrual of the first 1.7 million principal payment in addition to interest on the bonds. Non-currentliabilities increased approximately 10.0 million largely from the addition of 11.9 million of debt relatedto the Village at Rose State capital lease. Also, net pension obligations increased by 6.2 million comparingFY16 and FY15. Please see footnote #5 for a presentation and detailed discussion of long term liabilitiesand footnote #6 for a discussion of pension liabilities. Deferred Outflows and Deferred Inflows mainly reflect changes related to pension fund activities andaccruals of pension expenses. Please see footnote #6 for a full discussion of the pension liabilities andassociated actuarial calculation of the unfunded balance of the Teacher’s Retirement System.11
Rose State CollegeA Component Unit of the State of OklahomaManagement’s Discussion and Analysis (Unaudited)Fiscal Year Ended June 30, 2016Statement of Revenues, Expenses and Changes in Net PositionThe statement of revenues, expenses and changes in net position presents the College’s results of operations andother non-operating activities. A summarized statement of revenues, expenses and changes in net position, as ofJune 30, 2016 and 2015, appears below:20162015ChangePercentF/ 15 To 16ChangeOperating RevenuesTuition and fees, net 5,096,349 4,452,612Federal, state and local grants and contracts1,687,4361,634,83952,5973.2%Auxiliary (bookstore, food services and housing), net2,978,8952,155,101823,79438.2%OtherTotal operating revenues244,037275,71610,006,7178,518,268 643,737(31,679)0.1%(11.5%)1,488,44917.5%Operating ual services, supplies and materialsCompensation and employee iation3,983,8453,315,188668,65720.2%Utilities and hips and other student 3.8%(35,600,695)(35,437,026)State appropriations18,433,446Federal and state grants10,202,229Total operating 12915.1%Ad valorem taxes11,714,98811,864,686(149,698)(1.3%)Ad valorem taxes remitted to Mid/Del Public 415,996)(743,419)(672,577)(90.5%)Operating LossNon-operating Revenues (Expenses)OTRS on-behalf contributionsNet Non-operati
Rose State College A Component Unit of the State of Oklahoma Management's Discussion and Analysis (Unaudited) Fiscal Year Ended June 30, 2016 Introduction The discussion and analysis of Rose State College's (the College) financial statements provides an overview of the College's financial activities for the year ended June 30, 2016.