Transcription
Oracle JD Edwards EnterpriseOne Object Usage TrackingPerformance Characterization Using JD Edwards EnterpriseOneObject Usage TrackingORACLE WHITE PAPER JULY 2017
DisclaimerThe following is intended to outline our general product direction. It is intended for informationpurposes only, and may not be incorporated into any contract. It is not a commitment to deliver anymaterial, code, or functionality, and should not be relied upon in making purchasing decisions. Thedevelopment, release, and timing of any features or functionality described for Oracle’s productsremain at the sole discretion of Oracle.ORACLE JD EDWARDS ENTERPRISEONE OBJECT USAGE TRACKING – PERFORMANCE CHARACTERIZATION
Table of ContentsExecutive Summary . 2Introduction . 3Object Usage Tracking Concepts . 3Test Configuration . 4Machines and Platforms . 4Data Collection Techniques . 5Use Cases . 5Results . 6Discussion . 6Tuning Recommendations . 8Analysis . 9Conclusion . 91 ORACLE JD EDWARDS ENTERPRISEONE OBJECT TRACKING – PERFORMANCE CHARACTERIZATION
Executive SummaryFollowing the release of Object Usage Tracking in EnterpriseOne Tools 9.2.1.2, the Oracle JDEdwards EnterpriseOne development team initiated a project to characterize the performance ofinteractive applications and batch processes. The purpose of the performance characterization was todemonstrate that there is minimal impact to performance after enabling Object Usage Tracking.The resulting performance characterization concluded that there was no significant impact tointeractive applications or batch processes with Object Usage Tracking enabled. There was aconsistent minimal impact of 130ms or less than 0.5% of the total end-to-end server processing timefor both interactive and batch processes at all scaling levels of users tested (100/250/500). The Oracledevelopment team recommends that Object Usage Tracking remain enabled at all times.The recommendation is that customers follow the best practices for proper sizing of EnterpriseOnedatabase tables that store the Object Usage Tracking information as well as initiate scheduled cleanupof the object tracking detail tables so as to avoid performance issues due to large table sizes.2 ORACLE JD EDWARDS ENTERPRISEONE OBJECT TRACKING – PERFORMANCE CHARACTERIZATION
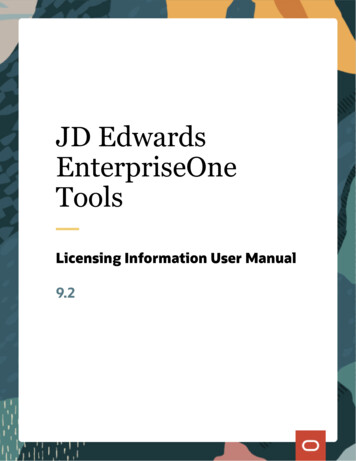
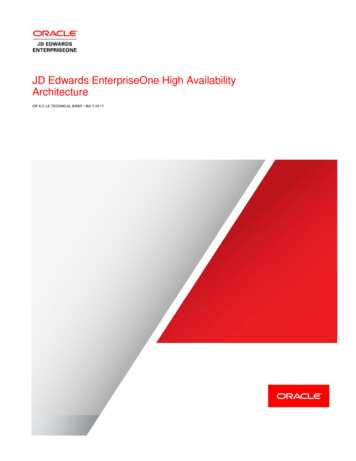
IntroductionOracle JD Edwards EnterpriseOne is an integrated applications suite of comprehensive enterprise resourceplanning (ERP) software that combines business value, standards-based technology, and deep industry experienceinto a business solution. The JD Edwards solution architecture can exist on multiple platforms and on multipledatabase architectures. This document describes performance characterization testing performed with JD EdwardsEnterpriseOne Object Usage Tracking running on an Oracle Linux based virtual machine.Object Usage Tracking ConceptsObject Usage Tracking provides enterprise-wide visibility on JD Edwards’ interactive applications and batch jobs(UBEs) executed, customized, and patched in customer environments. Out of the box UX One analytics helpscustomers identify modules in use, usage patterns, as well as peak usage and load across environments to givegreater insight for usage, performance, issue analysis, and managing compliance.Object Usage Tracking allows the recording of batch and interactive applications (and forms) accessed by users.Object Usage Tracking stores tracking records in the Object Usage Tracking Detail table (F98911) on theEnterpriseOne Database Server.Object Usage Tracking is disabled by default. You enable Object Usage Tracking through the Working with ObjectUsage Tracking Configuration (P980042T) application as illustrated in the figure below.Object Tracking Configuration (P980042T)Note: You must first enable Object Usage Tracking for the system before enabling the feature at the path code level.For more information, see the JD Edwards EnterpriseOne Tools Software Updates guide at:https://docs.oracle.com/cd/E53430 01/EOTSU/objectusage.htm#EOTSU275An Object Usage Tracking record insert in the F98911 table occurs every time a user enters an interactiveapplication or form and for every submission of a batch job.3 ORACLE JD EDWARDS ENTERPRISEONE OBJECT TRACKING – PERFORMANCE CHARACTERIZATION
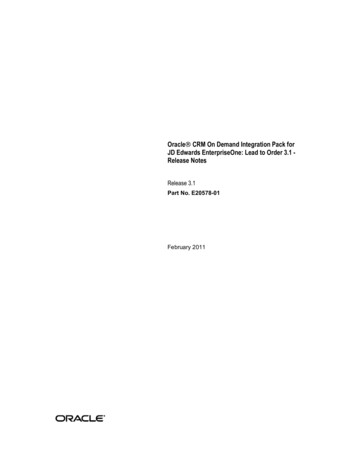
Test ConfigurationBelow is the list of the EnterpriseOne component machines that made up the architecture for testing:Machines and PlatformsEnterprise Server:» Oracle Enterprise Linux 6» Oracle Database12c (12.1.0.2) 32-bit Client» 4 VCPUs x Intel(R) Xeon(R) CPU E5-2697 @ 2.90 GHz» 12 GB RAMDatabase Server:» Oracle Enterprise Linux 6» Oracle Database12c (12.1.0.2) Enterprise Edition 64 bit» 8 VCPUs x Intel(R) Xeon(R) CPU E5-2697 @ 2.90GHz» 30 GB RAMWEB / HTML Server:» Oracle Enterprise Linux 6» 6 VCPUs x Intel(R) Xeon(R) CPU E5-2697 @ 2.90 GHz» 16 GB RAM» WebLogic Server 12c (12.1.3); Java JDK (1.8)» Single Managed Instance (4GB Heap Size)Deployment Server:» Windows 2012 R2 Enterprise Edition» 2 VCPUs x Intel(R) Xeon(R) CPU E5-2697 @ 2.90 GHz» 8 GB RAMServer Manager Console:» Oracle Enterprise Linux 6» 1 VCPUs x Intel(R) Xeon(R) CPU E5-2697 @ 2.90 GHz» 132 GB RAMOATS Test Controller:» Windows 2012 R2 Enterprise Edition» 8 VCPUs x Intel Xeon CPU E5-2697 2.90 GHz» 32 GB RAM» Oracle Application Testing Suite 12.3.0.1.0.376Software» JD Edwards EnterpriseOne Application 9.2 with Tools 9.2.1.24 ORACLE JD EDWARDS ENTERPRISEONE OBJECT TRACKING – PERFORMANCE CHARACTERIZATION
EnterpriseOne ArchitectureData Collection TechniquesThe items listed below are the metrics and data collection techniques used for testing Object Usage Tracking:» CPU/Memory/Network operating system metric collection on the EnterpriseOne Logic and JAS / HTMLservers was performed using scripts with the standard commands of ‘ps’, ‘iostat’, ‘vmstat’, ‘netstat’, and‘sar’. The LFRAME utility was used to collect all statistics on the EnterpriseOne Database server.» JVM heap memory on the JAS / HTML server collected statistics using the verbose garbage collection(GC). The following arguments to the JVM collect all GC activity and heap size data over time:-Xloggc: path to log directory /gc.log -XX:-PrintGCDetails -XX: PrintGCTimeStampsVerbose GC statistics are an excellent method of Java memory analysis and the impact of this utility onthe EnterpriseOne JAS server is negligible, making it an ideal tool for ensuring stability of theEnterpriseOne application and identifying possible memory shortages and memory leaks.» Call Object response times collection used the EnterpriseOne Server Manager Console facility included inthe EnterpriseOne base product offering.» Response times of all interactive transactions were collected using the Oracle Application Testing Suites(OATS) built-in analysis tools, which provided server end-to-end timing metrics.Use CasesThe Oracle EnterpriseOne Day-in-the-Life (DIL) Kit was used for testing EnterpriseOne Object Usage Tracking. TheDIL Kit is a set of Oracle internally automated load testing scripts for the purpose of generating various interactiveloads in an EnterpriseOne architecture environment. The DIL Kit comprises 25 interactive applications across fivefunctional modules, including Customer Service Management, Finance Management, Human Capital Management,Supplier Relationship Management, and Supply Chain Management. Another component of the DIL Kit is the 1.2 TBfoundational database that application and batch processes use, designed to represent an average-sized JDEdwards EnterpriseOne customer.5 ORACLE JD EDWARDS ENTERPRISEONE OBJECT TRACKING – PERFORMANCE CHARACTERIZATION
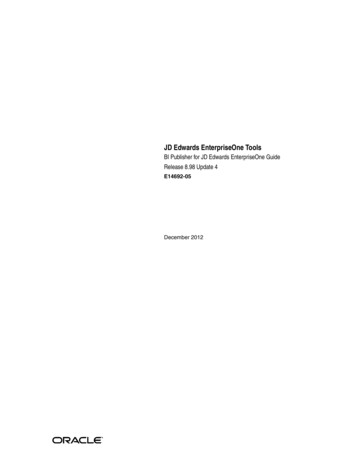
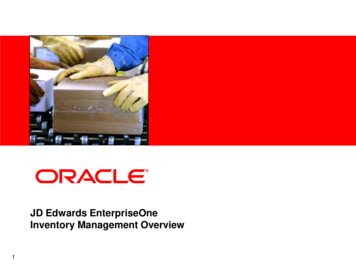
Exercising the DIL Kit for 100, 250, and 500 interactive users included testing for concurrent batch processing andcomparing the metrics with the Object Usage Tracking feature enabled. Metrics such as end-to-end response timeand operating system metrics (processor, memory, and network) statistics comprised the bulk of the comparisonsused for measuring the performance characterizations.ResultsDiscussionObject Usage Tracking recorded an entry for every instance an interactive application or form was instantiated bythe DIL Kit tests. A tracking detail record was also recorded for every batch job process submitted.The DIL Kit has 31 unique application/form entries that add records to the F98911 table. An individual DIL Kit scriptmay record 1 to 4 records per iteration, which will continue for the testing period of an hour for each use casedescribed above.For example, during DIL Kit testing of one hour, the test recorded 3800 records for a 100 users’ interactive load and9700 records for a combined 100 users’ interactive and batch load, assuming a rate of 10 UBE submissions perminute. Each batch (UBE) process entered a single record into the F98911 table. All of the batch processes testedwere single-threaded and did not launch any child batch processes.Server End-to-End MetricsAs mentioned in the summary section of this document, the impact of Object Usage Tracking is a delay ofapproximately 130ms. The below figure shows that this value is observed for each of the use cases tested.Server end-to-end response timesInteractive User Characterization of Object Usage TrackingIn isolated interactive user testing (100/250/500 users), there was a consistent baseline measurement of the serverend-to-end timing of approximately 25.60 seconds without Object Usage Tracking enabled. When Object UsageTracking is enabled, the timing of the server end-to-end time rose to an average time of 26.73 seconds or 130msdifference. This baseline and time difference was independent of the scaling of interactive users.Interactive User and Batch Characterization of Object Usage TrackingSimilar to the interactive user testing, interactive and batch load testing results were predictable in the number ofentries in the F98911 table and overhead to the end-to-end server response times. In the use cases of interactiveand batch, a baseline (Object Usage Tracking disabled) of 26.00 seconds and 26.08 was observed for 100/batchand 250/batch, respectively. Enabling Object Usage Tracking yielded a similar 130ms differential. As before, scaling6 ORACLE JD EDWARDS ENTERPRISEONE OBJECT TRACKING – PERFORMANCE CHARACTERIZATION
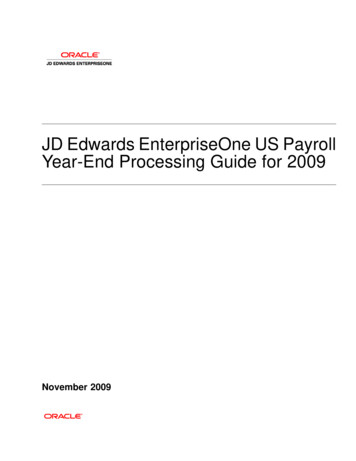
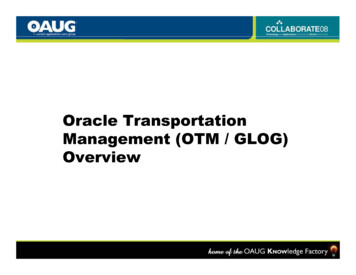
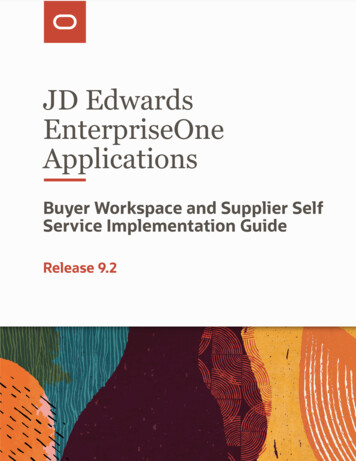
both interactive users with batch yielded the same 130ms result, making the performance impact of the ObjectUsage Tracking feature independent of load.Operating System Server CPU ProfileThe illustration of the operating system processor (CPU) is in the figure below. The figure shows the CPU resourceconsumption for the EnterpriseOne architecture component servers.CPU Usage for EnterpriseOne ComponentsAs anticipated for both interactive and interactive with batch testing, the CPU load increases on the Logic and WebServers as the testing load increases and there was no significant impact to CPU performance between havingObject Usage Tracking enabled or disabled. Although there is minor improvement to the CPU for the Logic and WebServer CPU statistics, this is a result of the EnterpriseOne application ‘waiting’ to write records and not consumingCPU resources. The observed CPU statistics are not an actual performance enhancement, but a downstream effectof the code ‘wait’ states resulting from the Object Tracking records inserted into the F98911 table.Operating System Server Memory ProfileFor the operating system memory profiles, illustrated below are the EnterpriseOne component servers. In the caseof the JAS Server, the garbage collection (GC) metrics, described later in this document, is a better observationaltool for observing memory consumption on the JAS server. The GC metrics measures the memory heap usage ofthe WebLogic managed instance memory pool.7 ORACLE JD EDWARDS ENTERPRISEONE OBJECT TRACKING – PERFORMANCE CHARACTERIZATION
Memory Usage for the EnterpriseOne Component ServersThe illustration above is the memory profiles of the EnterpriseOne components. Similar to the CPU profiles, there isnot a significant impact to memory consumption on the component servers with Object Usage Tracking enabled forinteractive user scaling and interactive user scaling with batch processing. The EnterpriseOne architecture is basedon the Linux operating system. This operating system uses a complex algorithm of memory buffers and cache withregard to memory consumption and reporting of available memory. Small variances in the reporting of memoryconsumption as was observed above is normal.JAS Server Garbage Collection ProfileThe garbage collection metrics shown in the figure below illustrate the memory profile of the WebLogic heap usage(shown in blue). The figure shows the memory profile of the WebLogic java managed instance heap usage. The testis 100 users with the inclusion of batch with Object Usage Tracking enabled.Garbage Collection metricsWithout going into details about all aspects of this graph, the profiles demonstrate that no memory issues areobserved through the garbage collection profile and a consistent memory usage and freeing of memory is seen thatis identical to a similar profile.Tuning Recommendations8 ORACLE JD EDWARDS ENTERPRISEONE OBJECT TRACKING – PERFORMANCE CHARACTERIZATION
With just a small impact (130ms) to the overall server end-to-end response time, the following is the recommendedperformance tuning for Object Usage Tracking:EnterpriseOne Datasource System - 920The F98911 table is located in the ‘System – 920’ EnterpriseOne data source. The EnterpriseOne ‘System – 920’data source is used to mainly read information from the database for normal EnterpriseOne operations.Object Usage Tracking changes the dynamics of this data source to be ‘write’ operation heavy. With thisrequirement comes the need for the database administrator to ensure that the default size of the database datasource is large enough to handle the influx of records inserting in the F98911 table. The ‘System – 920’ data sourcemust also be set to auto-extend if need be; otherwise tracking information and EnterpriseOne functionality in generalmight be compromised. There is a performance impact if the database must perform frequent auto-extension of the‘System – 920’ data source and therefore it is recommended that a large tablespace size is chosen instead of autoextension.Purging the Object Usage Tracking Detail TableOracle recommends that the user follow the documentation for Object Usage Tracking with regard to purging andsummarizing detail tracking information for future use. The F98911 table can accumulate a large number of recordsin a short time interval. Incorporating processes to ensure that this table’s growth is ‘checked’ periodically is aconcern of any performance analyst. A few key factors to this performance degradation include the size of F98911,frequency of ‘inserts’, the database’s need to enforce indexes and constraints, and the database’s need to maintaincurrent table statistics. Of course, performance degradation will vary depending on the customer’s use of ObjectUsage Tracking and the speed of the hardware on the EnterpriseOne Database Server component.AnalysisAnalysis of the cumulative metrics showed a minimal, less than 0.5%, or 130ms, performance impact to responsetime for the server end-to-end response time. Furthermore, CPU/Memory did not show any significant impact towarrant any architecture changes to the EnterpriseOne component servers.ConclusionWhen Object Usage Tracking is enabled, it has minimal impact to the end users, whether from the perspective ofscaling interactive users or interactive users with batch. Testing with the Oracle DIL Kit demonstrated the featureimpact was consistent throughout all the testing performed and was independent of the scaling of load.The average CPU/Memory profile did not show an impact of this feature on the operating system metrics.Enabling Object Usage Tracking resulted in a minimal (0.5%, 130ms) performance impact.9 ORACLE JD EDWARDS ENTERPRISEONE OBJECT TRACKING – PERFORMANCE CHARACTERIZATION
Oracle Corporation, World HeadquartersWorldwide Inquiries500 Oracle ParkwayPhone: 1.650.506.7000Redwood Shores, CA 94065, USAFax: 1.650.506.7200CONNECT W ITH r.com/oracleoracle.comCopyright 2017, Oracle and/or its affiliates. All rights reserved. This document is provided for information purposes only, and thecontents hereof are subject to change without notice. This document is not warranted to be error-free, nor subject to any otherwarranties or conditions, whether expressed orally or implied in law, including implied warranties and conditions of merchantability orfitness for a particular purpose. We specifically disclaim any liability with respect to this document, and no contractual obligations areformed either directly or indirectly by this document. This document may not be reproduced or transmitted in any form or by anymeans, electronic or mechanical, for any purpose, without our prior written permission.Oracle and Java are registered trademarks of Oracle and/or its affiliates. Other names may be trademarks of their respective owners.Intel and Intel Xeon are trademarks or registered trademarks of Intel Corporation. All SPARC trademarks are used under license andare trademarks or registered trademarks of SPARC International, Inc. AMD, Opteron, the AMD logo, and the AMD Opteron logo aretrademarks or registered trademarks of Advanced Micro Devices. UNIX is a registered trademark of The Open Group. 0617Oracle JD Edwards EnterpriseOne Object Tracking – Performance Characterization Using JD Edwards EnterpriseOneObject TrackingJuly 2017
The Oracle EnterpriseOne Day-in-the-Life (DIL) Kit was used for testing EnterpriseOne Object Usage Tracking. The DIL Kit is a set of Oracle internally automated load testing scripts for the purpose of generating various interactive loads in an EnterpriseOne architecture environment. The DIL Kit comprises 25 interactive applications across five