Transcription
American Journal of Civil Engineering and Architecture, 2015, Vol. 3, No. 3A, 1-8Available online at http://pubs.sciepub.com/ajcea/3/3A/1 Science and Education PublishingDOI:10.12691/ajcea-3-3A-1Prediction of Daylighting and Energy PerformanceUsing Artificial Neural Network and Support VectorMachineSixuan Zhou1, Dong Liu2,*1Florida State University, Tallahassee, United StatesDepartment of Civil and Architectural Engineering, Zhengzhou University, Zhengzhou, China*Corresponding author: dongliuzzu@163.com2Received March 10, 2015; Revised May 5, 2015; Accepted August 18, 2015Abstract The computerized building design has been developed to optimize building design. Machine learningtechniques are explored to help predict building design performance. However, in the current building design tools,the optimization techniques have not been integrated closely with the computerized building design tool. Only a fewtools add some optimization methods such as genetic algorithms. The aim of the paper is to use machine learningtechniques to predict the daylighting metrics such as illuminance and thermal metrics for different combinations ofwindow glazing transmittances, weather conditions and blind reflectance values. In this paper, three machinelearning algorithms were evaluated, PCA (principal component analysis), ANN (artificial neural network), SVM(support vector machine). The PCA and forward feature selection algorithms were used to extract features or reducethe dimension of the features. Four comparisons were conducted: NN with PCA, ANN without PCA, SVM withPCA, and SVM without PCA. The results show that the NN with PCA has the best accuracy for the daylighting UDIclassification problem. The ANN has an acceptable accuracy for the energy prediction problem.Keywords: artificial neural network, support vector machine, performance prediction, UDI, energy, daylighting,illuminanceCite This Article: Sixuan Zhou, and Dong Liu, “Prediction of Daylighting and Energy Performance UsingArtificial Neural Network and Support Vector Machine.” American Journal of Civil Engineering andArchitecture, vol. 3, no. 3A (2015): 1-8. doi: 10.12691/ajcea-3-3A-1.1. IntroductionDaylight harvesting has the potential to offer significantenergy and economic benefits regarding space heating,cooling, and lighting energy that represent more than halfof commercial site energy consumption. The buildingssector accounted for almost 40% of primary energyconsumption in 2008 and accounted for approximately 8%of the global primary energy consumption.The building sector consumed more primary energythan the transportation and industrial sectors. Commercialbuildings accounted for one-fifth of U.S. energyconsumption. The three main types of commercialbuildings are office space, retail space, and educationalfacilities [1]. Space heating, lighting, and space coolingrepresent more than half of commercial site energyconsumption. Daylighting has the potential to offersignificant energy and economic benefits in these threeaspects through daylight harvesting. Daylight harvestingcan result in significant electric lighting reduction incommercial buildings by the application of electriclighting controls. Turning off electric lights whensufficient daylight is available can save lighting energycosts. Because daylight introduces less heat into a buildingthan the equivalent amount of electric lighting, coolingcosts can also be reduced with appropriate daylightingdesign [2]. Because these reductions are maximizedduring peak electricity demand periods, daylightharvesting can greatly contribute to peak electricitydemand reduction [3,4].The benefits of daylighting include improving visualperformance as well as reducing energy consumption [5].Research showed that student performance and healthwere related to daylighting conditions in the classroom [6].The benefits from daylighting greatly depend on daylightavailability, which varies significantly by latitude, sunpath, sky conditions, and climate. The selection ofappropriate daylighting systems is an important approachof making best use of daylighting [7].The complexity of lighting reflection between surfacesmakes it difficult to conduct accurate manual calculations.Computer simulation tools were developed to speed thecalculation process [8]. Computer simulation methodsoffer flexibility that other methods sometimes cannotprovide and provide a convenient way of parametricallyevaluating designs in comparison to other designalternatives. The tools are based on different algorithms,which are generally based on ray tracing or radiositymethods. According to the survey conducted by Reinhartand Fitz [9], 50% of programs in the daylighting
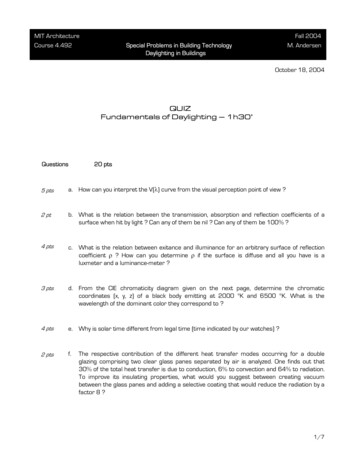
2American Journal of Civil Engineering and Architecturesimulation field use the Radiance simulation engine.Different analytical models were developed to predictbuilding performance [10]. A rule-based expert systemwas developed to integrate daylighting and thermalsimulations [11,12].The standard simulation software Radiance wasvalidated by Mardaljevic [13,14]. Reinhart and Andersen[15] also validated Radiance for simulating translucentmaterials and the results shows that the mean bias errors(MBEs) were below 9% and rooted mean square errors(RMSEs) were below 19% for all desktop and ceilingsensors considered. These simulation accuracies wereeven better than those earlier reported for standard glass,plastic, and metal material types the errors of which wereapproximately 17% (MBE) and 30% (RMSE). Onepossible reason for generating these errors was that sharpindoor illuminance gradients (e.g. shadows generated bydirect sunlight) were mitigated through translucent panels.Researchers also validated the Radiance-based software.For example, Maamari and Andersen [16] assessed theaccuracy of different lighting simulation methods topredict the performance of CFS. DElight had theadvantage of the complete daylighting simulation withoutusing other supplementary tools. The Radiance algorithmhad the advantage of avoiding the need for BTDF data,but it was limited to a specific type of CFS. Reinhart andHerkel [17] compared six Radiance-based methods:ubiquitous daylight factor, ADELINE 2.0; the classifiedweather data and ESP-r version 9, new methoddaylighting coefficient (DC) total, and new method DCwithout direct sunlight. The classified weather data servedas a reference case. They determind that the DC totalapproach showed a very low RMSE and MBE (for bothglobal and diffuse daylight). Loutzenhiser and Maxwell[18] examined measured and simulated light levels in anactual building and determined the average differences inpredictions of daylight illuminance at reference points.Andersen and Kleindienst [19] developed a visualizationtool that not only could visualize the illuminance by using“spatio-temporal irradiation maps” developed byMardaljevic [20] but also used Perez’s ASRC-CIE skymodel [21]. Hu and Olbina developed a simplifiedanalytical model to predict energy and daylight values.The model can significantly reduce the runtime whileimproving the accuracy [22]. Li reviewed the ngmeasurement, sky illuminance and luminance, anddaylighting coefficient (DC) and daylighting factor (DF)methods [23].Radiance has the capability of effectively simulatingthe daylighting condition when three types of skylight[17,24]. The software DAYSIM developed by Reinhartand Walkenhorst [25] is based on the standard lightingsimulation software Radiance. This software used theconcept of DC to simulate the daylighting. Meanwhile, theenergy consumption of electric lighting can also becalculated based on the daylighting illuminance. Thissoftware was validated using a test room [25].Different machine learning methods have been used forlighting and energy prediction. For example, neuralnetwork also were used to predict lighting performance[26]. Hu and Olbina developed a model to predict theoptimum slat angles of split blinds to achieve the designedindoor illuminance. The model was constructed based on aseries of multi-layer feed-forward artificial neuralnetworks (ANNs) [27]. To further improve the controlstrategy, a simplified control model was developed toimprove the system performance [28].This research is to use machine learning techniques topredict the daylighting metric and thermal metric for anarbitrary window glazing transmittance, weather conditionand blind reflectance values. That is to say, given anexterior climate condition, window configuration, I needto predict the hourly daylighting levels at several sensorpoints (classification problem) and hourly energyconsumption (regression problem). The daylighting metricuses hourly Useful Daylight Illuminance (UDI). The UDIis represented by the percentages of the occupied times ofthe year when the UDI is achieved (100-2000 lx), is notsufficient (less than 100 lx), or is exceeded (more than2000 lx). The hourly energy consumption of a building willbe used. E nergyPlus is developed by Department ofEnergy and was validated and recognized as one of themost accurate whole building energy simulation engines.This research uses EnergyPlus simulation engine tosimulation annual energy. The generated data were used totrain the algorithm to evaluate the performance.2. Algorithm DevelopmentFigure 1. Overall structureThe overall structure of the algorithm is shown inFigure 1. The following part of this section wouldelaborate the workflow in more details. The datageneration programs generate all data needed in themachine learning algorithms. These data include theoutput data and input data such as weather data, andbuilding design data. These were generated by Python and
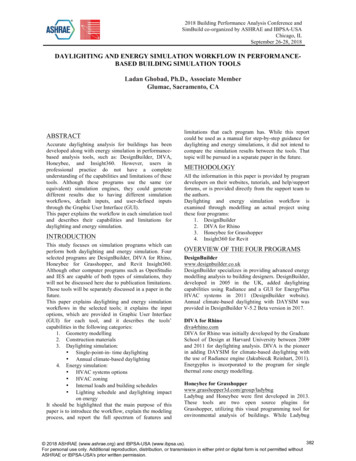
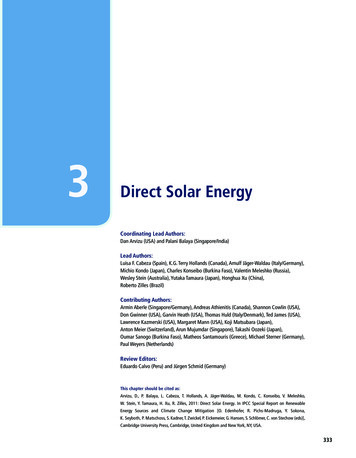
American Journal of Civil Engineering and ArchitectureMatlab programs. The daylighting and thermal data areoutput data that will be used for supervised learning.The algorithm used includes two tasks: (1)cclassification problem: This requires classifying thedaylighting level values in interior room in to differentUDI values; (2) regression problem: this requirespredicting the energy consumption based on differentweather condition and glazing and blind materials.The following section would introduce each workflowof the daylighting UDI classification problem and energyprediction problem.The algorithm mainly includes three parts: (a)algorithms used to generate input files for simulations; (b)algorithms used to process data for machine learningalgorithms.In Figure 2, a Python program was developed togenerate the input files. There were a total of 81 input files.Each file has a different glazing transmittance and blindreflectance. Then Matlab was used to extract the values ofall potential features from the simulated files. The dataincluded the potential feature data as well as the output(i.e., class) data. The implementation of the algorithms isintroduced in this section.3dimensions and so on). The 3D model of the buildingis shown in Figure 4. The model was created inSketchUp. The model can be integrated withEnergyPlus and OpenStudio tool for energysimulations. Generate the input file format specific for blindsetting specification (location, blind reflectance, slatangle, slat width, and so on) Other data related to construction materials, such aswall thermal properties. Note that most of thethermal and geometry parameters were loaded from aseparate text files because these parameters are staticand do not require parametric setting. The location of sensors such as occupancy sensorsaffects the building system performance [29]. Fromprevious study One third of the space penetration isselected in this case study.Figure 4. Illustration of building model geometry2.2. Data ParsingFigure 2. Process of generating and parsing data (input and output)2.1. Input File GenerationThe input files were generated by generating some ofthe key parameters such as window transmittance andglazing coefficients used by the simulation files. Theprogram was coded by using Python and run in commandline. The command line options are shown as follows (seeFigure 3):Figure 3. Command line options of generating simulation input filesAs shown in Figure 3, the program can achieve thefollowing functions: Generate the input file format specific for windowspecification(location,glazingparameters,An algorithm was developed to process the data fromthe simulation results. The simulations were conducted byEnergyPlus in Linux machine. The simulation time wasabout 10 hours. The algorithms were coded in Matlab. Thetotal data set include 8760*81 hourly data values includeenergy consumption as well as daylighting UDI rangevalues.To generate the data, the following procedure was used.Read the data from the generated the CSV files (8760*81tuple of data), and then process the data to extract theoccupied hour data which is from 8 am to 5 pm. The datawere used as output because we do not need to considerthe night time.Permute the data to generate the data for input andoutput variables for the machine learning algorithms.From all the occupied data, I randomize the data andselect 3285 hourly data for training and another set of3285 hourly data for testing.Use Matlab to extract the input variables from weatherfiles and generate the input data sequence according to thesequence of the permutated output data.The SVM, PCA and ANN were chosen. SVM is one ofthe best algorithms for classification, which might besuitable for this daylighting UDI classification. Someliterature used neural networks to analyze the daylightinglevels. Though their research is not classification problem.But a threshold method was used to convert it toclassification. Some literature shows that using neuralnetworks for predicting building energy usage. The
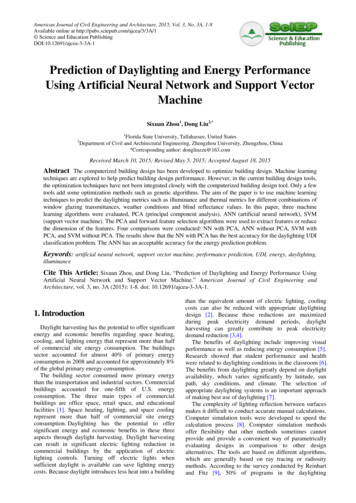
4American Journal of Civil Engineering and Architectureproblem in this paper considered more complicated issuesby including glazing transmittance and blind reflectance[27]. A number of features might be considered. Toreduce the dimensions, the principal component analysiswas used to analyze how the reduction of featuredimension affects the accuracy of the algorithms.PCA is used to generate the orthogonal input variables.The input variables will also considered by testing allpossible features to select the best ones. In the SVM and NN algorithms, different sets ofparameters were tested. For example, for SVM,Gaussian Radial Basis Function (RBF) and linearkernels were tested and their performances werecompared. Three algorithms were considered: (a) principalcomponent analysis; (b) neural network; (c) supportvector machine. PCA was used to generate theorthogonal input variables that were used by NNsand SVM in the next phase. In addition, for theneural network models, different parameters wereconsidered, for example, the hidden layers wereevaluated to select the optimal hidden layer number.The appendix shows the basic structure of the codefor neural network without/with PCA (see Figure 5).Figure 5. Process of solving the daylighting UDI classification problemThe overall process of solving the regression problemwas shown in Figure 6. The appendix shows the basicstructure of the code for SVM without/with PCA. It is similar with the classification problem. Pythonprogram will be used to generate the input files.There are a total of 81 input files. Each file has adifferent glazing transmittance and blind reflectance. Only neural network was considered. Differentparameters were evaluated to select the optimalparameters for the neural network model.The output of the classification problem (i.e.,classification of daylighting levels) is that UDI value atthe sensor point and how many types were explored, wecan use different range for this problem. For example, theranges: 0-100 lx, 100-500 lx, 500-200 lx, and 2000 lx,are standard ranges which are commonly used. But Iwould explore other ranges to provide an even precisedivision of ranges.The output variables of the regression problem are:Hourly Sensible Heating Rate, and Hourly SensibleCooling Rate.Figure 6. Process of solving the energy consumption prediction problemThe potential features come from three sources:1) Weather related features: weather files provided bythe U.S. Department of Energy and LBN, Theweather data for US can be found in the gs/energyplus/cfm/weather data3.cfm/region 4 north and central america wmo region 4/country 1 usa/cname USA2) Building related features: The building design datawill be developed based on ASHRAE standard andother building design standards. The specificbuilding design dataset will be from (1) buildingdesign book such as ASHRAE standards s/bookstore/standard-90-1#2007).3) Window related features: input file generated byPython and Matlab. The following section wouldintroduce the Python program and how to generatethe building model. In addition, Matlab is used toextract the training and testing data from all thepotential features and data.Not all the above features were used for theclassification and regression problems. Therefore, twomethods were used to extract the features for the problem.Figure 7. Cumulative sum of variances of features in PCAFirst of all, pprincipal component analysis was used toextract the most important variables that would accountfor 90% variance. All the possible data were inputted and
American Journal of Civil Engineering and Architecturethen PCA was used to analyze the input data. Figure 7shows the cumulative of the variables. Therefore, the eightvariables for neural network training was shown.Select a minimum set of features that are veryimportant to the problem. Then use forward selectionapproach: add one feature into the feature set at a timethrough comparing the output errors with this feature andoutput errors without this feature. Then add that featurethat could give the least errors and high accuracy. Repeatthis process until the error does not change much. Theneural network algorithms were used to calculate theerrors. The following input variables show a higheraccuracy for neural network: Exterior Horizontal Illuminance From Sky Exterior Horizontal Beam Illuminance Glazing Transmittance Blind Reflectance Solar Azimuth Angle Solar Altitude Angle Solar Hour Angle5using neural network. In addition, RBF shows a betterperformance than linear kernel function.Table 2. Accuracy of support vector methane using PCA andwithout using PCAKernel functionUsing PCAWithout PCARBF70.14%73.88%Linear62.15%70.08%3.2. Energy Usage PredictionThe regression problems are studied and analyzed byanalyzing different input variables as well as theparameters (see Figure 8). The calculated RMSE 127(Watts). Though the error is large, from practical means,the error is still acceptable because 127 Watt error perhour is acceptable.3. ExperimentThe data generation algorithms was coded by Python,.The machine learning algorithms were coded by usingMatlab. For the daylighting UDI classification problems,The following indicator was used to measure the accuracyof the model. Number of testing samples with correctprediction / total number of testing samplesFor the energy usage prediction problem (regressionproblem), I measure the RMSE (root-mean-square error)by using the following equation t 1 ( yt yˆt )nRMSD 2n3.1. Daylighting UDI ClassificationThere were 3285 data were used for training and anindependent 3285 data samples were used for testing. Thefollowing four different algorithms were used to test theresults.Comparison of neural networks using PCA andwithout using PCAThe Table 1 shows the accuracy of the two models: themodel using PCA shows that the input variables wereextracted by using PCA; the neural network without PCAis used by directly using the features shown in Section 4:Feature selection and extraction.Table 1. Accuracy of neural networks using PCA and without usingPCAAccuracy# of hidden layersUsing PCAWithout ison of SVM using PCA and without PCAThe two accuracy rates are shown in Table 2. The SVMwithout PCA shows a higher accuracy than the SVMwithout PCA. This is contradictory with the methodsFigure 8. Residual error of the energy prediction4. DiscussionsThe prediction accuracy of daylighting UDI is relativehigh compared to regression problem. Neural networkusing principal component analysis generated the highestaccuracy (about 96%) compared to other algorithms. Thehigh accuracy of neural networks is consistent with thecurrent research. The neural network model shows ahigher accuracy than SVM. The SVM models have onlyabout 70% though my initial expectation was that SVMshould be at least as good as neural network. There areseveral possible reasons: The feature selection used the neural networkalgorithm to select the features. Thus, this bias mightcause SVM has a lower accuracy. The feature might not be enough for SVM. Therefore,if I may add more features without using featureselection, the accuracy of SVM might become higher. There might be some other kernel functions that willgive a better result.The SVM using PCA has the lowest accuracy. Thepossible reason is that the number of features is limitedand SVM cannot accuracy create the optimal hyperplane.The results show that about 3 out of 365 days show awrong prediction by using the neural network algorithm.The features that are important for the predictions include:Exterior Horizontal Illuminance From Sky; ExteriorHorizontal Beam Illuminance; Glazing Transmittance;Blind Reflectance; Solar Azimuth Angle; Solar AltitudeAngle, and Solar Hour Angle. Sky and sun illuminance
6American Journal of Civil Engineering and Architecturelevels are important because sky light is also an mainsource of daylighting. Unlike the energy consumptionprediction, glazing and blind parameters are alsonecessary feature because change of glazing transmittanceor blind reflectance changes the daylighting levelsignificantly.For energy usage prediction, the calculated RMSE isequal to 127W. The error is not high compared to thedaylighting classification. From a practical pespective, thenumber is actually acceptable because 127W is significantdeviation for energy consumption. The method still can beused for energy prediction. The analysis shows that theenergy consumption is complicated and depends on morefeatures than normally expected. In addition, theprediction of energy consumption depends on the exteriorclimate condition. The frequent change of externaltemperature significantly affects the energy consumption.Some features that are important because they are relatedto source of energy to a large extent. For example,temperature (Zone Outdoor Wet Bulb) is an feature forenergy consumption (HVAC system). The solar is also anmain feature for energy consumption. Those features thatare significant include: Exterior Horizontal BeamIlluminance [lux](Hourly); Exterior Beam NormalIlluminance [lux](Hourly); Luminous Efficacy of SkyDiffuse Solar Radiation [lum/W](Hourly); Zone OutdoorWet Bulb [C](Hourly); Diffuse Solar [W/m2](Hourly);Direct Solar [W/m2](Hourly); Solar Azimuth Angle[deg](Hourly); Solar Altitude Angle [deg](Hourly). Someother parameters such as sky efficacy are not importantbecause sky light is not an main factor for building energyconsumption based on normal analysis.5. ConclusionsThe literature review shows that this topic has not beenstudied thoroughly because of the dynamics of skyconditions. In addition, current literature show that theprediction is mainly based on very few building designparameters such as window glazing type. Three machinelearning algorithms have been applied by analyzingdaylighting UDI classification and energy usageprediction problems. Two feature extraction methods wereused and compared: forward selection and PCA basedfeature dimension reduction. The results show that theneural network using principal component analysisgenerated the highest accuracy (about 96%) compared toother algorithms. The high accuracy of neural networks isconsistent with the current research. For the energy usageprediction problem, the calculated RMSE is about 127Wand the error is not high compared to the actual energyusage. This research has practical meanings. The literaturereview shows that currently only a very few tools integratethe machine learning techniques. The designers can usethe methods to help them design window systems. Themachine learning algorithms could not only reduce theirdesign and testing times but also could provide sensibilityanalysis by allowing them to view the trend of differentdaylighting design strategies.AppendixSupport vector machine with/without PCA%% important parameters:inIndex [1,2,13,14,17,18]; % input variable indexoutMode train 2;outMode scale01 2;isPCA 1 ; % using PCA 1; not use PCA 0;%% loadalldata importdata('alldata.dat');nd 3285;pt [1:nd];%% input for training and testing% method 1: without PCAif(isPCA 0)%%% training: inputin alldata(pt,inIndex)';%%% test::inputActIn alldata(nd 1:nd*2,inIndex)'; %% transposedEnd%%% method 2: using PCAif(isPCA 1)%%% training: input[COEFF,SCORE in,latent in] princomp(zscore(alldata));in SCORE in(pt,:)';in in(1:10,:);%%% test::input[COEFF,SCORE test,latent test] princomp(zscore(alldata));ActIn SCORE test(nd 1:nd*2,:)'; %% transposedActIn ActIn(1:10,:);end%% output for training and testing%%% training: outputout zeros(1,nd);m alldata(pt,10)';out genDaylightOut(m,nd,outMode train);%%% testing: output:m2 alldata(nd 1:nd*2,10)';ActOut noscale m2;ActOut scale01 genDaylightOut(m2,nd,outMode scale01);%% SVM trainingPreOut scale01 multisvm 2(in',out',ActIn')';% accuracy: case 2: classificationt1 (PreOut scale01 - ActOut scale01 ) 0;mseClass01 sum( t1) / nd; %% calcualte the accuracymseClass02 sqrt(sum((PreOut scale01ActOut scale01). 2)/nd);%Models a given training set with a correspondinggroup vector and%classifies a given test setfunction[result] multisvm 2(TrainingSet,GroupTrain,TestSet)u unique(GroupTrain);numClasses length(u);result zeros(length(TestSet(:,1)),1);%build modelsfor k 1:numClasses%Vectorized statement that binarizes Group%where 1 is the current class and 0 is all other classesG1vAll (GroupTrain u(k));
American Journal of Civil Engineering and Architecturemodels(k) svmtrain(TrainingSet,G1vAll,'kernel function','rbf');end%classify test casesfor j 1:size(TestSet,1)for k )break;endendresult(j) k;endNneural networks with/without PCA%% important parameters:inIndex [1,2,13,14,17,18];outMode train 1;outMode scale01 2;isPCA 1 ; % using PCA 1; not use PCA 0;hiddenSizes 10;%% loadalldata importdata('alldata.dat');nd 3285;pt [1:nd];%% input for training and testing%%%%%%%%%%%%% method 1: without PCAif(isPCA 0)%%% training: inputin alldata(pt,inIndex)';%%% test::inputActIn alldata(nd 1:nd*2,inIndex)'; %% transposedend%%%%%%%%%%%%%% method 2: using PCAif(isPCA 1)%%% training: input[COEFF,SCORE in,latent in] princomp(zscore(alldata));in SCORE in(pt,:)';in in(1:10,:);%%% test::input[COEFF,SCORE test,latent test] princomp(zscore(alldata));ActIn SCORE test(nd 1:nd*2,:)';ActIn ActIn(1:10,:);end%% output for training and testingout zeros(1,nd);m alldata(pt,10)';out genDaylightOut(m,nd,outMode train);%%% testing: output:m2 alldata(nd 1:nd*2,10)';ActOut noscale m2;ActOut scale01 genDaylightOut(m2,nd,outMode scale01);%% trainaaa trainNeuralnetworkFcn(net,in,out);%% test::trainingPreOut noscale aaa(ActIn); % actual numberPreOut scale01 genDaylightOut(PreOut noscale,nd,outMode scale01); %scale the data7mseCon sqrt(sum((PreOut noscaleActOut noscale). 2)/nd);% accuracy: case 2: classificationt1 (PreOut scale01 - ActOut scale01 ) 0;mseClass01 sum( t1) / nd; %% calcualte the accuracymseClass02 sqrt(sum((PreOut scale01ActOut scale01). 2)/nd);%% neural network functionfunction aaa trainNeuralnetworkFcn(in, out)learnRate 0.05;epoch 100;error zeros(1,epoch);batchProcess false;hiddeNode ones(10,1);outputNode ones(1,1);deltaIW cell(100);for i 1:epochfor j 1:nSamplehiddenNode tansig(IW*input(:,j));% hiddenNode 11 X 1, IW,OW is row vectoroutputNode tansig(OW*hiddenNode);deltaOW(:,j) learnRate*(output(j)-outputNode)*(1outputNode)*(1 outputNode)/2*hiddenNode;deltaIW{j} ( learnRate*(output(j)-outputNode)*(1outputNode)*(1 (1:10) )* input(:,j)';if( batchProcess)OW deltaOW(:,j)' OW;IW IW deltaIW{j};endend%batch processingif(batchProcess)OW sum(deltaOW, 2)' OW;deltaIW2 zeros(10,2);for m 1:nSampledeltaIW2 deltaIW2 deltaIW{j};endIW IW acific Northwest National Laboratory. 2011 Buildings energydata book., Washington, DC: U.S. DOE Energy Efficiency andRenewable Energy; 2011.Tzempelikos A, Athienitis AK. "The impact of shading design andcontrol on building cooling and lighting demand," SOL ENERGY,81 (3), 369-82, 2007.Shen E, Hu J, Patel M. "Energy and visual comfort analysis oflighting and daylight control strategies," BUILD ENVIRON, 78,155-70, 2014.Shen E, Patel M, Hu J. "Comparison of Energy and VisualComfort Performance of Independent and Integrated Lighting andDaylight Controls Strategies," in ACEEE Summer Study onEnergy Efficiency in Industry, American Council for an EnergyEfficient Economy, New York, NY, USA.Hviid CA, Nielsen TR, Svendsen S. "Simple tool to evaluate theimpact of daylight on building energy consumption," SOLENERGY, 82 (9), 787-98, 2008.Heschong L. Daylighting in Schools: An Investigation into theRelationship between Daylighting and Human Performance.Detailed Report., Fair Oaks, CA: Heschong Mahone Group; 1999.Vine E, Lee E, Clear R, DiBartolomeo D, Selkowitz S. "Officeworker response to an automated Venetian blind and electric
8[8][9][10][11][12][13][14][15][16][17]American Journal of Civil Engineering and Arc
Andersen and Kleindienst developed a visualization [19] tool that not only could visualize the illuminance by using . the daylighting condition when three types of skylight [17,24]. The software DAYSIM developed by Reinhart and Walkenhorst is based on the standard lighting [25] simulation software Radiance. This software used the