Transcription
Rogers et al. Molecular Cancer 2010, RESEARCHOpen AccessExpression of the leukemic prognostic markerCD7 is linked to epigenetic modifications inchronic myeloid leukemiaSally L Rogers1, Yun Zhao1, Xiaoyan Jiang1,2, Connie J Eaves1,2, Dixie L Mager1,2, Arefeh Rouhi1,3*AbstractBackground: Expression levels of the cell surface glycoprotein, CD7, and the serine protease, elastase 2 (ELA2), inthe leukemic cells of patients with chronic myeloid leukemia (CML) have been associated with clinical outcome.However, little is known about the mechanisms that underlie the variable expression of these genes in theleukemic cells.Results: To address this question, we compared the level of their expression with the DNA methylation andhistone acetylation status of 5’ sequences of both genes in leukemic cell lines and primitive (lin-CD34 ) leukemiccells from chronic phase CML patients. DNA methylation of the ELA2 gene promoter did not correlate with itsexpression pattern in lin-CD34 cells from chronic phase CML patient samples even though there was cleardifferential DNA methylation of this locus in ELA2-expressing and non-expressing cell lines. In contrast, we found astrong relation between CD7 expression and transcription-permissive chromatin modifications, both at the level ofDNA methylation and histone acetylation with evidence of hypomethylation of the CD7 promoter region in the linCD34 cells from CML patients with high CD7 expression.Conclusion: These findings indicate a link between epigenetic modifications and CD7 expression in primitive CMLcells.BackgroundA feature of chronic myeloid leukaemia (CML) is thePhiladelphia chromosome (Ph). This abnormal chromosome results from a reciprocal translocation betweenchromosome 9 and 22 that gives rise to the BCR-ABLfusion gene that is now the accepted defining hallmarkof the disease [1-3]. CML is typically diagnosed in aninitial chronic phase (CP) which is characterized by theformation of a multi-lineage clone of Ph /BCR-ABL leukemic cells that typically dominates the entire hematopoietic system by the time of diagnosis. This cloneincludes a selectively enlarged compartment of myeloidprogenitors that produce an elevated number of normally differentiated granulocytes [4]. Targeted therapyof CML with imatinib mesylate (IM) or other inhibitorsof the BCR-ABL oncoprotein is the current therapy ofchoice for patients with CP disease, although IM does* Correspondence: arouhi@bccrc.ca1Terry Fox Laboratory, British Columbia Cancer Agency, 675 West 10thAvenue, Vancouver, British Columbia V5Z 1L3, Canadanot always produce durable remissions [5,6]. The mostcommon cause of a poor response outcome is theappearance of IM-resistant cells. This resistance mightbe BCR-ABL-dependent, such as mutations in the kinasedomain of BCR-ABLand genomic amplification of theBCR-ABL locus or BCR-ABL-independent mechanismssuch as constitutive activation of downstream pathways[7-9]. Other genetic causes of disease heterogeneity aswell as the inherent resistance of the leukemic progenitor/stem cells to IM may be additional contributingfactors [2,10,11]. Identification and characterizationof epigenetic changes that control the properties ofCML cells, especially those of CML stem/progenitor(lin-CD34 ) cells may be useful for the design of suitabletherapies for IM-refractory CML [12].As with other cancers, various markers divide CPCML into different subclasses that are associated withdifferent patient survival probabilities. CD7 and elastase2 (ELA2) are two such genes that show differentialexpression patterns in CML cells [13]. Various studies 2010 Rogers et al; licensee BioMed Central Ltd. This is an Open Access article distributed under the terms of the Creative CommonsAttribution License (http://creativecommons.org/licenses/by/2.0), which permits unrestricted use, distribution, and reproduction inany medium, provided the original work is properly cited.
Rogers et al. Molecular Cancer 2010, Page 2 of 14indicate expression of CD7 to be upregulated in CMLcells (and various other leukaemias and lymphomas)where it has been associated with poor survival [14,15].ELA2 is clustered with two other serine protease genefamily members, azurocidin 1 and proteinase 3 (PRTN3,also known as Myeloblastin) genes, at chromosome19pter [16]. These three genes are expressed co-ordinately and their products packaged together into azurophil granules during neutrophil differentiation. Highexpression of these three genes in CML is associatedwith a favourable prognosis [13].CD7 is located on chromosome 17 and encodes a cellsurface glycoprotein member of the immunoglobulinsuperfamily. The protein is found on thymocytes andmature NK and T-cells [17,18]. It plays an essential rolein T-cell interactions and also in T-cell/B-cell interactions during early lymphopoeisis. ELA2 is one of sixstructurally similar human elastase genes, ELA1, 2, 2A,2B, 3A and 3B. Elastases form a subfamily of serine proteases that hydrolyze many proteins in addition to elastin. ELA2 hydrolyzes proteins within specializedneutrophil lysosomes, called azurophil granules, as wellas proteins of the extracellular matrix following the protein’s release from activated neutrophils. In addition,ELA2 may play a role in degenerative and inflammatorydiseases by its proteolysis of collagen-IV and elastin ofthe extracellular matrix. This protease degrades theouter membrane protein A (OmpA) of E. coli as well asthe virulence factors of such bacteria as Shigella, Salmonella and Yersinia [19]. Mutations in the ELA2 gene areassociated with cyclic neutropenia and severe congenitalneutropenia (SCN) [20].The role of epigenetic mechanisms in the transcriptional control of CD7 and ELA2 is unknown. In thisstudy we have examined the transcription pattern ofthese two genes in normal adult human bone marrowand primary CML cells. We specifically compared thedegree of 5’ region DNA methylation with CD7 andELA2 transcript levels and assessed levels of histoneacetylation at the promoter regions of CD7 and ELA2 inexpressing and non-expressing cell lines.Materials and methodsCellsThe human cell line THP-1 (monocytic leukemia) wascultured in RPMI plus 10% fetal calf serum (FCS), 10mM Hepes, 2 mM glutamine and penicillin/streptomycin (pen/strep). The human cell lines ALL-SIL (T-cellleukemia) and RPM1 (T-ALL) were cultured in RPMIplus 10% FCS, 1% sodium pyruvate, 1% glutamine andpen/strep. Normal adult human bone marrow cells andCP CML patient samples were obtained with informedconsent according to protocols approved by theResearch Ethics Board of the University of BritishColumbia. Heparin-treated blood and leukapheresis cellswere obtained from 12 chronic phase CML patientswith elevated white blood cell counts (Table 1) at thetime of their initial diagnosis. None of the 12 patientshad been treated with imatinib, and all lacked any clinical evidence of accelerated disease when the sampleswere taken.Light density cells were first isolated by centrifugationon ficoll-hypaque and then cells expressing the followinglineage (lin) markers: CD2, CD3, CD14, CD16, CD19,CD24, CD56, CD66b and glycophorin A were removedimmunomagnetically using a column (StemSep, StemCell Technologies, Vancouver, BC) as recommended bythe manufacturer. Cells were then cryopreserved inDMSO plus FCS until required. After thawing, thelin - cells were stained with allophycoerythrin (APC)conjugated anti-human CD34 antibody (8G12, BectonDickinson, San Jose, CA,) and propidium iodide (PI,Table 1 Clinical data from 12 CML patients studiedPatient no.aDisease status at diagnosisDisease progressionaAge at diagnosisSexWBC at diagnosis( PAP10115460MM16615CPCPBCCP1246F161CPCPCP chronic phase, AP accelerated phase and BC blast crisis
Rogers et al. Molecular Cancer 2010, Page 3 of 14Sigma Chemicals, St. Louis, MO). Viable (PI-) lin-CD34 cells (enriched in stem/progenitor cells) were then isolated using a FACSVantage flowcytometer (BD). Cellswere further sorted, where indicated in the results, usingfluorescein isothiocyanate (FITC)-conjugated antihuman CD7 antibody (M-T701, BD).The McGill University and Genome Québec InnovationCentre Sequencing Platform. Only unique sequences (asdetermined by either unique CpG methylation patternor unique non-conversion of non-CpG cytosines) areshown, and all sequences had a conversion rate ofhigher than 95%.DNA and cDNA preparationCombined bisulfite and restriction analysis (CoBRA)DNA was prepared in the following manner. Cell lineswere washed twice in PBS, then boiled in sterile waterfor 10 mins. Samples were incubated with proteinase Kfor two hours, followed by denaturation for 10 mins.DNA was isolated from CML and normal tissue samplesusing the Qiagen (Germantown, MD) DNA/RNA isolation kit, according to the manufacturer’s recommendation. The PicoPure RNA extraction kit (Arturus,Mountainview, CA) was use to extract RNA, accordingto the manufacturer’s protocol using DNaseI (Invitrogen, Carlsbad, CA) treatment during the procedure tominimize contamination with genomic DNA. RNA wasreverse transcribed with SuperScriptIII (Invitrogen) togenerate first strand cDNA,In addition to cloning and sequencing, PCR productswere digested individually with the restriction enzymesHinfI, MboI, TaqI, or RsaI, which contain CpG dinucleotides in their recognition sites. If the CpG is methylated in the original sample, then the restriction enzymesite will be conserved during bisulfite treatment and thePCR product will be digested. All enzymes were purchased from New England Biolabs (Ipswich, MA), anddigests were performed overnight following manufacturer’s instructions. Control reactions were performedeach time to ensure complete digestion, and uncut reactions were run on agarose gels with digests forcomparison.Chromatin immunoprecipitation and quantitative PCRBisulfite conversion and PCR amplificationBisulfite conversion of DNA was performed using the EZDNA methylation kit (Zymo Research, Orange, CA),according to the manufacturer’s protocol, with minormodifications [21]. Treated DNA was cleaned and elutedto 15 μl following the manufacturer’s instructions. PCRamplifications of two regions spanning the start of theELA2 gene were performed on converted DNA using thefollowing primers: ELA2BS1 for 5’-TGGGTTTTATTTGGAAGAGATTTAG-3’ with ELA2BS1rev 5’-CCTCCAAACAAAATTCAAAATACAC-3’, and ELA2BS2for5’-GTGTATTTTGAATTTTGTTTGGAGG-3’ withELA2BS2rev 5’-CCTCAATCTCTTCTAATCTCC-3’ withPlatinum Taq (Invitrogen Life Technologies) under thefollowing conditions: 94 C for 8 minutes, followed by 4045 cycles of 94 C for 90 seconds, 55 C for 90 seconds, and72 C for 45 seconds.PCR amplification of the region spanning the start ofthe CD7 gene was performed on converted DNA usingthe following primers: CD7BS for 5’-TAGAGGATTAGGTAGGTTG-3’ with CD7BSrev 5’-AACTCTTACCTTAAACAACC-3’, with the same conditions asabove apart from a 50 C annealing step. A final elongation step of 10 minutes was included in all reactions.PCR products were analyzed by gel electrophoresis andproducts purified with MiniElute (Qiagen).SequencingPCR products were cloned using the pGEM-T Easy kit(Promega, Madison, WI). Sequencing was performed byChromatin immunoprecipitation (ChIP) assays were performed using a ChIP assay kit (Upstate Biotechnology,Billerica, MA) according to the manufacturer’s instructions. The following antibodies were used to performimmunoprecipitations, polyclonal anti-acetyl-Histone H3(Lysine-9) and polyclonal anti-acetyl-Histone H4 (multiple residues) (both Upstate Biotechnology). The DNAwas purified via QIAquick PCR purification (Qiagen)and resuspended in 30 μl of de-ionized water. Quantitative PCR amplification of human CD7 and ELA2sequences was performed on these samples using thefollowing primers (location shown in figure 1): CD7forward 5’-ACCTCCTCCCTGTGGAGATG-3’, CD7reverse 5’-AGAGCTCAGAGAGGGCTTCCT-3’; ELA2forward, 5’-CAGCACAGGGCTATAAGAGG-3’, ELA2reverse 5’-GAGCAGCGGAGGTTGGAC-3’. The housekeeping gene HPRT was amplified as a positive controlusing forward primer 5’-CCCTCAGGCGAACCTCTCG-3’and reverse primer 5’-GGCTGCGGGTCGCCATAACG-3’.The neural filament gene NFM was amplified as a negativecontrol using forward primer 5’-CATCTCGACGGCGCTGAAGG-3’ and reverse primer 5’-GGTACTCGGCGATCTCTTCC-3’. 45 rounds of amplification with SYBR Green PCR Master Mix (Applied Biosystems, Foster City,CA) were performed. The default 7500 System SDS software version 1.2.10 (7500 RealTime PCR System, AppliedBiosystems) cycle was used with the amplificationperformed at 60 C in a total volume of 25 μl. Dissociationcurve analysis was performed at the end of each PCRto confirm the presence of a single and specific product.
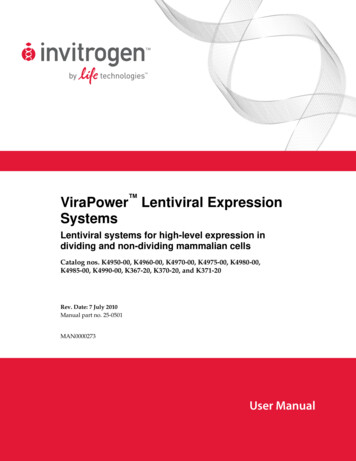
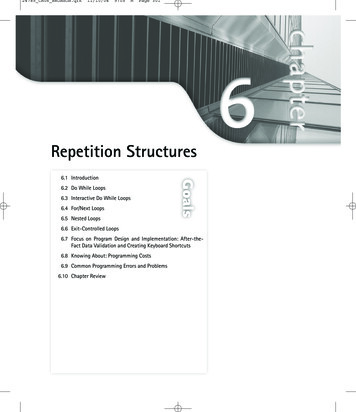
Rogers et al. Molecular Cancer 2010, Page 4 of 14Figure 1 Expression of CD7 and ELA2 is associated with DNA hypomethylation in leukemic cell lines. Bisulfite sequencing and CoBRA forA) ELA2, on THP-1 (positive) and RPM1 (negative); and B) CD7 on THP-1 (negative) and ALL-SIL (positive). Cartoons show gene organization, withtranscriptional start sites as bent arrow, UTR as narrow bars and translated regions as wide bars. Down arrows show location of enzyme sitesused for CoBRA. Vertical bars show location of CpG dinucleotides. Dotted lines show location of region amplified after ChIP. Open and filledcircles indicate unmethylated and methylated CpGs respectively. Bottom panels show CoBRA for each gene. Enzymes used are indicated asfollows; U uncut, H HinfI, R Rsa, T TaqIa and M MboI. Position of the uncut band is indicated by an arrow.
Rogers et al. Molecular Cancer 2010, Absolute expression analysis using quantitative realtimePCRAbsolute quantification of CD7, ELA2 and PRTN3cDNAs was performed according to Jiang et al. (2004)[22]. The following primers: ELA2 forward primer 5’ACGACATCGTGATTCTCCAGCTCA-3’, ELA2 reverseprimer 5’-CGTTGAGCTCCTGCAGGAC-3’, CD7 forward primer 5’-TAGACCCAGAGAGGCTCAG-3’, CD7reverse primer 5’-GGAGACTGCTGCACCTCTTGG-3’.The housekeeping gene GAPDH was amplified as aninternal control using forward primer 5’-CCCATCACCATCTTCCAGGAG-3’ and reverse primer 5’CTTCTCCATGGTGGTGAAGACG-3’. 40 rounds ofamplification with SYBR Green PCR Master Mix(Applied Biosystems) were performed. The default 7500System SDS software version 1.2.10 (7500 RealTimePCR System, Applied Biosystems) cycle was used withamplification performed at 62 C in a total volume of 25μl. Dissociation curve analysis was performed after theend of each PCR to confirm the presence of a singleand specific product.Statistical analysisP-values for the DNA methylation analysis were calculated using Fisher’s exact test. The statistical significanceof absolute quantities of ELA2 and CD7 cDNAs in normal and CML samples was calculated using the MannWhitney U-test.ResultsTranscription of CD7 and ELA2 is associated with DNAhypomethylation in leukemic cell linesWe first screened a panel of human leukemic cell linesfor transcription of CD7 and ELA2 with RT-PCR (Additional File 1). THP-1 transcribes ELA2 but not CD7,ALL-SIL transcribes CD7 and RPM1 is negative forELA2. We then assessed whether methylation patternsof the 5’ CpG-rich regions of the CD7 and ELA2 genesare linked with their transcriptional activity. We identified a CpG rich region in the human ELA2 gene, from606 nt upstream of the transcriptional start site to 247nt downstream, including all of exon 1. This regiondoes not contain any CpG islands according to the standard definition ( 50% G C content, and observed/expected CpG ratio of 0.6). However, it is CpG rich,with an observed to expected ratio of 0.5, compared to0.1 across the human genome. It is also GC rich (58%),not only compared to the genome average of 41% GC,but also compared to the 48% GC average across chromosome 19 [23].DNA was isolated from all three of these cell lines andtreated with sodium bisulfite. Sodium bisulfite convertscytosine to uracil, but does not convert 5-methylcytosine, allowing the bases to be distinguished by PCRPage 5 of 14amplification. The 853-bp CpG-rich region of the ELA2gene was PCR amplified from the treated DNA, clonedand sequenced (Figure 1A). CoBRA analysis was alsoperformed on the PCR products, using two enzymes, asshown in Figure 1A, allowing analysis of three of theCpG dinucleotides. If the CpG was originally methylated, the restriction enzyme site will be retained in thetreated DNA and the PCR product will be digested. Theresults of both the sequencing and the CoBRA showthat the CpG rich region is significantly less methylatedin the ELA2 THP-1 cell line than in the ELA2 RPM1cell line, in which the majority of the CpGs aremethylated. We also analyzed the DNA methylation status of ELA2 in the non-expressing (Additional File 1A)CML cell line, K562 (Additional File 2A), showing moderate to high methylation.We also identified a CpG-rich region in the humanCD7 gene, from 277 nt upstream of the transcriptionalstart site to 200 nt downstream of the transcriptionalstart site, and performed a similar analysis on thisregion (Figure 1B). This region also does not containany CpG islands, but it is enriched for CpGs, with anobserved to expected ratio of 0.3. It is also GC rich(69%) compared to the 45.5% GC average across chromosome 17 [24]. Bisulfite sequencing and CoBRArevealed that this region is significantly less methylatedin the CD7 ALL-SIL cell line than in the CD7- THP-1cell line, in which the majority of CpGs are methylated.We also analyzed the DNA methylation status of CD7in the low-expressing (Additional File 1B) CML cell line,K562 (Additional File 2B), which showed partialmethylation.Expression of CD7 and ELA2 is associated withhistone acetylation in leukemic cell linesStudies suggest that CpG methylation is linked to histonedeacetylation resulting in the formation of condensed,transcriptionally inactive chromatin. Acetylation of histones H3 and H4 is an epigenetic modification associatedwith an open chromatin structure and transcriptionallyactive genes [25]. The binding of acetylated histones tothe CD7 and ELA2 CpG-rich regions in THP-1 (CD7-,ELA2 ) and ALL-SIL (CD7 , ELA2-) cells was analyzedusing ChIP. In these analyses, cross-linked chromatin wasimmunoprecipitated using anti-acetyl H3 Lys 9 or antiacetyl H4 antibodies. As a negative control, we includeda precipitation reaction containing no antibody, and theinput fractions prior to immunoprecipitation were usedas positive controls. After immunoprecipitation andreversal of the cross-links, enrichment of the CD7 andELA2 CpG-rich fragments in each sample was measuredby quantitative real-time PCR. The results are shown asthe relative association of the tested gene regions withacetylated histones normalized to a positive control gene
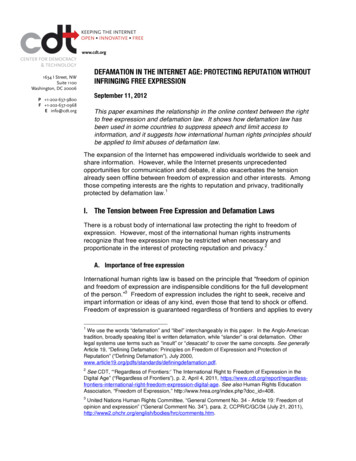
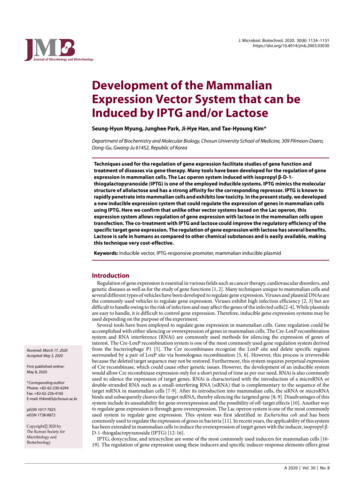
Rogers et al. Molecular Cancer 2010, Page 6 of 14Figure 2 Expression of CD7 and ELA2 is associated with histone acetylation in leukemic cell lines. ChIP was performed on THP-1 (CD7ELA2 ) and ALL-SIL (CD7 ELA2-) cell lines with anti-acetyl-H3K9 and anti-pan-acetyl-H4 antibodies. Black bars indicate NFM (negative control); greybars, CD7; white bars, ELA2 and striped bars, HPRT (positive control).(HPRT), which is expressed in all the cell lines and set ata reference value of one (Figure 2). As an additional control, the same immunoprecipitate was also used toamplify a negative control DNA genomic region from theNFM gene, which is expressed exclusively in neurons(and therefore not in any of the cell lines tested). Theresults show that both CD7 and ELA2 CpG-rich regionsare significantly associated with acetylated histones in thepositive cell lines (ALL-SIL and THP-1, respectively) atlevels as high as, or higher than, the positive controlregion of HPRT. In contrast, there is relatively little association of acetylated histones with the CpG-rich region ofCD7 and ELA2 in the negative cell lines (THP-1 andALL-SIL, respectively). These results indicate thatacetylated histones H3 and H4 specifically bind to theCpG rich regions of CD7 and ELA2 in leukemic cell linesin situ.Range of ELA2 and CD7 transcript levels in CD34 cellsfrom CML patients and normal controlsIt has previously been reported that high CD7 and lowELA2 expression in CML cells is associated with a poorprognosis. In order to determine the range of expressionin the samples of normal and CML lin-CD34 cells usedin the present study (Table 1), we performed absolutequantification of transcript levels for both genes usingreal-time RT-PCR (Figure 3A and 3B). The amount ofCD7 transcripts is relatively constant in the lin-CD34
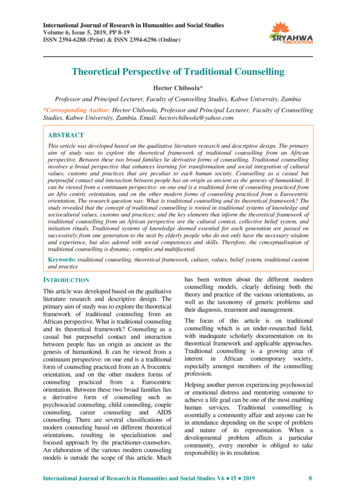
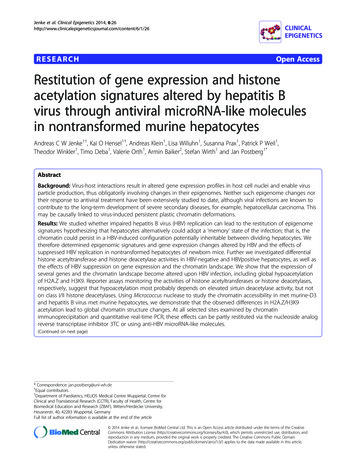
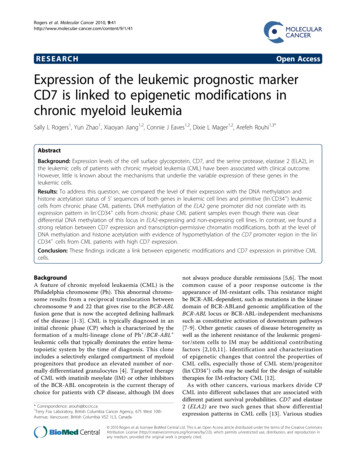
Rogers et al. Molecular Cancer 2010, Page 7 of 14Figure 3 Absolute quantification of transcripts of A) CD7, B) ELA2 and C) PRTN3 in normal and CML human samples. Normal samplesare all from bone marrow, CML 1-10 are from peripheral blood except for CML11 and 12 which are from bone marrow. Cells and cDNA wereprepared as described in materials and methods. Median of transcript levels is indicated.
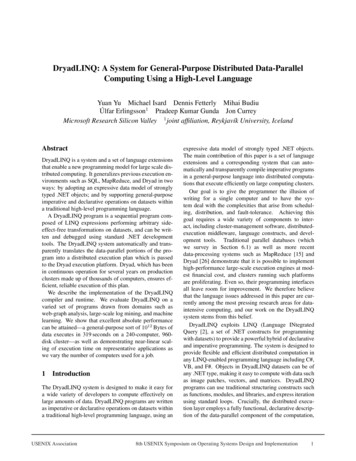
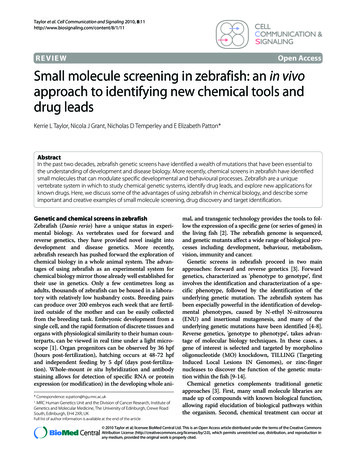
Rogers et al. Molecular Cancer 2010, cells from all four normal bone marrow samples,whereas the CD7 transcript levels in the correspondingsubset of CML cells show marked variation among samples. Nevertheless, on average, the level of CD7 expression was significantly higher in the CML samples (P 0.0001). ELA2 transcript levels were more variablewithin both the normal and CML groups although, onaverage, the levels in the CML samples were significantly lower (P 0.0005). However, transcript levels ofthe co-regulated PRTN3 gene did not show a statisticallysignificant difference between CML and normal groups(Figure 3C), due primarily to one CML sample (CML11)with very high levels of PRTN3 transcript.DNA hypomethylation correlates with increased CD7expression on individual cells in CMLTo determine if the increased expression of CD7 in linCD34 CML cells is associated with hypomethylation ofthe CD7 promoter region, we isolated DNA from linCD34 cells from one normal (N1) and three CML(CML1, 4, 6 and 10) samples. These samples were chosen as the CML1, 10, 6 and 4 cells showed high, intermediate and low levels of CD7 expression, respectively(refer to Figure 3). Only one normal sample was chosenfor sequencing as the expression level of CD7 is relatively constant in this group. Sequencing of bisulfitetreated DNA from these samples shows that the CD7promoter region is significantly less methylated in theCML1 cells than in the normal sample (P 0.0003,Figure 4). In contrast, the CD7 promoter regions inCML4 and CML6 have approximately the same percentage methylation as the normal sample. Interestingly, inCML10 (which has moderate expression of CD7), thereis lower percentage methylation than in the normalsample approaching statistical significance. This is consistent with the results from Figure 1B suggesting thatCD7 transcript levels are proportional to the extent ofmethylation of the CD7 promoter region. We also performed DNA methylation analysis of CD7 in bulk CD34 cells (containing both lin- and lin cells) from CML1and CML3 and found similar results as for lin-CD34 CML cells (Additional File 3).Detailed analysis of the methylation pattern of thesequences shown for CML1 in Figure 4 reveals thatindividual clones appear to be either unmethylated ormethylated, as opposed to patchy methylation across allthe CpG sites. One hypothesis for this pattern is thatexpression of CD7 on individual cells in the lin-CD34 population varies, and that those cells which are positiveare demethylated at the CD7 promoter. To test thishypothesis, CD7 and CD7 - cells were isolated afterstaining CML1 and CML10 lin-CD34 cells with antiCD7 and the methylation pattern of CD7 determined asbefore (Figure 5). Only 47% and 66% of the CD7 CpGPage 8 of 14sites tested are methylated in the CD7 cells of CML1and CML10 respectively, compared to 90% (CML1) and83% (CML10) in the CD7- cells (P 0.0001) suggestingthat hypomethylation of the CD7 promoter is associatedwith higher expression of CD7 on individual cells inCML patients. Moreover, in both the cell lines andpatient samples, it appears to be the region downstreamfrom the fourth CpG site analysed into the transcribedportion of the gene that is demethylated. Interestingly,not all clones in the CD7 fraction show hypomethylation of the CD7 5’-region. This result cannot be due tocontamination by CD7- cells, because of the high purityof the sort. Rather, it is possible that in some of theseCD7 cells expression is only promoted from one allele.We also performed DNA methylation analysis of CD7 inbulk CD34 cells (containing both lin - and lin cells)sorted for CD7 expression from CML3 and found similar results as for lin - CD34 CML cells (AdditionalFile 4).DNA methylation and transcript levels of ELA2 in CML arenot correlatedIn order to determine if the decreased expression ofELA2 in lin - CD34 cells from CML patients is associated with methylation of the promoter region, we isolated DNA from normal and CML patient samples. Thenormal samples chosen were those with the highest andlowest expression of ELA2, and CML1 was selectedbecause ELA2 transcript levels is significantly lower thanin the normal samples. Sequencing of bisulfite-treatedDNA from these samples shows that there is no significant difference in methylation of the ELA2 promoterregion between normal and CML lin - CD34 cells(Figure 6). Comparison of CoBRA results from CML1(low ELA2 mRNA), CML4 (intermediate ELA2 mRNA)and CML10 (very low ELA2 mRNA) also did not reveala significant difference in DNA methylation levels (datanot shown). These results contrast with our initialexpectation, as we had found the extent of both DNAhypomethylation and histone acetylation to be associated with ELA2 expression in the tested leukemic celllines (Figures 1 and 2). However, absolute quantificationof the differences in ELA2 transcript levels betweenTHP-1 (ELA2 ) and RPM1 (ELA2 - ) cell lines showedthat these differed by a factor of 20,000-fold (data notshown), whereas the magnitude of average differencesbetween the normal and CML cells was only 50-fold. Itis therefore possible that the variation in expressioncaused by CML is too subtle to allow the role of epigenetic mechanisms to be detected.DiscussionIn most cancers, epigenetic changes, as well as geneticaberrations, contribute to an altered program of gene
Rogers et al. Molecular Cancer 2010, Page 9 of 14Figure 4 DNA methylation analysis of CD7 in normal and CML samples. CD7 is expressed highly in CML1 and intermediately in CML10 butCML4 and CML6 have close to normal levels of CD7 expression. Open and black fill circles indicate unmethylated and methylated CpGrespectively.
Rogers et al. Molecular Cancer 2010, Page 10 of 14Figure 5 Significantly less CD7 promoter methylation in CD7 expressing cells from CML1 and CML10. CD34 cells of patient sampleCML1 and CML10 were sorted into CD7 and CD7- fractions and DNA methylation analysis was performed by sodium bisulfite sequencing.Open and black fill circles indicate unmethylated and methylated CpG respectively.
Rogers et al. Molecular Cancer 2010, Page 11 of 14Figure 6 DNA methylation analysis of ELA2 in normal and CML samples. Open and black fill circles indicate unmethylated and methylatedCpG respectively. Grey fill circles indicated CpG dinucleotides whose DNA methylation could not be determined. Two fragments of 300 bp and 400 bp were amplified and sequenced. The percentage of methylated CpGs is calculated independently for each fragment.expression, disease progression and increased tumorheterogeneity [26-28]. Genome-wide DNA hypomethylation leads to ectopic expression of oncogenes [29,30]and a marked increase in genomic instability [31]. Specific hypermethylation of tumor suppressor genes can actas the second hit or as the primary mechanism of transcriptional shutdown [32,33]. Furthermore, transcriptionpromoting and inhibiting modifications to histones alsooccur in many cancers. These widespread epigeneticchanges justify the use of chromatin remodelling drugssuch as DNA methyltransferase (DNMT) and histonedeacetylase (HDAC) inhibitors for the reactivation ofepigenetically-silenced tumor suppressor genes. As aspecific example, in CML and some Ph acute lymphoblastic leukemias, microRNA-203 (miR-203) is silencedby DNA hypermethylation [34]. This miRNA acts as atumor suppressor by down-regulating ABL throughbinding the 3’ untranslated region (3’UTR) of ABLmRNA thereby preventing its translation [34].In this study we assessed the epigenetic state of twogenes, CD7 and ELA2 in primitive leukemic cells isolated from CP CML patients. Both of these genes wereknown to show altered expression in CML cells, and weconfirmed this finding for primitive lin - CD34 CMLcells. The extent of altered expression of both genes hasalso been implicated as having prognostic significance.In three human leukemic cell lines, the extent of DNAmethylation and histone acetylation of the CD7 andELA2 promoters correlated with expression. However,we found a similar correlation to be limited to the CD7
Rogers et al. Molecular Cancer 2010, gene in primitive CML cells. It is possible that thehigher level of ELA2 transcript detected in some of theCML samples is contributed by a small subset of theCD34 cells in which case an associated hypomethylation of the ELA2
DNA was isolated from CML and normal tissue samples using the Qiagen (Germantown, MD) DNA/RNA isola-tion kit, according to the manufacturer's recommenda-tion. The PicoPure RNA extraction kit (Arturus, Mountainview, CA) was use to extract RNA, according to the manufacturer's protocol using DNaseI (Invitro-