Transcription
2019 Annual Review Meeting for Crosscutting ResearchA Guideline for the Assessment of Uniaxial Creep andCreep-Fatigue Data and ModelsStudent Researcher : Md Abir HossainPI : Dr. Calvin M StewartCo-PI : Dr. Jack Chessa
Outline Project Objective Motivation The Team Systematic Approach to Assessment Project Task Project Milestone List of Publications Ongoing Works Modified Wilshire Model Modified Theta Projection Model Metamodeling Probabilistic Creep Modeling Result and Accomplishment Future Work Market benefits/Assessment Conclusion2
Project Objective Of primary concern to FE practitioners is a determination of which constitutivemodels are the “best”, capable of reproducing the mechanisms expected in anintended design accurately; as well as what experimental datasets are properor “best” to use for fitting the constitutive parameters needed for the model(s)of interest.RO1RO2Development ofAggregated ExperimentalDatabases of Creep andCreep-Fatigue DataComputational Validationand Assessment of Creepand Creep-FatigueConstitutive Models forStandard and Non-StandardLoading Conditions3
Strategic Alignment and 2018 GoalsPower Plant Efficiency ImprovementRecent drives to increase the efficiency of existing fossil energy (FE) power plants and the development of AdvancedUltrasupercritical (A-USC) power plants, have led to designs with steam pressures above 4000 psi and temperaturesexceeding 1400 F.Indirect-Fire Supercritical CO2 Recompression Brayton CycleOxy-Fueled Directly-Fired Supercritical CO2 Cycle 4
Technology Benchmarking The existing FE fleet has an average age of 40 years. The Department of Energy has outlined a strategy of life extension for US coalfired power plants where many plants will operate for up to 30 additionalyears of service.In Service Hours .30 Years 262,974 hoursUncertainty Temperature Stress 40 Years 350,634 hours70 Years 613,607 hoursThere is a Need forImproved CreepPrediction TechnologyCreep-Rupture of 9Cr-1Mo Tube300,000 hours5
Motivation Significant amount of research has beendone on the creep-rupture model. Larson-Miller (1952); Manson-Haferd (1953); Sherby-Dorn (1954); Monkman-Grant(1956); Omega (1995); Theta (1992); Kachanov-Rabotnov (1967-69); Wilshire (2006); Sinh(2013); etc.Fatigue Rupture Palmgren-Miner (1924,1945); Robinson (1938); Lieberman (1962); Coffin-Manson (195354); Morrow-Halford (1965-66); Chaboche (1988); Scott-Emuakpor (2011); etc.Creep-Fatigue Rupture Manson (1971), British R5; Chaboche (1980), ASME B&PV III, French RCC; etc.Creep Viscoplasticity (Zero Yield Surface) Primary: Andrade (1910); Bailey (1935); McVetty (1943); Garofalo (1965); etc. Secondary: Norton (1929); Soderberg (1936); McVetty (1943); Dorn (1955); JohnsonHenderson-Kahn (1963); Garofalo (1965); etc. Mixed: McVetty (1943); Graham and Walles (1955); Garofalo (1965); Kachanov-Rabotnov(1967-69); Theta (1984); RCC-MR (1985); Omega (1995); Liu-Murakami (1998); DysonMcClean (1998); Sinh (2013); etc.Cyclic Viscoplasticity (Yield Surface)Constitutive Laws Current research is directed towardsCreep viscoplasticity and meta modeling.Creep-RuptureLife Prediction An immense number of models havebeen developed to predict thedeformation, damage evolution, andrupture of structural alloys subjected toCreep and Creep-Fatigue. Bodner (1975); Hart (1976); Chaboche (1977); Robinson (1978); Krempl (1980);etc. Project focus has shifted from the “Creepand Creep-Fatigue” to just “Creep”Creep-Fatigue Viscoplasticity (Equilibrium Surface) Miller (1976); Walker (1981); Sinh (2013); etc.There are Many More! 6
The TeamDr. Calvin M Stewart, Project PIAlumniAlumniMohammadShafinul HaqueTenure TrackAsst. Professorat Angelo StateUniversityChristopherRamirezMetallurgy TestTechnician atElementDr. Jack F Chessa, Project Co-PICurrent MembersMd Abir HossainPh.D.Jaime CanoMSJimmy J PerezMSSigned OfferwithLockheedMartinRicardo VegaMS7
Systematic Approach to AssessmentExample for Creep DeformationReseacher ACreep StrainResearcher BAnalytical Fit95% Confid BandsInterpolation &ExtrapolationAverage-LineGlobal OptimizationBox & Whisker Plots104Rupture Life102103101500T X CPost-Audit ValidationEXP SIM0.4Tm600Stress, (MPa)ε cr400300102103Plastic Creep106102103101102103104105106σ ys105ElasticCreep104106103105104106Note: line-line scale500550600650105106700750Temperature, T ( C)Model Fit to DatasetsPerformanceA104104100tTimeAggregate Datasets with UncertaintyPlastic105200R2 X105BCDFStandard PerformanceNonstandard PerformanceModel UncertaintyNMSE , Z CRMS8
Project TasksTask 1: Project Management, Planning, and ReportingTask 2 : Locate, Digitize, Sort, and Store Creep-Rupture DataTask 3: Uncertainty of Creep and Creep-Fatigue DataTask 4: Mathematical Analysis and FEA of ModelsTask 5: Calibration & Validation – Fit, Interpolation, and Extrapolation of ModelsTask 6: Post-Audit Validation of the ModelsTask 7: Uncertainty Analysis of ModelsTask 8: Final Assessment9
Creep Data Thus Far Alloys:P91316SS/NPlanned:304SSIN617IN625IN718 SourceARL-79-33ASM Atlas of Creep & StressRuptureASM Atlas of FatigueASM Atlas off StressCorrosion FatigueASM Atlas of Stress-StrainASTM DS-60ASTM DS5-S1ASTM STP 124ASTM STP 522Booker and Sikka, 1976Choudary, 2009Fournier (1), 2008Fournier (2), 2008Fournier (3), 2008Nagesha, 2002NIMS DatabaseORNL TM-10504ORNL-101053ORNL/TM-6608ORNL-5237Rau, 2002Rowe, 1963Shankar, 2006Takahasi, 2008Yan, 2015Kimura, 2009CreepDeformationStressRelaxation9Min. StrainRateTime to 1184125578964291219131816120730185165139910
Creep Data Work Thus Far 30030050% data cull between tr,max/10 andthe longest experimental timeP911008060504030P91100806050403020201010% data cull from the lowest stress data200Stress, (MPa)Stress, (MPa)200(a)01010110210310410510Rupture life, t r (hr)610710810(b)100101102103104105Rupture life, t r (hr)106107108550 C600 C650 C700 CCull dataLMMSCD
List of Publication Journal Articles Hossain, M.A., and Stewart, C.M., 2019, “Reliability Prediction of Sine-Hyperbolic Creep-Damage Model using MonteCarlo Simulation Method,” Journal TBD, (in preparation). Cano, J., and Stewart, C.M., 2019, “Application of the Wilshire Stress-Rupture and Minimum-Creep-Strain-RatePrediction Models for Alloy P91 in Tube, Plate And Pipe Form,” Journal TBD, (in preparation). Vega, R., and Stewart, C.M., 2019, “Development and Application Of Minimum Creep Strain Rate Metamodeling,”Journal TBD, (in preparation). Haque, M.S., and Stewart C.M., 2019, “Metamodeling Time-Temperature Parameters for Creep,” Materials at HighTemperatures (under review). MHT-S-18-00109 Haque, M.S, and Stewart, C. M., 2019, “Comparative Analysis of the Sin-Hyperbolic and Kachanov–Rabotnov CreepDamage Models,” International Journal of Pressure Vessels and Piping, .001 [PDF] Haque, M.S, and Stewart, C. M., 2019, “The Disparate Data Problem: The Calibration of Creep Laws Across Test Typeand Stress, Temperature, and Time Scales,” Theoretical and Applied Fracture Mechanics, 100,https://doi.org/10.1016/j.tafmec.2019.01.018 [PDF] Haque, M. S., and Stewart, C. M., 2017, “The Stress-Sensitivity, Mesh-Dependence, and Convergence of ContinuumDamage Mechanics Models for Creep,” ASME Journal of Pressure Vessel Technology, 139(4). doi:10.1115/1.403614212
List of Publication(cont ) Conference Papers Hossain, M.A., and Stewart, C.M., 2019, “Reliability Prediction of Sine-Hyperbolic Creep-Damage Model using MonteCarlo Simulation Method,” ASME PVP 2019, San Antonio, Texas, July 14 – 19, 2019.(accepted). Cano, J., and Stewart, C.M., 2019, “Application of the Wilshire Stress-Rupture and Minimum-Creep-Strain-RatePrediction Models for Alloy P91 in Tube, Plate And Pipe Form,” ASME TurboExpo 2019, Phoenix, Arizona, June 17-21,2019. Perez, J., and Stewart, C.M., 2019, “Asssessment of the Theta Projection Model for Interpolating Creep Deformation,”ASME TurboExpo 2019, Phoenix, Arizona, June 17-21, 2019. Vega, R., and Stewart, C.M., 2019, “Development and Application Of Minimum Creep Strain Rate Metamodeling,”ASME TurboExpo 2019, Phoenix, Arizona, June 17-21, 2019. Haque, M. S., and Stewart, C. M., 2017, “Selection of Representative Stress Function under Multiaxial Stress StateCondition for Creep,” ASME PVP 2017, PVP2017-65296, Waikoloa, HI, July 16-20, 2017. Haque, M. S., Ramirez, C., and Stewart, C. M., 2017, “A Novel Metamodeling Approach for Time-TemperatureParameter Models,” ASME PVP 2017, PVP2017-65297, Waikoloa, HI, July 16-20, 2017. Ramirez, C., Haque, M. S., and C. M. Stewart, 2017, “Guidelines to the Assessment of Creep Rupture Reliability for316SS using the Larson-Miller Time-Temperature Parameter Model,” ASME PVP 2017, PVP2017-65816, Waikoloa, HI,July 16-20, 2017. https://doi.org/10.1115/PVP2017-6581613
List of Publication(cont ) Short Papers Vega, R., and Stewart, C.M., 2019, “Metamodeling of Minimum Creep Strain Rate Models with TemperatureDependence,” SETS 2019, EL Paso, TX, March 26-27, 2019. Perez, J., and Stewart, C.M., 2019, “An Alternative Method for Interpolating and Extrapolating Strain Predictions Usingthe Theta Projection Model,” SETS 2019, EL Paso, TX, March 26-27, 2019. Hossain, M. A., and Stewart C.M., 2019, “Probabilistic Evaluation of 304 Stainless Steel using Sine Hyperbolic CreepDamage Model,” SETS 2019, EL Paso, TX, March 26-27, 2019. Cano, J., and Stewart, C.M., 2019, “Modified Wilshire Model for Long-Term Creep Deformation” SETS 2019, El Paso,TX, March 26-27, 2019. Vega, R., and Perez, J., and Stewart, C. M., 2018, “Identification of Creep Strain Constants and Accurate Model Fitsusing Numerical Optimization ,” SETS 2018, El Paso, TX, April 14th, 2018. Haynes, A., Stewart, C. M., 2017, “The Numerical Analysis of Equivalent Stress Functions for Multiaxial CreepDeformation, Damage, and Rupture,” SETS 2017, El Paso, TX, April 1st, 2017. Ramirez, C., Haque, M. S., and Stewart, C. M., 2017, “Guidelines to the Assessment of Creep Rupture Uncertainty for316SS using the Larson-Miller Time-Temperature Parameter Model,” SETS 2017, El Paso, TX, April 1st, 2017.14
Previous Works102Temperature-range T Tmax Tmin T Tmin , σ σ min , t 0tTMinimum Creep Strain Rate, m in (%/hr)Ts , σ s , tsT ,σ , t ε min f (T , σ )σ max σε f (T )ω,ωcrX ,Y ε min and tr at (T , σ ). T , σ , ε min , tr , ε , ωd arrayT T σ minmin , σd array trT T Tsε and ωε min , tr , ε , ω0.80.60.50.40.3(a)160 MPa, SA160 MPa, DA180 MPa, SA180 MPa, DA160 MPa180 MPa0.61601801601800.80.40.250750.60.70.80.9300 5100100250103102101100105102103150103105 610(a)0600650700750Temperature, T ( C)8008509000.2 010001200140001002007007508001600 F9005000.2600100200300400Time, t (hr)500600 0, 10.0 0, 0-0.5 0.1, 0.10.1-1.5 0.5, 0.5(c)(d)-2.00.00 1, 00.5-1.01800 F(c)0.08504002.1 ksi7.5 ksiThetaOmegaSinh0.3102103104105106Temperature, T ( C)6.3 ksi7.3 ksiThetaOmegaSinh0.2300Time, t (hr)0.1103strength1065106501011021040.2% Yield1400 F0.3Time, t (hr)105σ rep ασ 1 3βσ m (1 α β )σ vm ; 0 α β 11.5(a)0.0102(b)0.42.00.110110410016.0 ksi17.5 ksiThetaOmegaSinh0.51200 F0.410350104104105UTS1060.2% Yield strength106550tr tn0.60104020033.5 ksi36.5 ksiThetaOmegaSinh0.620010210650102103101 400100101102200125Time, t (hr)Kachanov-RabotnovUTS2501001.0100Stress, (MPa)NMSE150Creep strain, 0.5350LMMMHMHGSCDMCDMSOSDMBMGSGWMGWParameter Model125Creep strain, 0.4tr0100Creep strain, 0.310122000.4Creep strain, 0.2Stress, (MPa)0.1Normalisedtime, t (hr)4004100700 C0.6Time, t (hr)0.0650(b)250.0825Stress, .280σσ rep1.0700 C0.7ε minσ σ σ s1.0Damage, 0.8T T TsarraySinhLMKR0.9σ σ σ s(T , σ ).10-51.0Damage, ε10-42 X T , Y σt t ts10-310-8σ max σtT t10-210-7Tmax Tε and ω at (T , σ ).10-110-6Damage, tr tω ωcr100 tr f (T , σ )Tmax T566 C593 C649 C760 C816 CSinh, 566 CSinh, 593 CSinh, 649 CSinh, 760 CSinh, 816 CKR, 566 CKR, 593 CKR, 649 CKR, 760 CKR, 816 C101 σ σ max σ minAxial Stress Ratio, y r T , σ , tT , TS , σ S , tS0100200300Time, t (hr)400500600-2.0-1.5-1.0-0.50.00.5Axial Stress Ratio, x r1.01.52.0
Ongoing Work14A modified Wilshire Model for Creep Deformation, Damage, and Rupture Prediction2An Analytical Calibration for a Modified Theta-Projection Model3Metamodeling Minimum Creep Strain Rate LawsA Probabilistic Approach to Creep Deformation, Damage, and Rupture Prediction16
A Modified Wilshire ModelBiography BS in Mechanical Engineering; The University of Texas at El Paso(2014-2018). MS in Mechanical Engineering; The University of Texas at El Paso,(Fall 2018-current) Graduate Research Assistant at The UTEP Materials at ExtremeResearch Group (MERG)Jaime CanoList of Publication Cano, J., and Stewart, C.M., 2019, “Application of the Wilshire Stress-Rupture and Minimum-Creep-Strain-RatePrediction Models for Alloy P91 in Tube, Plate And Pipe Form,” ASME TurboExpo 2019, Phoenix, Arizona, June17-21, 2019. Cano, J., and Stewart, C.M., 2019, “Modified Wilshire Model for Long-Term Creep Deformation” SETS 2019, ElPaso, TX, March 26-27, 2019.17
Wilshire ModelStress-Rupture and Minimum-Creep-Strain-Rate Model 𝜎𝜎𝑄𝑄𝑐𝑐 exp( 𝑘𝑘1 𝑡𝑡𝑓𝑓 exp 𝜎𝜎𝑇𝑇𝑇𝑇𝑅𝑅𝑅𝑅𝑢𝑢) 𝜎𝜎𝑄𝑄𝑐𝑐 exp( 𝑘𝑘2 ���𝑇𝑇𝑅𝑅𝑅𝑅𝑣𝑣)18
Continuum Damage Mechanics (CDM) FrameworkInsertion of Wilshire Model into Sinh CDM ModelSine-Hyperbolic (Sinh) Framework𝜀𝜀𝑐𝑐𝑐𝑐̇ 𝜀𝜀𝑚𝑚𝑚𝑚𝑚𝑚̇ exp(𝜆𝜆𝜔𝜔3 2)Sinh deformation model1𝑡𝑡𝜔𝜔 𝑡𝑡 ln[1 1 exp 𝜙𝜙]𝜙𝜙𝑡𝑡𝑟𝑟Damage ModelWilshire Model � ln( ) 1𝜎𝜎𝑇𝑇𝑇𝑇 𝑣𝑣()𝑘𝑘2 𝑄𝑄𝑐𝑐 �� ln( ) 1𝜎𝜎𝑇𝑇𝑇𝑇 𝑢𝑢()𝑘𝑘1𝑡𝑡𝑟𝑟 𝑄𝑄𝑐𝑐 exp 𝑅𝑅𝑅𝑅Time of Rupture19
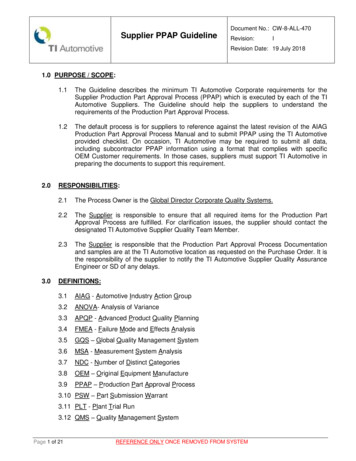
Modified Wilshire ModelP91 Data @ 600 C0.5100 MPa110 MPa120 MPa140 MPa160 MPa200 MPaStrain, 0.40.30.20.10.010-210-1100101102Time, hr103104105 The previous model proposed to create creepdeformation curves that is not clear and iscomplicated to implement. The modified Wilshire model has a clearanalytical approach that depends on theequations already established. The rupture predictions of the model enablesthe capabilities of the modified model topredict ductility even for long-term data. The model predicts with high accuracy forP91 and 304 stainless steel even withuncertainty in the data. If enough data is given, the model has thecapability to predict across multipleisotherms and stress levels due to the natureof the Wilshire model.20
Analytical Calibration Approach to Theta-ProjectionBiography BS in Mechanical Engineering; The University of Texas at El Paso(2013-2017). MS in Mechanical Engineering; The University of Texas at El Paso,(Fall 2018-current) Graduate Research Assistant at The UTEP Materials at ExtremeResearch Group (MERG)Jimmy J PerezList of Publication Perez, J., and Stewart, C.M., 2019, “Asssessment of the Theta Projection Model for Interpolating CreepDeformation,” ASME TurboExpo 2019, Phoenix, Arizona, June 17-21, 2019. Perez, J., and Stewart, C.M., 2019, “An Alternative Method for Interpolating and Extrapolating StrainPredictions Using the Theta Projection Model,” SETS 2019, EL Paso, TX, March 26-27, 2019.21
Analytical Calibration Approach to Theta-ProjectionA new analytical method of calibration Theta-Projection model is proposed. The traditional method proposed by Evansrequires the constants to be calibrated using a least-square nonlinear scheme of numerical optimization with respect to anerror function. This results in constant values with no physical significance, which in turn does not provide a consistent trendfor long-term prediction. The analytical method derives the theta constants from test data to give the constants physicalrealism.Theta-Projection model𝜀𝜀 𝜃𝜃1 (1 exp( 𝜃𝜃2 𝑡𝑡)) 𝜃𝜃3 (exp(𝜃𝜃4 𝑡𝑡) 1)Primary and tertiary equation are separatedPrimary equation𝜀𝜀𝑝𝑝𝑝𝑝 𝜃𝜃1 (1 exp( 𝜃𝜃2 𝑡𝑡) The accumulated primary strain is equated to 𝜃𝜃1 and is usedto back-solve for 𝜃𝜃2 .Primary strainaccumulation𝜃𝜃1 ���𝜀𝑡𝑡𝑡𝑡 𝜃𝜃3 (exp(𝜃𝜃4 𝑡𝑡exp ) 1 The tertiary acceleration is determined by taking thequotient of the second derivative over the first derivative at95% of rupture time and is used to back-solve for 𝜃𝜃3 .Back-solved exponential decay ���𝑠 𝑎𝑎𝑎𝑎𝑎𝑎𝜃𝜃2 ln(1 )𝑡𝑡𝑝𝑝𝑝𝑝,𝑠𝑠𝑠𝑠𝑠𝑠 𝑎𝑎𝑎𝑎𝑎𝑎𝜃𝜃11Tertiary equationBack-solved tertiary scalar𝜃𝜃3 𝜀𝜀95% 𝜃𝜃1exp(𝜃𝜃4 𝑡𝑡95% ) 1Tertiary acceleration𝜃𝜃4 𝜀𝜀95%̈𝜀𝜀95%̇22
Modified Interpolation/Extrapolation FunctionsThe original interpolation/extrapolation function used with the Thera-projection model does not consistently provide goodpredictions with limited data. A much more consistent trend with rupture time is proposed for prediction. The error between thenew function and the calibrated theta constants is less than that of the original. A benefit to the alternative prediction function isthat it requires less variables than the original.Alternative interpolation/extrapolation functionLn( )121Ln( 3) fit00Ln( 3)Ln( 2)22-1-1-2-2-3-3810121416Stress, (ksi)1820(a)21200 F1200 FLn( )Ln( 3)Ln( ) fit1.21200 F001.0-2-20.8-4-4Ln( 2)Ln( )-6-8-6Ln( 2) fitLn( ) fit-10Ln( ) 33-8-10 30.6𝜃𝜃𝑖𝑖 𝐴𝐴𝑖𝑖 𝑡𝑡𝑟𝑟 fit 3 fit0.41.21.41.01.20.80.60.4810121416Stress, (ksi)181.41200 F 2 1.00.8 2 fit 001000015000Rupture Time, tr (hr)20000(a)050001000015000Rupture Time, tr (hr)𝜽𝜽𝟏𝟏 NMSE0.0190𝜽𝜽𝟐𝟐 NMSE4.9527e-4𝜽𝜽𝟑𝟑 NMSE0.09212.2936e-3Original function0.01679.2036e-40.08555.3149e-3% Improvement12857131Alternative function1.20.2-12-12 𝐵𝐵𝑖𝑖 𝜃𝜃𝑖𝑖 exp(𝑎𝑎𝑖𝑖 𝑏𝑏𝑖𝑖 𝜎𝜎 𝑐𝑐𝑖𝑖 𝑇𝑇 𝑑𝑑𝑖𝑖 𝜎𝜎𝜎𝜎) 3 2Original interpolation/extrapolation function20000(b)𝜽𝜽𝟒𝟒 NMSE23
Rupture Predictions for New FunctionStress, (ksi)The Modified interpolation/extrapolation function requires a method to predict rupture time. The Wilshire model provides anequation to predict rupture time that relies on the temperature and stress of test data as well as activation energy for thematerial. The Wilshire model also serves as analytical means to predict rupture time rather than using an arbitrary averagerupture ductility to find rupture time using the theta model.Rearranged to relate experimental stressand temperature to rupture time1 𝑢𝑢Wilshire Equation𝜎𝜎ln( 𝜎𝜎𝑄𝑄𝑐𝑐 𝑢𝑢1𝜎𝜎𝑇𝑇𝑇𝑇 exp( 𝑘𝑘1 𝑡𝑡𝑟𝑟 exp( ) )𝑡𝑡 ��𝑄𝑐𝑐 𝑘𝑘1exp( )𝑅𝑅𝑅𝑅Material constants 𝑘𝑘1 , 𝑘𝑘2 , 𝑢𝑢, and 𝑣𝑣 are20Rupture predictions1200 Fcalibrated using several stresses at18using the WilshireStress-Rupture Datavarious isotherms to predict rupture timeValidation Dataequation are16Stress-Rupture Predictioncompared to14calibration dataand validation data12for a single10isotherm of alloy8P91.0500010000150002000024Rupture Time, t (hr)
Metamodeling Minimum-Creep-Strain-Rate LawsBiography B.Sc. in Mechanical Engineering; University of Texas at El Paso,(2015-2018). M.S. in Mechanical Engineering; The University of Texas at El Paso,(Spring 2019-Current) Masters Research Assistant at The UTEP Materials at ExtremeResearch Group (MERG)Ricardo VegaList of Publication Vega, R., and Stewart, C.M., 2019, “Development and Application Of Minimum Creep Strain RateMetamodeling,” ASME TurboExpo 2019, Phoenix, Arizona, June 17-21, 2019. Vega, R., and Stewart, C.M., 2019, “Metamodeling of Minimum Creep Strain Rate Models with TemperatureDependence,” SETS 2019, EL Paso, TX, March 26-27, 2019. Vega, R., and Perez, J., and Stewart, C. M., 2018, “Identification of Creep Strain Constants and Accurate ModelFits using Numerical Optimization ,” SETS 2018, El Paso, TX, April 14th, 2018.25
Metamodeling Minimum-Creep-Strain-Rate iWilshireThetaProjection Metamodeling is the process of applyingmathematical rules and constraints togenerate models-of-models. Thesemodels-of-models, or “metamodels”,exist as a mathematical combination ofknown models that can regress back intoeach known model under prescribedconstraints Metamodel has the capability for the selfidentification for a given set of data. Metamodels can be employed in anunconstrained or pseudo-constrainedmanner to identify unique MCR modelsthat exist between the known models.26
Minimum-Creep-Strain-Rate ModelsModelNorton1929Simplified 5Johnson-Henderson-Kahn1936Equationε min A σ σ0 n * *exp Qc RT * ε min Aσ n *exp Qc RT * Q 1 cε min Aexp(σ cσ )*exp RT 0 0 0 ε min A exp σσ 1 0 * *exp Qc RT * c * c ε min Asinh σσ *exp QRT ε min Aexp σσ *exp QRT nn 1 2* σσ Qc ε min [ A σ A2 σ ]*exp 0 RT 0 1 0 Garofalo1965ε min A sinh σσWilshire2007 ln( σ ) σ TS ε min n **exp Qc RT 1 vk2 * Q c*exp RT 27
Proposed MCR Metamodel Metamodel (Constrained).ε min σ σ σ σ A1 A2 A3 sinh A4 exp σ o σo σo σo n1n2n3 αo Metamodel (Pseudo-Constrained).ε min σ σ σ σ H ( x1 ) A1 H ( x2 ) A2 H ( x3 ) A3 sinh H ( x4 ) A4 exp σo σo σo σ on1n2n3 H ( x5 )α o Temperature Dependent Metamodel (Constrained)1 σ v n2n3 a3 ln σ n1. σ σ a1 σ o exp Q ε min A1 A2 A3 sinh A4 exp cσ a2 σσσk RT σo 2 o o o 28
MCR Prediction for Different Models10100Stress, (MPa)Soderberg10-1-2-3-4-5-6-7-8-9EXP 600 CEXP 625 CEXP 650 CSIM 600 CSIM 625 CSIM 650 C110100Stress, (MPa)1000EXP 625 CEXP 650 CSIM 600 C LowSIM 625 C LowSIM 650 C LowSIM 600 C HighSIM 625 C HighSIM 650 C High10100Stress, (MPa)1000EXP 600 CEXP 625 CEXP 650 CSIM 600 CSIM 625 CSIM 650 C110100Stress, (MPa)EXP 600 CEXP 625 CEXP 650 CSIM 600 CSIM 625 CSIM 650 8-9EXP 600 C11000MCR, min(hr-1)MCR, min(hr-1)1MCR, min(hr-1)MCR, min(hr-1)EXP 600 CEXP 625 CEXP 650 CSIM 600 C LowSIM 625 C LowSIM 650 C LowSIM 600 C HighSIM 625 C HighSIM 650 C HighMCR, min(hr-1)10-1-2-3-4-5-6-7-8-9Simplified Norton10-1-2-3-4-5-6-7-8-9MCR, min(hr-1)Norton100010100Stress, (MPa)1000Garofalo10-1-2-3-4-5-6-7-8-9EXP 600 CEXP 625 CEXP 650 CSIM 600 CSIM 625 CSIM 650 C110100Stress, (MPa)100029
Generated PredictionsJHK Model, Pseudo-ConstrainedJHK Model, Temp Dependence, Constrained11EXP 600 CEXP 625 CEXP 650 CSIM 600 CSIM 625 CSIM 650 CMCR, min (hr-1)-1-2-3EXP 625 CPseudo-Constrained-4.-5-6-7Isotherm( All-9110EXP 600 C0100Stress, (MPa)10006.58-1MCR, min(hr-1)0EXP 650 C-2SIM 600 C.-3SIM 625 C.-4SIM 650 C-5-6-7-8-91101001000Stress, (MPa)30
Probabilistic Approach to Creep Modeling BiographyB.Sc. in Naval Architecture and Marine Engineering; BangladeshUniversity of Engineering and Technology, (2011-2016).Ph.d. in Mechanical Engineering; The University of Texas at El Paso,(Fall 2018-current)Worked as a Lecturer in the Department of Naval Architecture andMarine Engineering in Military Institute of Science of Technology.Doctoral Research Assistant at The UTEP Materials at ExtremeResearch Group (MERG)Md Abir HossainList of Publication Hossain, M.A., and Stewart, C.M., 2019, “Reliability Prediction of Sine-Hyperbolic Creep-Damage Model usingMonte Carlo Simulation Method,” ASME PVP 2019, San Antonio, Texas, July 14 – 19, 2019. Hossain, M. A., and Stewart C.M., 2019, “Probabilistic Evaluation of 304 Stainless Steel using Sine HyperbolicCreep-Damage Model,” SETS 2019, EL Paso, TX, March 26-27, 2019.31
Sources of UncertaintyThe Reliability ofCreep BehaviorUncertainty ofMaterial ConstantsUncertainty of preexisting DefectsUncertainty ofService Condition 𝜎𝜎 𝑡𝑡 , 𝑇𝑇(𝑡𝑡)32
Sine-Hyperbolic Creep-Damage ModelThe coupled creep-damage Sinh constitutive model used in this study consisting of creepstrain rate and damage evolution equations are as follow. σ 3/2 exp(λω ) σs ε cr A sinh χ σ M [1 exp( φ )]sinh exp(φω )ω φ σt .Material ConstantABehaviorSecondary Creep coefficientMAccommodates temperaturedependencyσsMechanism Transition StressσtMechanism transition stressφControls the trajectoryλDictates the slope of creep curves33
Uncertainty Analysis of Creep-Damage Model Experimental creep deformation data for 304 StainlessSteel with 10 replicated test at each temperature statewas adopted from the material database. Sine-Hyperbolic creep-damage model has been selectedfor integrating the probabilistic feature because of theease of calibration and implementation over other model. Different material constant present in the Sinh modelwere calibrated and demonstrated the intrinsicuncertainty carried by each of the material constant. Monte Carlo simulation was used to introduce therandomness into the te CarloMethod34
Inherent Uncertainty in Experimental Data of riteriaMaximumMinimum% CoVMCSR, %0.072810.02998834.57Rupture Time (hr)63.360846.054212.55MCSR, %0.0257430.01134934.95Rupture Time (hr)147.439100.00216.12MCSR, %0.1885270.10844723.33Rupture Time (hr)42.129626.889416.60MCSR, %0.461980.01767648.02Rupture Time (hr)163.526127.6159.48MCSR, %0.0563260.02067343.02Rupture Time (hr)93.126382.73434.48MCSR, %0.0087760.00625112.74Rupture Time (hr)196.412156.95098.7935
SCRI ModelStartInputCalibrated Material ndomNumbersRandomNumbersRandomNumbersUncertaintyM, 𝜎𝜎𝑡𝑡UncertaintyA, 𝜎𝜎𝑠𝑠Uncertainty𝜆𝜆 and onUncertainty𝜀𝜀𝑝𝑝𝑝𝑝Rupturetime, 𝑡𝑡𝑡𝑡𝑡𝑡Vector of tDamage 𝜔𝜔 , Damage rate 𝜔𝜔̇ , Creep rate 𝜀𝜀̇Creep strain,𝜀𝜀𝑐𝑐𝑐𝑐Plot 𝜀𝜀𝑐𝑐𝑐𝑐 vs tn n 1N nEndN is the number of Monte CarloSimulationCurrent: Uniform Distributed RandomNumbersFuture: Normal DistributedRandom Numbers36
Predicted Creep Deformation CurvesAt 600 C subjected to 300 MPaAt 600 C subjected to 320 MPa59MC Sinh8MC 46300-T43.5320-T5300-T53Creep strain %Creep strain %5432.521.52110.500010203040time,t (hr)5060708090020406080100120140160180200time,t (hr)37
Predicted Creep Deformation CurveAt 650 C subjected to 260 MPaAt 650 C subjected to 240 MPa1418MC Sinh16MC T412240-T58Creep strain %10Creep strain %240-T4260-T5866442200010203040time,t (hr)50607080020406080100120140160180time,t (hr)38
Predicted Creep Deformation CurvesAt 700 C subjected to 180 MPaAt 700 C subjected to 160 MPa1416MC Sinh14MC T4160-T4180-T5160-T510Creep strain %Creep strain %8866442200020406080time,t (hr)100120140160050100150200250300350time,t (hr)39
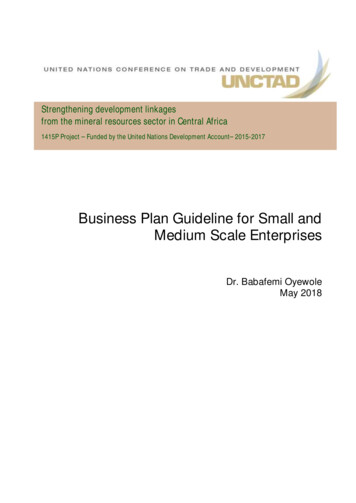
Reliability Bands for MCSRMCSR Bands at 650 CMCSR Bands at 600 C1010.01% Reliability Band99.9% Reliability Band50% Reliability BandExp 320Exp 3000.1Minimum Creep Strain RateMinimum Creep Strain RateMCSR Bands at 700 C0.0199.9% Reliability Band0.01% Reliability Band50% Reliability BandExp 240Exp 26010.10.010.0010.001280290300310Stress, (MPa)320330340220230240250260270280Stress, (MPa)40
Reliability Bands for Stress-Rupture0.01% Reliability Band99.9% Reliability Band50% Reliability BandExp data300Stress, (MPa) Reliability bands represents whether theprobabilistic evaluation is conservativeor non-conservative. Probabilistic feature in creep-damagemodel will help estimate the failure ofthe components well in advance.250 Application of Probabilistic evaluation inthe Metamodeling will be -46 Integration of the probabilisticmodeling in the commercial FEMsoftware will help in simulating eventwhich might cause catastrophic failuresuch as failure of a turbine blade.41
Market Benefits/Assessment Better prediction for long term service : Aid Design Assess the probability of failure. Uncertainty calibration : Repair, Replacement, Refurbishment. Schedule less inspection : Condition based inspection Replacement can be scheduled before the actual failure.42
Technology-to-Market Path Generalized USER CREEP file for the commercial and academic use. Developed material database : scope to add more. User Material creep subroutine for the FEM software. Optimization of the component material behavior at extreme environmentGlobal Optimization43
Concluding Remarks Probabilistic Creep Models : Alternative to expensive testing. Life prediction : DOE life extension program. Inherent Uncertainty : Long lived FE fleets. Complete the ongoing and final tasks enlisted in the Project proposal. Guideline for the model selection : Best Model; Best Data.44
AcknowledgmentsMd Abir HossainPh.D. in Mechanical EngineeringDoctoral Research Assistantmhossain9@miners.utep.eduCalvin M. Stewart, PhDAssociate Professor of Mechanical engineeringDirector of the Materials at Extremes Research Groupcmstewart@utep.eduProject title: A Guideline for the Assessment of Uniaxial Creep and Creep-Fatigue Data and ModelsThe work conducted in this study is funded by a grant from the Department of energyAward Number: DE-FE002758145
46
Task 4: Mathematical Analysis and FEA of Models. Task 5: Calibration & Validation – Fit, Interpolation, and Extrapolation of Models. Task 6: Post-Audit Validation of the Models . Task 7: Uncertainty Analysis