Transcription
NASDAQCCOIINVESTOR PRESENTATION
Cautionary Note Regarding Forward-Looking StatementsThis presentation includes forward-looking statements within the meaning of the Private Securities Litigation Reform Act of 1995, which relate to future, not past, events and are subject to risks and uncertainties. The forward-lookingstatements, which address the Company's expected business and financial performance, among other matters, contain words such as: “will”, “expect”, “believe”, “continue ”, “optimistic”, “should”, “ongoing” and other words and terms of similarmeaning.Forward-looking statements by their nature address matters that are, to different degrees, uncertain, such as revenue, subscriber and traffic growth, margins, capital expenditures, sales force headcount and productivity, pricing, financings andreturn of capital shareholders. Although the Company believes the expectations reflected in such forward-looking statements are based upon reasonable assumptions, it can give no assurance that the expectations will be attained or that anydeviation will not be material. Readers are cautioned not to place undue reliance on these forward-looking statements, which speak only as of the date on which they are made.Factors that could cause actual results to differ materially from these forward-looking statements, include, but are not limited to, the following: future economic instability in the global economy, which could affect spending on Internet services;the impact of changing foreign exchange rates (in particular the Euro to US dollar and Canadian dollar to US dollar exchange rates) on the translation of the Company’s non-US dollar denominated revenues, expenses, assets and liabilities;legal and operational difficulties in new markets; the imposition of a requirement that the Company contribute to the US Universal Service Fund on the basis of the Company’s Internet revenue; changes in government policy and/or regulation,including rules regarding data protection, cyber security and net neutrality; increasing competition leading to lower prices for the Company’s services; the Company’s ability to attract new customers and to increase and maintain the volume oftraffic on its network; the ability to maintain the Company’s Internet peering arrangements on favorable terms; the Company’s reliance on an equipment vendor, Cisco Systems Inc., and the potential for hardware or software problemsassociated with such equipment; the dependence of the Company’s network on the quality and dependability of third-party fiber providers; the Company’s ability to retain certain customers that comprise a significant portion of its revenuebase; the management of network failures and/or disruptions; and outcomes in litigation.A further description of these uncertainties and other risks can be found in the Company’s Annual Report on Form 10-K for the year ending December 31, 2021, Quarterly Reports on Form 10-Q for the quarters ending March 31, 2022,September 30, 2021 and June 30, 2021 and the Company’s other reports filed with the Securities and Exchange Commission. Copies of these filings may be obtained by contacting the Company or by visiting EDGAR on the SEC’s website.These or other uncertainties may cause the Company’s actual future results to be materially different than those expressed in any forward-looking statements. The Company undertakes no obligation to update or revise any forward-lookingstatements.Non-GAAP MeasuresThis presentation includes and discusses EBITDA and EBITDA as adjusted, Gross Margin, and EBITDA Margin and EBITDA, as Adjusted Margin which are non-GAAP measures. Management uses these non-GAAP measures to evaluate itsbusiness because they believes these measures assist investors and analysts in comparing the Company’s performance across reporting periods on a consistent basis by excluding items that management believes are not indicative of theCompany’s core operating performance. Management believes these metrics are used in the financial community, and these metrics are presented here to enhance understanding of the Company’s operating performance. You should notconsider these non-GAAP measures as alternatives to Net income, determined in accordance with GAAP, as an indicator of operating performance. Furthermore, these non-GAAP measures are not measurements of financial performanceunder GAAP, and thus may not be comparable to similarly titled measures of other companies.EBITDA represents Net income before Income taxes, net interest expense, depreciation and amortization, and equity based compensation expenses. EBITDA, as adjusted, represents EBITDA plus net gains (losses) on asset relatedtransactions. EBITDA margin represents Net income before Income taxes, net interest expense, depreciation and amortization, and equity based compensation expenses, divided by total service revenue. EBITDA, as adjusted, marginrepresents EBITDA plus net gains (losses) on asset related transactions divided by total service revenue. See the Appendix to this presentation for a reconciliation of these non-GAAP measures to the most directly comparable financialmeasures calculated and presented in accordance with GAAP.2
company overviewCogent is aleading, globalprovider ofInternetAccess. We operate a global network carrying over 20% of all internettraffic We offer high speed internet access to two customer bases:― Corporate: 58% of revenues― Netcentric: 42% of revenues We differentiate and gain share in a commodity business byfocusing on price and value We have very high operating leverage with substantialnetwork capacity We operate in 50 countries in 216 markets3
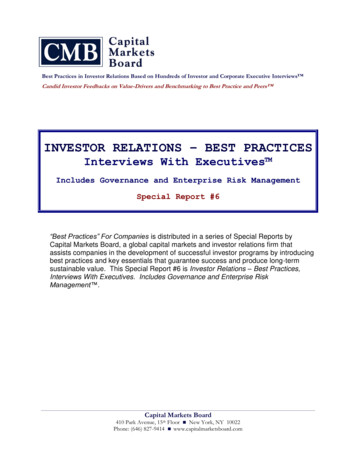
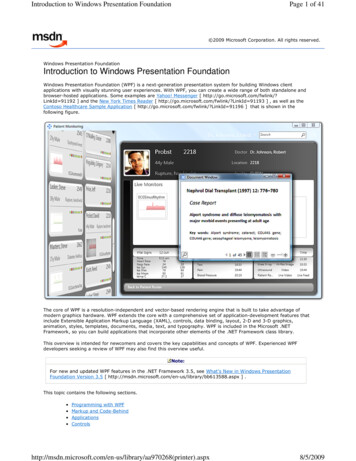
the on-net corporate opportunityCompetitors Bell Canada AT&T Cable Operators Verizon Lumen TechnologiesLocation 1,800 Class A MTOBs in city core 100 cities in North AmericaCustomers Located in City Core Strong Credits Professional/Financial ServicesGrowth Opportunity Potential market: over 93,000 MTOB tenants Favorable trends: Cloud, SaaS, WFH, Virtual Business(Zoom), IoT Superior speed, service, uptime, install SLAs Cogent wins approximately 40% of all On-Net proposalsCogent Advantages Price per connection is relatively equivalent Superior reliability: ring architecture; fiber; electronics Significant speed advantage: 2.5x to 65.0x Faster installation: Avg. installs 13 - 15 days vs 90 days Real time monitoring Industry leading SLAsGrowing Addressable Market1,000800600Growth in MTOB SqFt in MillionsQ1 2010 – Q1 20229925974002000Q1 2010Q2 2010Q3 2010Q4 2010Q1 2011Q2 2011Q3 2011Q4 2011Q1 2012Q2 2012Q3 2012Q4 2012Q1 2013Q2 2013Q3 2013Q4 2013Q1 2014Q2 2014Q3 2014Q4 2014Q1 2015Q2 2015Q3 2015Q4 2015Q1 2016Q2 2016Q3 2016Q4 2016Q1 2017Q2 2017Q3 2017Q4 2017Q1 2018Q2 2018Q3 2018Q4 2018Q1 2019Q2 2019Q3 2019Q4 2019Q1 2020Q2 2020Q3 2020Q4 2020Q1 2021Q2 2021Q3 2021Q4 2021Q1 2022Market Players4
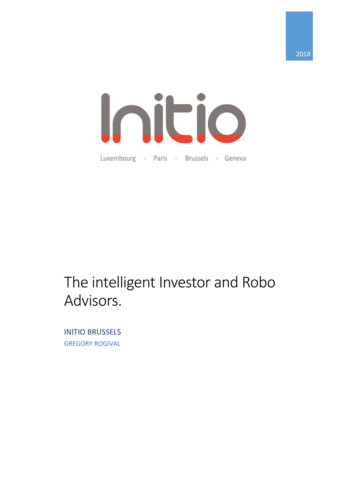
18 16 14 12 10 8 6 4 2 0Q1 2010Q2 2010Q3 2010Q4 2010Q1 2011Q2 2011Q3 2011Q4 2011Q1 2012Q2 2012Q3 2012Q4 2012Q1 2013Q2 2013Q3 2013Q4 2013Q1 2014Q2 2014Q3 2014Q4 2014Q1 2015Q2 2015Q3 2015Q4 2015Q1 2016Q2 2016Q3 2016Q4 2016Q1 2017Q2 2017Q3 2017Q4 2017Q1 2018Q2 2018Q3 2018Q4 2018Q1 2019Q2 2019Q3 2019Q4 2019Q1 2020Q2 2020Q3 2020Q4 2020Q1 2021Q2 2021Q3 2021Q4 2021Q1 2022Market PlayersCompetitors: Primarily global & regionalRegionalGlobal Lumen Technologies AT&T DT NTT Arelion (previously Telia)ARPU (Rev/Mbit) Tata VerizonCustomers Connect in Data Centers Streaming / OTT CDNs ASPs Access NetworksRapid Growth/Declining /bitAvg Tbyts/s70605010%40305%2010-10%Q1 2010Q2 2010Q3 2010Q4 2010Q1 2011Q2 2011Q3 2011Q4 2011Q1 2012Q2 2012Q3 2012Q4 2012Q1 2013Q2 2013Q3 2013Q4 2013Q1 2014Q2 2014Q3 2014Q4 2014Q1 2015Q2 2015Q3 2015Q4 2015Q1 2016Q2 2016Q3 2016Q4 2016Q1 2017Q2 2017Q3 2017Q4 2017Q1 2018Q2 2018Q3 2018Q4 2018Q1 2019Q2 2019Q3 2019Q4 2019Q1 2020Q2 2020Q3 2020Q4 2020Q1 2021Q2 2021Q3 2021Q4 2021Q1 2022the netcentric opportunityMarket Dynamics New applications drive bandwidth― File Sharing/Gaming/Video/Streaming Product sold on a per Mbps basis from 1 Gbps to 400 Gbps Internet connectivity is a pure commodity― Speed, connection equivalent Cogent prices new services at 50% of market― We win on priceSequential Revenue Growth15%0%Avg 1.3%-5%5
customer onnections:49,491Revenue Share:58%Revenue Share:42%Traffic Share:5%Traffic Share:95%Geography:North AmericaGeography:GlobalClients:Professional Services (Law Firms,Accounting, Insurance)Financial ServicesUniversities, SchoolsClients:Access Networks - ILECs, Cable, ISPsCDNsStreaming / OTTOnline GamersService Locations:MTOBsService Locations:Data CentersLongevity:4 Years: 63%1 Years: 91%Longevity:4 Years: 45%1 Years: 83%Monthly Churn:1.2%Monthly Churn:0.8%6
large & growing addressablemarketOur broadnetwork reachresults in aplentifuladdressablemarket. Corporate services are sold On-Net in MTOBsPotentialExistingExistingExisting Customers Connections CustomersBuildings in MTOBs* in MTOBs in MTOBs Market %On-Net1,82493,02437,68113,35314.4%* Assumes 51 tenants per building Cogent is able to sell Off-Net connections in 4MMbuildings through over 90 carrier relationships for fiberdelivery Connectivity is sold to Netcentric customers in 50countries ‘Content’: CDNs, OTTs/Streamers, Gaming ‘Eyeballs’: 7,625 Access Networks: ISPs, PTTs,Cable, Mobile7
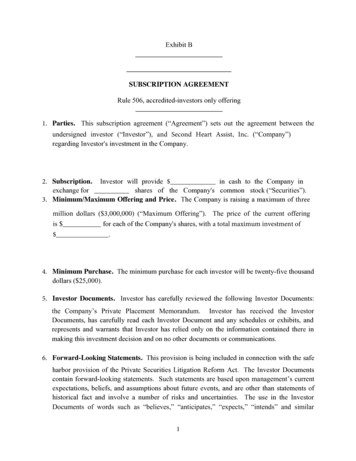
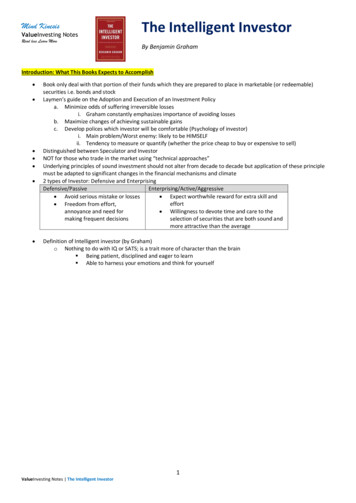
7006000Q1 2010Q2 2010Q3 2010Q4 2010Q1 2011Q2 2011Q3 2011Q4 2011Q1 2012Q2 2012Q3 2012Q4 2012Q1 2013Q2 2013Q3 2013Q4 2013Q1 2014Q2 2014Q3 2014Q4 2014Q1 2015Q2 2015Q3 2015Q4 2015Q1 2016Q2 2016Q3 2016Q4 2016Q1 2017Q2 2017Q3 2017Q4 2017Q1 2018Q2 2018Q3 2018Q4 2018Q1 2019Q2 2019Q3 2019Q4 2019Q1 2020Q2 2020Q3 2020Q4 2020Q1 2021Q2 2021Q3 2021Q4 2021Q1 2022Large SalesforceSalesforce GrowthQ1 2010 – Q1 2022500479400300 262200100SystematicProcessDirectWeb MarketingSales ForceTeleMarketing400 contacts24 appointments12 proposals4.7orders76543210Q1 2010Q2 2010Q3 2010Q4 2010Q1 2011Q2 2011Q3 2011Q4 2011Q1 2012Q2 2012Q3 2012Q4 2012Q1 2013Q2 2013Q3 2013Q4 2013Q1 2014Q2 2014Q3 2014Q4 2014Q1 2015Q2 2015Q3 2015Q4 2015Q1 2016Q2 2016Q3 2016Q4 2016Q1 2017Q2 2017Q3 2017Q4 2017Q1 2018Q2 2018Q3 2018Q4 2018Q1 2019Q2 2019Q3 2019Q4 2019Q1 2020Q2 2020Q3 2020Q4 2020Q1 2021Q2 2021Q3 2021Q4 2021Q1 2022highly focused sales organizationConsistent ProductivitySales Rep Productivity (orders per month)Q1 2010 – Q1 2022Avg 5.2Salesforce Performance Simple product: modest training investment Success at building the team Highly leveraged compensationSalespeople typically win 40% ofOn-Net proposals Corporate & Netcentric8
business breakout3%8%Q1 202216%42%17%3% 1%21%58%81%75%United StatesEuropeCanada, SouthAmerica, Asia &AfricaOn-Net NetCentricOff-Net CorporateOff-Net NetCentricNetCentricCorporate46%5%IP (DIA & Transit)Rack & PowerVPN39%Non Core1%2%54%On-Net95%Q1 2022Off-NetNon Core98%99%North & South AmericaEurope, Asia & AfricaCorporateNetCentric30%5%VPN6% 1%8%48%On-Net CorporateOff-Net Corporate82%Corporate40%On-Net NetCentric52%Q1 2022North & South AmericaEurope, Asia & AfricaIP (DIA & Transit)13%70%37%On-Net CorporateNetCentricIP (DIA & Transit)Rack & PowerOff-Net NetCentric46%Non CoreVPN9
broad, deep, scaleable network Interconnected with 7,625 access networks 3,065 On-Net buildings 60% multi-tenant office buildings (1,824) 40% carrier neutral and Cogent data center buildings (1,241) Agreements with 250 building owners (REITs) 54 Cogent data centers with over 600,000 square feet Low cost network which is approximately 28% utilized 1,053 metro networks; 16,600 metro fiber route miles; 40,100 metrofiber miles Over 60,800 intercity fiber route miles North AmericaUp to 4,000 Gbps per city pair EuropeUp to 4,200 Gbps per city pair Transatlantic (Leased)3,690 Gbps (8 Providers, 10 Cables) Transpacific (Leased)920 Gbps (5 Providers, 7 Cables) Transindian (Leased)800 Gbps (5 Providers, 3 Cables) Transcaribbean (Leased)1,600 Gbps (3 Providers, 5 Cables)10
network architectureOur network isfacilities based—IRUs on fiber &ownership of alloptronics androutingequipment. Longhaul metro backbone is built from a diverse set of 297IRU suppliers IRUs from 10 to 40 years; most are pre-paid and have diverseend dates O M expenses are calculated by share of fiber pairs therebyreducing the cost to Cogent of maintaining a network Cogent’s network is ring protected at Layer 3 (IP convergence) All transport is IP directly over DWDM and CWDM Cogent generally owns lateral connections from the metrorings to the building Cogent owns riser facilities in multi-tenant buildings Cogent owns 54 data centers and 202 hubs that house corenetwork equipment11
cogent’s network advantageCogent’snetwork offerssubstantialcost andoperatingadvantagesChoiceImplicationIP over DWDM Simple, predictable performance Lowest cost networkSingle Vendor /Configuration ‘Southwest Airlines’ cost andoperating advantagesLT Lease of Fiber Pairs Reduced capital intensity andoperating costsOwnership of lateral andriser facilities Sole fiber access to most corp.customersRing architecture to all onnet customers Industry leading SLAs forinstallation and performanceNarrow, simple product line Low cost support Reduced sales training and costs12
big, diverse & balanced globalnetworkLeading Share of ContentProvidersAccess to Business/ResidentialCustomers Worldwide 45,300 corporate connectionsprimarily in North America In 1,824 On-Net MTOBs 7,799 Off-Net Buildings 1,437 On-Net Data Centers*Eyeballs‘Network Effect’A growing portion of Cogent’s traffic, currently73%, originates and terminates on-net OTT Media ServicesGaming ProvidersCDN NetworksASPContentDense Global Footprint *These datacenters are located in 1,241 buildings1,437 On-Net Data Centers*216 Markets50 Countries7,625 Access Networks24 Settlement Free PeersTier 1 peering statusFootprint / Network13
PeeringCustomers 180 35 Allied RiserFeb 2002 590 335 PSINet*Apr 2002 5,180 2,175 FNSIFeb. 2003 30 5FirstmarkJan 2004 1,100 560 Carrier 1*Mar 2004 1,035 535 UFO GroupAug 2004 25 5 Global AccessSep 2004 10 5 Aleron BroadbandOct. 2004 200 5 Verio*Dec 2004 5,700 390 14,050 4,050(Fiber Network Solutions, Inc)TOTAL ( in millions) BuildingAccessNetworkSep 2001PP&ENetRailDateCogent purchased 14 BILLION oforiginalinvestment for 60 MILLION.OriginalInvestmentproven integration execution *Purchased the majority of assets of these companies.This list does not include Applied Theory, FiberCity Networks, OnSite Access, Last Mile Connections, PacWest, and ANet.14
-4%10%5%8%6%2%*Loss of MegauploadRevenue Growth15%Corporate revenue is North American.PandemicQtrly Avg 2.3%0%-5%-5%-10%-10%SequentialRevenue GrowthQ1 2010 – Q1 20224%Qtrly Avg 1.8%0%-2% 50 40- 10Q1 2010Q2 2010Q3 2010Q4 2010Q1 2011Q2 2011Q3 2011Q4 2011Q1 2012Q2 2012Q3 2012Q4 2012Q1 2013Q2 2013Q3 2013Q4 2013Q1 2014Q2 2014Q3 2014Q4 2014Q1 2015Q2 2015Q3 2015Q4 2015Q1 2016Q2 2016Q3 2016Q4 2016Q1 2017Q2 2017Q3 2017Q4 2017Q1 2018Q2 2018Q3 2018Q4 2018Q1 2019Q2 2019Q3 2019Q4 2019Q1 2020Q2 2020Q3 2020Q4 2020Q1 2021Q2 2021Q3 2021Q4 2021Q1 2022SequentialQ1 2010 – Q1 2022Q1 2010Q2 2010Q3 2010Q4 2010Q1 2011Q2 2011Q3 2011Q4 2011Q1 2012Q2 2012Q3 2012Q4 2012Q1 2013Q2 2013Q3 2013Q4 2013Q1 2014Q2 2014Q3 2014Q4 2014Q1 2015Q2 2015Q3 2015Q4 2015Q1 2016Q2 2016Q3 2016Q4 2016Q1 2017Q2 2017Q3 2017Q4 2017Q1 2018Q2 2018Q3 2018Q4 2018Q1 2019Q2 2019Q3 2019Q4 2019Q1 2020Q2 2020Q3 2020Q4 2020Q1 2021Q2 2021Q3 2021Q4 2021Q1 20220%Q1 2010Q2 2010Q3 2010Q4 2010Q1 2011Q2 2011Q3 2011Q4 2011Q1 2012Q2 2012Q3 2012Q4 2012Q1 2013Q2 2013Q3 2013Q4 2013Q1 2014Q2 2014Q3 2014Q4 2014Q1 2015Q2 2015Q3 2015Q4 2015Q1 2016Q2 2016Q3 2016Q4 2016Q1 2017Q2 2017Q3 2017Q4 2017Q1 2018Q2 2018Q3 2018Q4 2018Q1 2019Q2 2019Q3 2019Q4 2019Q1 2020Q2 2020Q3 2020Q4 2020Q1 2021Q2 2021Q3 2021Q4 2021Q1 202215%Q1 2010Q2 2010Q3 2010Q4 2010Q1 2011Q2 2011Q3 2011Q4 2011Q1 2012*Q2 2012Q3 2012Q4 2012Q1 2013Q2 2013Q3 2013Q4 2013Q1 2014Q2 2014Q3 2014Q4 2014Q1 2015Q2 2015Q3 2015Q4 2015Q1 2016Q2 2016Q3 2016Q4 2016Q1 2017Q2 2017Q3 2017Q4 2017Q1 2018Q2 2018Q3 2018Q4 2018Q1 2019Q2 2019Q3 2019Q4 2019Q1 2020Q2 2020Q3 2020Q4 2020Q1 2021Q2 2021Q3 2021Q4 2021Q1 2022revenue growthSequentialQ1 2010 – Q1 2022* 01CalculatedRevenue Growth10%5%Qtrly Avg 1.3% 50% of NetCentric revenue is from outside the US.Strong Unlevered Free Cash Flow1Q1 2010 – Q1 2022 30 20 10 134MM cumulative in last 4 quarters.as EBITDA (as adjusted) less CAPEX, which includes principal payments on IRU capital(finance) leases.15
160 140 250 200 0Total Revenue by SegmentOn-Net Revenue20102011201220132014EBITDA, as adjusted201564%( in millions)Q1 2010 – Q1 202262% 12060% 10058% 80 40 2052% 50%Off-Net Revenue20162017Non Core RevenueEBITDA as Adjusted( in millions) & (% of revenue)2010 – 202190%80% 150 100 502018201920202021Q1 2010Q2 2010Q3 2010Q4 2010Q1 2011Q2 2011Q3 2011Q4 2011Q1 2012Q2 2012Q3 2012Q4 2012Q1 2013Q2 2013Q3 2013Q4 2013Q1 2014Q2 2014Q3 2014Q4 2014Q1 2015Q2 2015Q3 2015Q4 2015Q1 2016Q2 2016Q3 2016Q4 2016Q1 2017Q2 2017Q3 2017Q4 2017Q1 2018Q2 2018Q3 2018Q4 2018Q1 2019Q2 2019Q3 2019Q4 2019Q1 2020Q2 2020Q3 2020Q4 2020Q1 2021Q2 2021Q3 2021Q4 2021Q1 2022 180Q1 2010Q2 2010Q3 2010Q4 2010Q1 2011Q2 2011Q3 2011Q4 2011Q1 2012Q2 2012Q3 2012Q4 2012Q1 2013Q2 2013Q3 2013Q4 2013Q1 2014Q2 2014Q3 2014Q4 2014Q1 2015Q2 2015Q3 2015Q4 2015Q1 2016Q2 2016Q3 2016Q4 2016Q1 2017Q2 2017Q3 2017Q4 2017Q1 2018Q2 2018Q3 2018Q4 2018Q1 2019Q2 2019Q3 2019Q4 2019Q1 2020Q2 2020Q3 2020Q4 2020Q1 2021Q2 2021Q3 2021Q4 2021Q1 2022historical & continuing margin expansionNon GAAP Gross Margin(% of revenue)Q1 2010 – Q1 2022 6056%54%100%On-Net ARPU 463Q1 2022Off-Net ARPU 94870%Q1 202260%50%40%30%20%10%0%EBITDA, as adjusted - margin16
investing: increasing returns, demand driven, allfunded internallyCapital Expenditures and Principal Payments on IRU Capital Leases115( in millions) 2010 – 2022 82019202020215.918.12022 YTDPrincipal Payments on IRU Capital LeasesGrowing Returns (Revenue to CapEx & Principal Payments on IRU Capital Leases)( in millions) 2010 – 2022 022 YTDCapEx and Principal Payments on IRU Capital Leases / Revenue17
highlights( in millions)Q1 2021Q2 2021Q3 2021Q4 2021Q1 2022Q/Q %ChangeY/Y %ChangeOn-Net Revenue 109.9 111.0 111.1 110.7 112.61.7%2.4%Off-Net Revenue 36.7 36.7 36.7 36.3 36.40.2%(0.9)% 0.1 0.1 0.2 0.2 0.2(0.6)%43.9% 146.8 147.9 147.9 147.2 149.21.3%1.6%Gross Profit (Non-GAAP) 91.8 91.8 91.4 90.9 91.91.0%0.1%Gross Margin TDA 55.6 57.2 57.8 57.4 57.2(0.4)%2.9%EBITDA Margin37.9%38.7%39.0%38.9%38.3%(0.7)%0.5%EBITDA, as adjusted 55.6 57.2 57.8 57.3 57.2(0.4)%2.9%EBITDA, as adjusted Margin37.9%38.7%39.0%38.9%38.3%(0.7)%0.5%Non-Core RevenueTotal Revenue18
highly disciplined allocator of capitalCogent isfocused ondrivingprofitabilityand efficientlyallocatingcapital. M&A Discipline: Cogent has evaluated and passed onover 800 acquisitions since 2005. Cost Discipline: Cogent has improved its EBITDA andAdjusted Gross Margin consistently over 20 years. Returning Capital: Cogent has returned over 1.0Billion to shareholders since our 2005 public offering. Dividend Record: Cogent has increased its dividendfor 39 straight quarters sequentially. Bought back over 10MM shares. Management Ownership: Senior Management ownsapproximately 11% of Cogent and gets compensatedprimarily in stock.19
consistent return of capital; modestleverageCumulative Total Return of Capital by type ( M) 1,200 1,000 800 600 400 200 -2007*20082009*Includes June 2007 Note Transaction2010201120122013201420152016Cumulative Total Share Buyback20182019202020212022 YTD3.43.63.6202020212022 YTDCumulative Total Dividends PaidNet Debt/LTM 00720082009*EBITDA adjusted by including asset related gains201420
investment highlightsCogent is aleading globalInternetServiceProvider. Fundamentals provide for continued, consistentgrowth and profitability Independent, low-cost international network Network footprint targeted at high traffic locations Substantial network capacity; very high operatingleverage with low capital intensity Proven ability to grow top line and drive marginexposure and cash flow growth Very strong balance sheet with high levels of liquidity Experienced management team21
Cogent Communications Holdings, Inc.
AppendixReconciliation of non-GAAP measures to the most directly comparablefinancial measures calculated and presented in accordance with GAAP23
Non-GAAP EBITDA and non-GAAP EBITDA, as adjusted, reconciled to GAAP cash flowsprovided by operating activitiesQ1 2021Q2 2021Q3 2021Q4 2021Q1 2022Net cash flows provided by operating activities 47,106 39,749 47,418 35,984 49,411( in 000’s) – unauditedChanges in operating assets and liabilities (9,060) 2,352 (3,191) 7,607 (6,294)Cash interest expense and income tax expense 17,504 15,08013,526 13,819 13,439EBITDA 55,550 57,181 57,753 57,410 57,155018000 55,568 57,181 57,753 57,410 57,155EBITDA margin37.8%38.7%39.0%39.0%38.3%EBITDA, as adjusted, margin37.9%38.7%39.0%39.0%38.3%Q1 2021Q2 2021Q3 2021Q4 2021Q1 2022PLUS: Gains on asset related transactionsEBITDA, as adjustedNon-GAAP gross profit and non-GAAP gross margin reconciled to GAAP gross profit and GAAPgross margin( in 000’s) – unaudited 146,777 147,879 147,927 147,208 149,175Minus - Network operations expense including equity-based compensation andincluding depreciation and amortization expenseService revenue total79,06278,27679,25478,98580,137GAAP Gross Profit (1) 67,715 69,603 68,673 68,223 69,0382,076136163146144Plus - Equity-based compensation – network operations expensePlus – Depreciation and amortization expense21,97022,09622,60922,56722,688Non-GAAP Gross Profit (2) 91,761 91,835 91,445 90,936 91,870GAAP Gross Margin (1)46.1%47.1%46.4%46.3%46.3%Non-GAAP Gross Margin (2)62.5%62.1%61.8%61.8%61.6%(1)GAAP gross profit is defined as total service revenue less network operations expense, depreciation and amortization and equity based compensation included in network operations expense. GAAPgross margin is defined as GAAP gross profit divided by total service revenue.(2)Non-GAAP gross profit represents service revenue less network operations expense, excluding equity-based compensation and amounts shown separately (depreciation and amortization expense). NonGAAP gross margin is defined as non-GAAP gross profit divided by total service revenue. Management believes that non-GAAP gross profit and non-GAAP gross margin are relevant metrics to provideto investors, as they are metrics that management uses to measure the margin and amount available to the Company after network service costs, in essence these are measures of the efficiency of theCompany’s network.24
ESG effortsCogent is focusing on its ESG performance and improving and broadeningits disclosure:EnvironmentalCogent isfocused onEnvironmental,Social, andGovernance(ESG) Provided detailed performance characteristics and carbon footprintrelated to its Network Backbone Carbon emissions from Network Backbone declined in 2021 90% reduction in power used per Bit mile over the past 5 years. Nearing completion of a 1 megawatt solar facility in Pasadena, CaliforniaCogent ESG activity can be tracked on our website at www.cogentco.comSocial Provided detailed strategies and disclosures about our capabilities andour engagement activitiesGovernance Appointed a minority director to the Board of Directors in December2021. Stockholders approved an increase to the size of the Board of Directorsin May 2022, creating two new vacancies. The Board appointed a minority woman to fill one of the vacancies inMay 2022, and is actively searching for a director to further increase thediversity of the Board.25
Salesforce Performance. 262. 479. 0. 100. 200. 300. 400. 500. 600. 700. Q1 2010 Q2 2010 Q3 2010 Q4 2010 Q1 2011 Q2 2011 Q3 2011 Q4 2011 Q1 2012 Q2 2012 Q3 2012 Q4 2012 Q1 2013 Q2 2013 Q3 2013 Q4 2013 Q1 2014 Q2 2014 Q3 2014 Q4 2014 Q1 2015 Q2 2015 Q3 2015 Q4 2015 Q1 2016 Q2 2016 Q3 2016 Q4 2016 Q1 2017 Q2 2017 Q3 2017 Q4 2017 Q1 2018 Q2 2018 Q3 .