Transcription
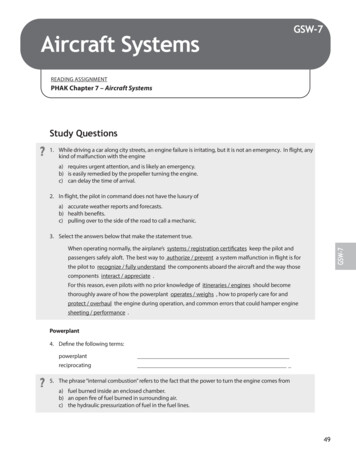
Table 5-1AIRCRAFT OPERATIONS AND FLEET MIX (2009, 2015, and 2030)INM Category/Aircraft200920152030Aircraft DescriptionBaselineNo ProjectAlternativeProposedProjectNo ProjectAlternativeProposedProject737700Boeing Business Jet3030301,4601,460CIT3Citation III374552552648648CL600Challenger 6006259219211,0821,082CLREGJCanadair Regional Jet 200--1,460--CNA500Citation I7001,0311,0311,2121,212CNA510Citation Mustang105155155182182CNA750Citation X523771771906906CRJ9-ERCanadair Regional Jet 900----1,460CRJ9-LRCanadair Regional Jet 1000---3,6503,650DO328Dornier 3282638384545EMB120Embraer 1201319192323EMB145Embraer 1453045455353EMB190Embraer 190-2,9201,4602,9201,460FAL20Falcon 20268395395464464GIIGulfstream II1726263030GIIBGulfstream III145214214252252GIVGulfstream IV304448448526526GVGulfstream V88130130152152IA1125Westwind Astra281414414487487LEAR25Lear 254972728484JetCharles M. Schulz-Sonoma County AirportEnvironmental Impact ReportMay 2011M-57
Table 5-1 continuedINM Category/Aircraft200920152030Aircraft DescriptionBaselineNo ProjectAlternativeProposedProjectNo ProjectAlternativeProposedProjectLEAR35Lear 356689859851,1581,158MU3001Beechjet 018,580JetSUBTOTALPropellerBEC58PBeech Baron13,60521,39721,39725,07125,071C130C130 Hercules507575100100CNA172Cessna 1725,3397,8697,8699,2489,248CNA182Cessna 1822,9124,2914,2915,0435,043CNA206Cessna 2067,07710,43010,43012,25812,258CNA208Cessna 2081,6762,4712,4712,9042,904CNA20TCessna 206 Turbo2,4623,6293,6294,2654,265CNA441Cessna Conquest1,8512,7292,7293,2073,207DHC6Dash 63,8835,7235,7236,7256,725DHC830Bombardier VSingle Engine Piston-FixedPitchSingle Engine Piston-VariablePitchOV10ARockwell Bronco7421,0931,0931,2841,284PA30Piper Twin Comanche72106106125125PA31Piper Navajo359530530623623SD330Shorts 330 (Piaggio P190)2,4573,6213,6214,2564,256Charles M. Schulz-Sonoma County AirportEnvironmental Impact ReportMay 2011M-58
Table 5-1 continuedINM Category/AircraftAircraft DescriptionSUBTOTAL200920152030BaselineNo ProjectAlternativeProposedProjectNo 556148,476148,476HelicopterA109Augusta 1099241,3611,3611,6001,600B222Bell 2224363637474B407Bell 4078661,2761,2761,5001,500EC130Eurocopter 1304363637474R44Robinson 441,9382,8562,8563,3563,356S70Sikorsky ,660143,209143,209173,785173,785SUBTOTALTOTAL OPERATIONSSOURCE: Mead & Hunt, MGA/L&B (2011)Charles M. Schulz-Sonoma County AirportEnvironmental Impact ReportMay 2011M-59
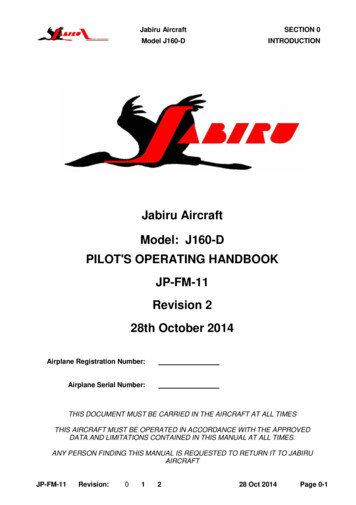
5.3NOISE IMPACTS OF THE NO PROJECT ALTERNATIVEFuture noise exposure at the Airport for the 2015 and 2030 No Project Alternative is presentedin this section. For the No Project Alternative, the airfield is retained in its current layoutthroughout the analysis period; the taxiway, runway, and flight track alignments would remainthe same as existing conditions. Changes in noise exposure would be generally due to changesin number of operations.5.3.12015 and 2030 No Project Alternative Noise Modeling AssumptionsThe major modeling input variables for this analysis are the number of aircraft operations, fleetmix, and runway utilization. All other INM input variables, such as time of day and stage length,are constant and are consistent with the non-air carrier aircraft under the existing conditionsdescribed in section 4. The runway utilization and time of day allocation for air carrier aircraftduring 2015 and 2030 are listed on Table 5-2 and 5-3. Flight track utilization rates for the 2015and 2030 No Project Alternative are assumed to be consistent with existing conditions, usingthe forecast activity levels for the respective timeframes, as the 2015 and 2030 No ProjectAlternative would not change the existing runway layout and no changes to existing air trafficcontrol procedures are proposed. The fleet mix changes from existing conditions by adding theEmbraer 190 to the 2015 No Project Alternative, and the Embraer 190 and the CanadiarRegional Jet 1000 to the 2030 No Project Alternative (See Table 5-1).5.3.22015 and 2030 No Project Alternative CNEL Noise ContoursCNEL contours for the Airport were prepared using the Integrated Noise Model Version 7.0b toassess noise conditions for the 2015 and 2030 No Project Alternative. These contours areshown in Figures 5-1 and 5-2.M-60
Table 5-2AIR CARRIER RUNWAY UTILIZATION – 2015 AND 2030INM AircraftTypeRunway01Aircraft 0Boeing Business Jet--91%9%CLREGCanadair Regional Jet 200--91%9%CRJ9-ERCanadair Regional Jet 900--91%9%CRJ9-LRCanadair Regional Jet 1000--91%9%DHC830Bombardier Q400--91%9%EMB190Embraer 190--91%9%ARRIVALS737700Boeing Business Jet--17%83%CLREGCanadair Regional Jet 200--17%83%CRJ9-ERCanadair Regional Jet 900--17%83%CRJ9-LRCanadair Regional Jet 1000--17%83%DHC830Bombardier Q400--17%83%EMB190Embraer 190--17%83%SOURCE: MGA/L&B (2011)M-61
Table 5-3AIR CARRIER OPERATIONS BY DAY/EVENING/NIGHT PERIOD – 2015 AND 2030INM AircraftTypeAircraft DescriptionDayEveningNightDEPARTURES737700Boeing Business Jet100%--CLREGCanadair Regional Jet 200100%--CRJ9-ERCanadair Regional Jet 900100%--CRJ9-LRCanadair Regional Jet 1000100%--DHC830Bombardier Q40061%17%22%EMB190Embraer 190100%--ARRIVALS737700Boeing Business Jet75%25%-CLREGCanadair Regional Jet 20075%25%-CRJ9-ERCanadair Regional Jet 90075%25%-CRJ9-LRCanadair Regional Jet 100075%25%-DHC830Bombardier Q40061%17%22%EMB190Embraer 19075%25%-SOURCE: RS&H, MGA/L&B (2011)M-62
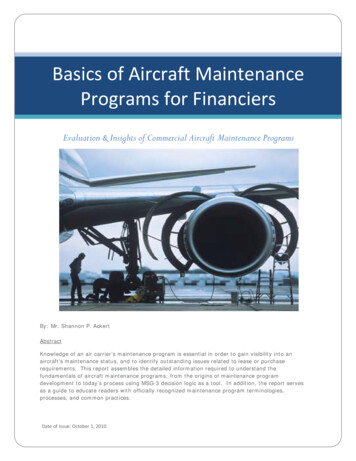
Figure 5-12015 NO PROJECT ALTERNATIVE CNEL CONTOURSSOURCE: MGA/L&B (2011)M-63
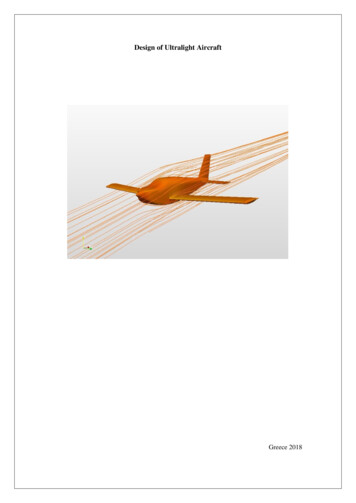
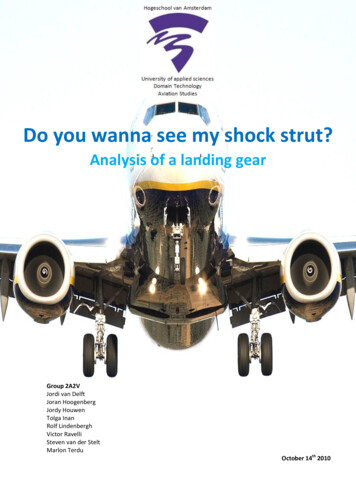
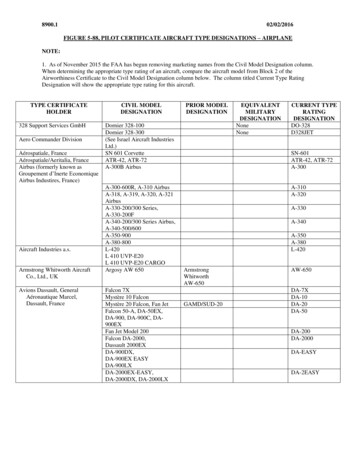
Figure 5-22030 NO PROJECT ALTERNATIVE CNEL CONTOURSSOURCE: MGA/L&B (2011)Table 5-4 below describes the size of the respective CNEL contours in acres. The contour areafor existing conditions is shown for comparison.M-64
Table 5-4YEARS 2015 AND 2030 NO PROJECT ALTERNATIVE CNEL AREA IN ACRESContour20152030Baseline 2009CNEL (dB)No Project Alt.No Project Alt.55 – 601,0061,4501,76260 – 6539856566765 – 7015922426370 – 75719310675 5072831,6842,4042,88155 CNEL & greaterSOURCE: MGA/L&B (2011)As shown in Table 5-4, the 55 through 75 CNEL contour would increase in area under the 2015and 2030 No Project Alternative conditions due to the forecast increase in total operationsduring the respective years. CNEL noise levels can also be expressed in tabular form forspecific sites of interest. CNEL noise levels for the receptor locations for Baseline 2009, 2015and 2030 No Project Alternative are shown in Table 5-5.Table 5-5CNEL SUMMARY OF NO PROJECT ALTERNATIVE AT NOISE RECEPTOR SITES – YEARS2015 & 203020152030No Project Alt. No Project Alt.CNEL (dB)CNEL (dB)ReceptorSitesNameLand UseBaseline 2009CNEL (dB)1Airport Property EastAirport59.461.262.02Airport Property WestAirport55.257.057.83Triple Oak WayResidential50.952.853.84Cutrer WineryCommercial47.349.249.95Rio Ruso DrResidential44.646.347.26Windsor High SchoolSchool49.951.652.47Mitchell LnResidential47.849.650.38Trione CirResidential50.151.952.69Olivet RdResidential47.849.550.210Piner High SchoolSchool43.245.146.2SOURCE: MGA/L&B (2011)M-65
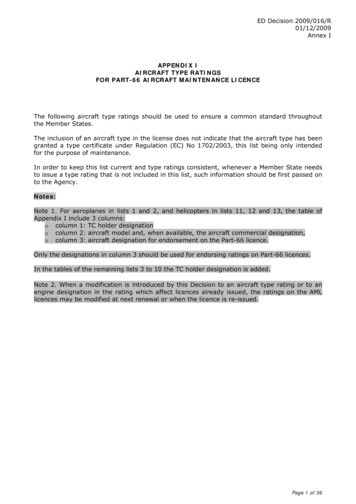
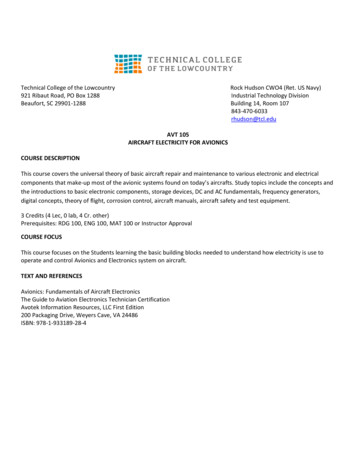
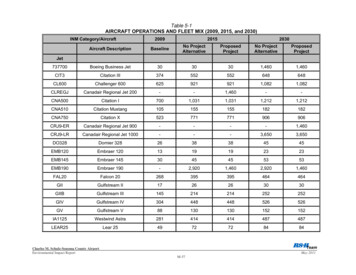
5.4NOISE IMPACTS OF THE PROPOSED PROJECTFuture noise exposure at the Airport for the construction of the proposed project elements ispresented in this section.5.4.1Constuction Noise ImpactsDuring the construction of the short-term project elements, noise from construction activitieswould occur. The closest noise-sensitive uses from any proposed construction location wouldbe residential areas to the north and west of the Airport. The general types of equipment thatmay be expected to be used include the following:Cement and Mortar MixerExcavatorsGraderOther General Industrial EquipmentPaverPaving EquipmentRollersRubber Tired DozersTractor Loader/BackhoeTrencherWater TruckConstruction equipment noise levels for this equipment and others are shown in Figure 5-3. Thistable shows the typical range of noise levels for common types of construction equipment. Thelevels shown are the A-weighted maximum noise level at a distance of 50 feet. Not all of thisequipment will be used for this project, but until engineering design is complete and constructionplans are developed it is not possible to positively identify equipment that will be used. It is notanticipated that pile drivers will be used for these projects. However, noise levels from a pointsource, such as construction equipment, decrease at the rate of approximately six dB with eachdoubling of distance from the source. For example, if a backhoe were 92 dBA at 50 feet, itwould be 86 dBA at 100 feet, 80 dBA at 200 feet, 74 dBA at 400 feet, etc.Of the equipment expected to be used on site, the noisiest will likely be the tractors, frontloaders and other heavy construction trucks. This equipment ranges from the mid 70‘s to highsin the range of 94 dBA at a distance of 50 feet. Jackhammers and drills to the extent they areuse have the highest maximum noise levels of about 98 dBA at a distance of 50 feet.There are 6 homes or groups of homes that are the closest homes to the project construction orstaging areas or construction haul routes and are as follows and shown in Figure 5-4:1. Home closest to south end of Runway 32, east of runway and located adjacent to apond, about 400 feet from perimeter road construction site, and 1000 feet from thetaxiway construction on the southwest side of the end of Runway 32. This home willbe acquired and removed between 2015 and 2030.2. Home southwest of end of Runway 32 is approximately 200 feet from the accessroad construction area and 700 feet from the taxiway construction ares located onthe southwest side of the south end of Runway 32. This home will be acquired andremoved between 2015 and 2030.M-66
3. Homes northeast of the end of Runway 14. The closest of these is approximately350 feet from the construction and staging area for the runway lengthening project.Most of these homes will be acquired and removed by 2015 (aread 3A in Figure 5-4),while the remaining homes are acquired by 2030 (these latter are the northern mostin the acquisition area, area 3B in Figure 5-4).4. Homes west of the airport on the west side of Windsor Road north of Silk Road.These homes are approximately 1600 feet from the runway and access roadconstruction. They are also about 85 feet from Windsor Road which will likely serveas a truck route during construction. Some of these homes front to Windsor Roadand some are side to Windsor Road. Those that front have the rear yards shieldedfrom the noise from Windsor Road.5. Homes on Sanders Road east of the homes to be acquired will be exposed toconstruction traffic noise using Sanders Road.6. The condominiums that are shared vacation homes on Shiloh Road at SkylaneBoulevard will be exposed to construction traffic noise from Shiloh Road. Thesehomes are considered like a hotel use in the County General Plan.The home listed as number 1 above is adjacent to the pond and will have short termconstruction noise impacts during the pond fill and construction of the access road. In the longterm this home is acquired.The home listed as number 2 above is 200 feet from access road construction and 700 feetfrom taxiway construction. This will be short term construction noise impacts. In the long termthis home will be acquired after the year 2015.The homes listed as number 3 above will largely be acquired by 2015 (area 3A). The ones onthe north end of the acquisition area will be acquired after 2015 (area 3B). The closest homesare approximately 350 feet from the staging and construction area.For the homes along Windsor Road (listed as area 4), the use of Windsor Road at night maycause short term construction noise impacts. At approximately 85 feet from the center of theroad, construction traffic may have noise levels in the range of 65 dBA to 89 dBA. Night use ofthis road will result in short term noise impacts. The construction on the runway extensions andaccess road will be 1600 feet or more from these homes. At this distance the construction noisehas the potential for disturbing surrounding land uses when equipment is operating in thevicinity. At this distance typical noise levels from equipment that will likely be used for most ofthe heavy construction work such as backhoes, tractors, front loaders, graders, jackhammersand trucks will be in the range of 40 to 68 dBA at these homes (based on a range of 70 to 98dBA at 50 feet and 6 dBA per doubling of distance dropoff rate to 1600 feet). In some cases,intervening landscaping or topography would further reduce noise at noise-sensitive locations.Areas 5 and 6 are located on Shiloh Road and Sanders Road and may be affected byconstruction traffic using those roads.Table 5-6 shows the maximum noise levels for each of these 6 receptor areas for bothconstruction activity and construction traffic.Any disturbance would be most noticeable during nighttime construction activities. There will be20 nights o night construction activity during Phase 1 and 15 nights during Phase 2. The longestnumber of consecutive nights of construction will be 10 nights. During phase 1 there will be nonight truck trips on to the construction site and during phase 2, there would be as many as 80M-67
trucks per night for a total of 3 nights. The night work would consist of:grading and paving at the north end where the two runways intersectgrading and paving of Taxiway D at the south end of Runway 14-32removal of Taxiway Z at the south end of Runway 14-32This night work is necessitated by the need to work within the runway safety area (RSA). Therunway must be closed when work occurs in the RSA.A summary of estimated noise levels in each of the 6 residential areas with potentialconstruction or construction traffic noise impacts is presented in Table 5-6 below:Table 5-6SUMMARY OF CONTRUCTION OR CONSTRUCTION TRAFFIC MAXIMUM NOISE LEVELSDistance, feetMaximum Noise Level, dBAConstructi ConstructiNightLocatio Construction HaulonJackhamme Constructi Constructinon AreasRoad**Equipmentrson 8189Yes4160085646889Yes56092Yes68589Yes*Locations 1, 2, and 3A are acquired in Phase 1.**Distance is to roadway centerline for the closest of the homes to the road.The County of Sonoma does not have a noise ordinance or an ordinance that limits the hours ofoperation. These issues on considered on a case by case basis. The County Noise Elementdoes have a Table of Maximum Allowable Exterior Noise Exposures for Non-TransportationNoise Sources as shown in Table 5-7. These limits are not identified for construction noise, butwill be used here for such as an example of how construction noise levels compare to theselimits. These are exterior noise levels, measured at the location of outdoor activity areas, not theproperty line. The outdoor activity area is usually the backyard for single family homes.M-68
Table 5-7MAXIMUM ALLOWABLE EXTERIOR NOISE EXPOSURES FOR NON-TRANSPORTATIONNOISE SOURCESDaytime (7 a.m. to 10Nighttime (10 p.m. to 7Hourly Noise Metric1, dBAp.m.)a.m.)L50 (30 minutes in any hour)5045L25 (15 minutes in any hour)5550L08 (5 minutes in any hour)6055L02 (1 minute in any hour)6560The sound level exceeded n% of the time in any hour. For example, the L50 is the value exceeded 50% of thetime or 30 minutes in any hour; this is the median noise level. The L02 is the sound level exceeded 1 minute inany hour.Source: Sonoma County General Plan Noise Element1The Noise Element table effectively limits daytime maximum noise levels to 65 dBA andnighttime maximum noise levels to 60 dBA. It is clear from Table 5-6 and Table 5-7 thatconstruction noise levels will greatly exceed the Noise Element Maximum Allowable ExteriorNoise Exposures for Non-Transportation Noise Sources at all 6 receptor locations. Generally,daytime construction noise is exempt from municipal noise ordinance limits. However, nightconstruction noise will be significant, although of limited duration.A common source of night construction noise complaints are back-up beepers. These beepersare an important safety feature. The requirements for these beepers is that they be heard abovebackground noise at a distance of 200 feet, or that a flag man be used in lieu of the back upbeeper. There is another alternative and that is the use of a backup beeper that adjusts itsvolume to the ambient noise level. This may be particularly useful at night when backgroundnoise levels are typically lower. Potential mitigation measures include the use of flagmen in lieuof back up beepers or requiring back-up beepers that adjust level to background noise.Temporary construction noise barriers, such as sound blankets may be of some use if they arehigh enough and have no flanking around the sides. This generally would require a continuous‗wall‘ of such blankets. While a minimum barrier of this type may provide from 5 to 10 dB ofnoise reduction, it is not practical along the haul roads as the necessary breaks for drivewayswould create holes in the barrier that would render them mostly ineffective.Short-Term Mitigation MeasureDevelop of construction noise control plan prior to initiation of construction. Night constructionwork should use back up beepers that adjust to ambient levels or use flag men as a substitutefor back up beepers. Unless night construction is required, all construction shall be limited to thehours of 7 a.m. to 5 p.m. on weekdays with no construction permitted on weekends or federalholidays. Even with this mitigation, construction noise will be a significant adverse short-termimpact.M-69
Figure 5-3TYPICAL AIRPORT CONSTRUCTION EQUIPMENT NOISE LEVELSM-70
IA1125 Westwind Astra 281 414 414 487 487 LEAR25 Lear 25 49 72 72 84 84 . the taxiway, runway, and flight track alignments would remain the same as existing conditions. Changes in noise exposure would be generally due to changes . 10 Piner High School School 43.2 45.1 46.2 _ SOURCE: MGA/L&B (2011) M-66 . 5.4 NOISE IMPACTS OF THE .