Transcription
European banks in the 21stcentury – are their businessmodels sustainable?LEA ZICCHINO, EMANUELE DE MEO,ANNALISA DE NICOLA, GIUSEPPE LUSIGNANI,FEDERICA ORSINIPrometeia5th EBA Policy Research Workshop“Competition in banking: implications forfinancial regulation and supervision”London, 28-29 November 2016
AgendaIntroductionRegulatory frameworkLiterature reviewData and methodology Dataset analysisIdentification of Bank Business ModelsIdentification of Peer GroupsPerformance analysisResultsConclusions and open issues for furtherresearchEuropean banks in the 21st century – are their business models sustainable?- 2
AgendaIntroductionRegulatory frameworkLiterature reviewData and methodology Dataset analysisIdentification of Bank Business ModelsIdentification of Peer GroupsPerformance analysisResultsConclusions and open issues for furtherresearchEuropean banks in the 21st century – are their business models sustainable?- 3
IntroductionThe motivation of our researchAssessing the characteristics of European Banks’ business models (BBMs) and thedrivers of their relative performanceWhat’s new in our paperProbabilistic identification of BBMs on a dataset of 77 European banksIdentification through Supervised Learning of homogeneous Peer Groups (PGs) ofBanks according to EBA categorisationQuantitative analysisEuropean banks in the 21st century – are their business models sustainable?- 4
Key resultsThree BBMs operating in Europe: Retail, Investment and Diversified banksRetail banks were the best performers before the onset of the Sovereign Debt Crisis;after 2010 business strategies hardly account for any significant difference inprofitabilityRetail banks with sizable cross-border activities showed slightly higher profitabilitylevels in most recent years (2014 – ’15)Economic growth, the yield curve and sovereign default risk are the main drivers ofRetail banks’ profitabilityCredit quality is the main bank-specific driver of banks’ RoAThere is some evidence that banks benefit from holding more capitalEuropean banks in the 21st century – are their business models sustainable?- 5
AgendaIntroductionRegulatory frameworkLiterature reviewData and methodology Dataset analysisIdentification of Bank Business ModelsIdentification of Peer GroupsPerformance analysisResultsConclusions and open issues for furtherresearchEuropean banks in the 21st century – are their business models sustainable?- 6
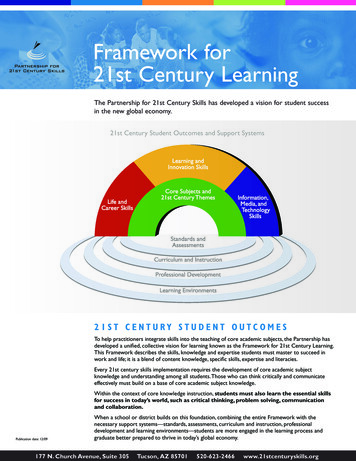
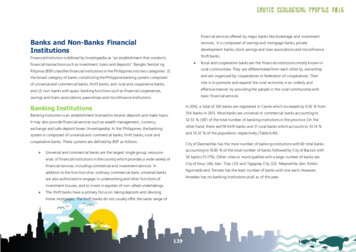
Regulatory frameworkOverview of the common SREP frameworkBusiness model analysis(BMA) is one of the fourevalution areas of theSREPBMA aims at assessingbank’s ability to achievesatisfactory profits in a12-month and at least 3year horizonCategorisation of institutionsAssessment ofinternalgovernanceand institutionwide controlsBusinessmodelanalysisAssessment ofrisk to capitalAssessment ofrisk to liquidity andfundingAssessment ofinherent riskand controlsAssessment ofinherent riskand controlsDetermination ofown fundsrequirements andstress testingDeterminationof liquidityrequirements &stress ssessmentOverall SREP assessmentSupervisory measuresQuantitative capitalmeasuresQuantitativeliquidity measuresOther supervisorymeasuresEarly intervention measuressource: EBA, guidelines on common procedure and methodologies, 19 December 2014European banks in the 21st century – are their business models sustainable?- 7
Regulatory frameworkSREP categorisation of institutionsCategory 1Global systemically important institutions (G-SIIs)Other systemically important institutions (O-SIIs)Category 2Other medium and large institutions thatOperate domestically or with sizable cross-border activitiesOperating in several business lines, including non-banking activitiesOffering credit and financial products to retail and corporate customersSpecialised institutions with significant market shares in their lines of businessCategory 3Other small to medium institutionsOperating domestically or with non-significant cross-border operationsOperating in a limited number of business linesOffering predominantly credit products to retail and corporate customersincluding non-banking activities with a limited number of financial productsSpecialised institutions with less significant market shares in their lines ofbusinessCategory 4Other institutionsEuropean banks in the 21st century – are their business models sustainable?- 8
AgendaIntroductionRegulatory frameworkLiterature reviewData and methodology Dataset analysisIdentification of Bank Business ModelsIdentification of Peer GroupsPerformance analysisResultsConclusions and open issues for furtherresearchEuropean banks in the 21st century – are their business models sustainable?- 9
Bank Business models identificationLiterature review (1/2)Roengptya et al (2014) 200 individual banks from 34 countriesCluster analysis on balance sheet ratios (loans, traded securities, deposits, wholesaledebt, interbank activity)Three Business models: Retail-funded; Wholesale funded; TradingAyadi and De Groen (2015) 2000 European banks and subsidiariesCluster analysis on balance sheet indicators (loans to customers and banks, tradingassets and derivatives, debt liabilities)Five Business models: Focused Retail, Diversified Retail (Type I and Type II);Wholesale Banks; Investment Banks.European banks in the 21st century – are their business models sustainable?- 10
Bank Business models identificationLiterature review (2/2)ECB (2016) 100 significant institutions supervised by the SSMCluster analysis based on: RWA (or size); net fee and commission income as a shareof operating income; customer funding and interbank funding as a share of totalliabilities; trading assets and domestic exposure as a share to total assetsSeven Bank Business Models: larger and more retail-oriented banks are generallyassociated with lower default riskBonaccorsi di Patti et al (2016) 100 European individual banks under the supervision of SSMIdentification approach relying on criteria concerning: specialization; size; corebusiness; share of cross border exposure.Eight Business models: Lending banks (high loan to assets); Diversified banks (largeand small banks with lower incidence of traditional banking); Network banks (hubs forsmall local banks); Public and Development banks (banks with a public interestpurpose).European banks in the 21st century – are their business models sustainable?- 11
AgendaIntroductionRegulatory frameworkLiterature reviewData and methodology Dataset analysisIdentification of Bank Business ModelsIdentification of Peer GroupsPerformance analysisResultsConclusions and open issues for furtherresearchEuropean banks in the 21st century – are their business models sustainable?- 12
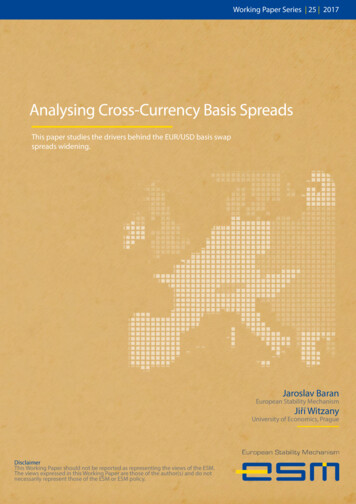
Data and methodologyDataset analysis77 banking groupsIT15DE15FR6ES6AT6GR4IE4GB4We used publicly consolidated data providedby SNL for 73 banking groups from 14countries in the Euro Area – accounting foraround 80% of the EMU’s total banking assets- plus 4 UK banking groupsAlmost 55% of SSM supervised banksThe sample covers the period from 2006 to2015For Peer Groups identification we used:FSB’s list of G-SIBsNL3BE3Operating income across different business lines,as reported in the segment performance analysisof banks’ annual reportsFI3Counterparties’ credit risk exposurePT3Data from EBA/ECB stress test: credit riskexposure in the home country and exposure of thebank to sectors other than retail and corporateCY2SI2LU1European banks in the 21st century – are their business models sustainable?- 13
Data and methodologyIdentification strategy of Bank Business Models and Peer GroupsWe assume no priorknowledge on the actualnumber and composition ofBBMs operating in Europeat an aggregate levelEBA guidelines provides acategorisation of institutionsin terms ofBank Business Modelsidentification withUnsupervised LearningSystemic relevanceDimensionCross-borderactivityComplexityAt a microeconomic level,we assume that knowledgeabout characteristics ofindividual banks is availableto the researcherCategory 1Peer Groups identificationwith Supervised LearningCategory 3Businessmodel 1Businessmodel 2Businessmodel 3Peer Group 1Peer Group 2 Category 2Category 4European banks in the 21st century – are their business models sustainable?- 14
Data and methodologyIdentification of Bank Business ModelsDeterministic (Hierarchical) clustering: progressively aggregate homogeneous groups of banksEuclidean distance to measure similarity of banks in terms of their balance sheetindicatorsWard’s method implemented by the Lance-Williams algorithmStopping rule (i.e. optimal number of BBMs) obtained from hypothesis testingconducted on 30 different test statistics specified on homogeneity within the clusterand heterogeneity among clustersProbabilistic (Fuzzy) clustering: estimation of the probability distribution that a bank belongs to the BBMidentified with deterministic clusteringFuzzy c-means algorithm (FCM) : minimization of the expected squared distance betweenobservations and cluster centers for a given degree of fuzziness (uncertainty)For each bank the FCM returns the probability of observing a BBM conditional to a specific bank,i.e. 𝑝 𝐵𝑀𝑖 𝐵𝑗We then derive the probability of observing a bank for a given BBM, i.e. 𝑝 𝐵𝑗 𝐵𝑀𝑖 𝑝𝐵𝑀𝑖 𝐵𝑗𝑝 𝐵𝑗𝑝 𝐵𝑀𝑖If FMC is performed on a yearly basis, the expected KPI of BBM i at time t is given by 𝐾𝑃𝐼𝑖,𝑡 𝑗 𝐾𝑃𝐼𝑗,𝑡 𝑝 𝐵𝑗 𝐵𝑀𝑖European banks in the 21st century – are their business models sustainable?- 15
Data and methodologyIdentification of Peer GroupsKey-nearest neighbour (KNN): identifies homogenous groups of banks for each BBMStarting point: a classification (set of labels) based on the categorization provided by EBAGuidelinesTraining banks: a set of banks with known membership to a specific PGTest banks: banks to be classifiedKNN classifies on the basis of a majority rule: a bank belongs to the PG containing the majorityof closer training peers according to a distance measure (Euclidean)Similarity computed in terms of:Business and organizational complexityCross border exposureSpecializationEuropean banks in the 21st century – are their business models sustainable?- 16
Data and methodologyIdentification of Peer GroupsSystemic relevanceAs defined by the Financial Stability BoardFSB’s list of G-SIBs as of November 2015Cross border exposureMeasured by the ratio of credit risk exposurein the home country as a percentage of totalcredit risk exposureData from the EBA/ECB stress testBusiness and Organizational ComplexityCombination of two Herfindal indices:HCBL index: concentration of operating income acrossdifferent business lines; data from banks’ annual reportHCCR index: concentration of counterparties’ creditrisk exposure as a percentage of total credit riskSpecializationMeasured by the exposure of the bank tosectors other than retail and corporateData from the EBA/ECB stress testEuropean banks in the 21st century – are their business models sustainable?- 17
Data and methodologyPeer Groups of Retail banksretail-Concentration measures:Counterparty credit riskBusiness lines’ operating incomehighlowretail noncomplexCounterparty credit risk exposure inthe home country as a % of totalcredit risk exposurehighretail non complexdomesticretail complexCounterparty credit risk exposure inthe home country as a % of totalcredit risk exposurelowretail non complexinternazionalizedhighretail complexdomesticlowretail complexinternazionalizedEuropean banks in the 21st century – are their business models sustainable?- 18
Data and methodologyPeer Groups of Diversified banksdiversifiedCredit risk exposure vs non retail andnon corporate counterparties as % oftotal credit risk exposurehighdiversified andspecializedlowdiversified andnon specializedEuropean banks in the 21st century – are their business models sustainable?- 19
Data and methodologyPerformance Analysis – panel data regressions𝐾𝑃𝐼i,t α βg Di,t,g γGDPc,t ϵi,tPooling panel regressions with BBM-specific dummyvariablesAimed at assessing relative performance of differentBBMs / PGs, after controlling for country-specificfactors (e.g. GDP growth)Estimated on two different subsamples: 2006-2010and 2011-2014gDynamic panel regressionsAimed at assessing the relevantfactors affecting BBMs and PGsperformanceControlling for common, countryand bank-specific factors𝐾𝑃𝐼i,t α μi ϕKPIi,t 1 βXi,t γK c,t δZt ϵi,tEuropean banks in the 21st century – are their business models sustainable?- 20
AgendaIntroductionRegulatory frameworkLiterature reviewData and methodology Dataset analysisIdentification of Bank Business ModelsIdentification of Peer GroupsPerformance analysisResultsConclusions and open issues for furtherresearchEuropean banks in the 21st century – are their business models sustainable?- 21
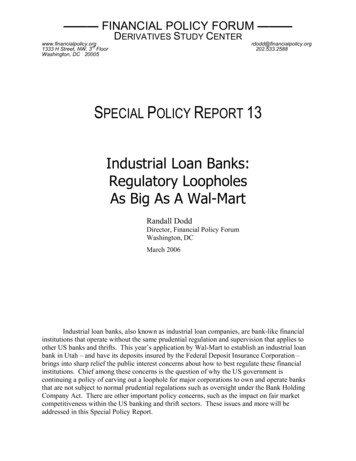
ResultsThree Bank Business Models identified in EuropeBank business models in 2015Share of BBMs across countries in 2015% of bank total assets100806040200Germany e: Prometeia calculations on balance sheet datanote: the radar plots the median value of each balance sheet indicator across all banks belonging to that cluster (BBMs), standardised across different BBMsEuropean banks in the 21st century – are their business models sustainable?- 22
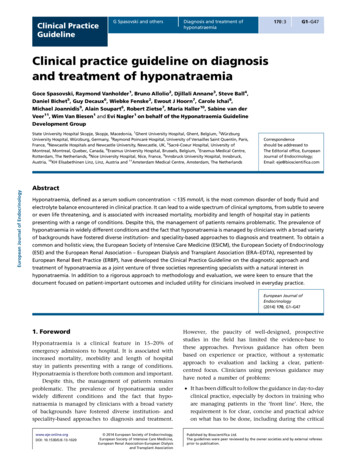
ResultsRetail banks are the prevailing BM in Italy throughout the sample periodBank business models identified for Italian banksUniCredit SpAMediobancaIntesa Sanpaolo SpABanca Popolare diMilano ScarlBanca Popolare diSondrio SCpABanca Popolare diVicenza SpABanca Carige SpACredito Valtellinese SCBanca Monte dei Paschidi Siena SpACredito Emiliano SpABanco Popolare SocietàCooperativaBanca popolaredell'Emilia Romagna SCUnione di BancheItaliane SpAIccrea Holding SpAVeneto Banca SpA2006invinvret2010retinvret2014retdivret2015 retdivret*prevailing over the period 2006-2015Note: each bank is attributed to the business model with the highest probability,Source: SNL, Prometeia calculations.European banks in the 21st century – are their business models sustainable?- 23
ResultsFuzzy clustering vs deterministic (hard) clustering - Italian 9Germany Francecluster with higher tcluster with higher probability result of hard KdiversifiedSource: SNL, Prometeia calculations.European banks in the 21st century – are their business models sustainable?- 24
ResultsKPI analysis: retail banks have suffered the most during the crisisROACost of riskOp.costs/tot.assets%pb%2015Source: SNL, Prometeia calculations.European banks in the 21st century – are their business models sustainable?- 25
ResultsRetail internationalized banks were the best performers in 2014-15(2014)Peer groups’ KPI (2015)costof riskReturn on assetsROAret SIBret SIBret NC INTret NC INTret NC DOMret NC DOMret CO INTret CO INTret CO DOMret CO DOMinv SIBinv SIBinv NSIBinv NSIBdiv SPdiv SPdiv NSdiv NS0.00.20.40.6per centper centop.expenses/tot.assetsbp0.8tier 1 ratio1.0per centper centSource: SNL, Prometeia calculations. Median valuesEuropean banks in the 21st century – are their business models sustainable?- 26
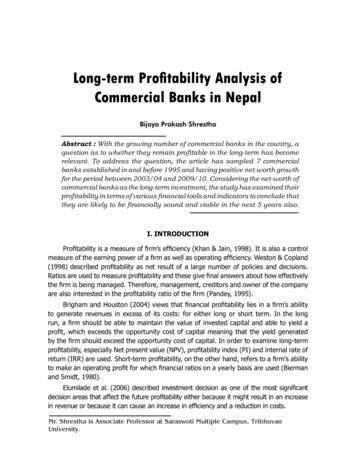
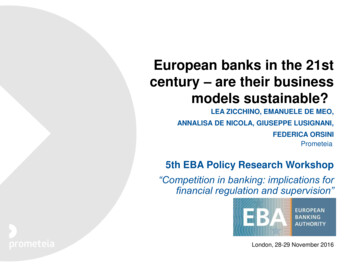
ResultsAfter 2010 business strategy does not account for differences in RoAsDifference in ROA across BBMs, pooled regressions*% values0.6Retail banks were the best performersbefore the financial crisis0.5After 2010, different business strategies,when considered at an aggregate level,hardly account for any significantdifference in banks’ profitability0.40.3Country factors (summarized byeconomic growth) appear sufficient inexplaining heterogeneity in banks’ RoAsafter 20100.20.1n.s.n.s.0.02006-2010 2011-2014 2006-2010 2011-2014retail vs diversified*Equation: RoAi,t α g βg Di,t,gretail vs investment γGDPc,t ϵi,t , where(t)RoAi isSource: SNL, Prometeia calculations.bank's i RoA in year t;(t)GDPc(t)Di,gis a vector of dummy variables assuming value equal to1 when bank i belongs to group g (that is, to a specific BBM/PG);is country 𝑐’s real GDP annual growth. The graph shows the differencesbetween the coefficients of the dummy variables associated to different BBMs, if significant.European banks in the 21st century – are their business models sustainable?- 27
ResultsThe macro-financial drivers of Retail banks’ RoAROA sensitivity to a contemporaneous increase of 1 p.p. of the specified variable - % valuesGDPEur3mSlopeSpreadNote: Signif. codes: 0 ‘***’ 0.001 ‘**’ 0.01 ‘*’ 0.05 ‘.’ 0.1 ‘ ’ 1Source: Prometeia calculations on SNL data. Dynamic panel regressions on business models ROA – 2014 data.Note: non retail banks include diversified and investment banks. Slope is defined as 10-year IRS – 3-month euribor, spread is calculated as 10-year government bondyield – 10-year IRS.European banks in the 21st century – are their business models sustainable?- 28
ResultsCounterintuitive relationship between credit quality and the yield curveCost of risk sensitivity to a contemporaneous increase of 1 p.p. of the specified variable – 2-3.1-12.4-38.2-20.7-83.0 ****-103.2-144.2-168.2Note: Signif. codes: 0 ‘***’ 0.001 ‘**’ 0.01 ‘*’ 0.05 ‘.’ 0.1 ‘ ’ 1Source: Prometeia calculations on SNL data. Dynamic panel regressions on business models ROA – 2014 data.Note: non retail banks include diversified and investment banks. Slope is defined as 10-year IRS – 3-month euribor, spread is calculated as 10-year government bondyield – 10-year IRS.European banks in the 21st century – are their business models sustainable?- 29
ResultsOperating costs do not seem to be related to any macro risk factorOp.cost/tot.assets sensitivity to a contemporaneous increase of 1 p.p. of the specified variable –% 79-0.089Note: Signif. codes: 0 ‘***’ 0.001 ‘**’ 0.01 ‘*’ 0.05 ‘.’ 0.1 ‘ ’ 1Source: Prometeia calculations on SNL data. Dynamic panel regressions on business models ROA – 2014 data.Note: non retail banks include diversified and investment banks. Slope is defined as 10-year IRS – 3-month euribor, spread is calculated as 10-year government bondyield – 10-year IRS.European banks in the 21st century – are their business models sustainable?- 30
AgendaIntroductionRegulatory frameworkLiterature reviewData and methodology Dataset analysisIdentification of Bank Business ModelsIdentification of Peer GroupsPerformance analysisResultsConclusions and open issues for furtherresearchEuropean banks in the 21st century – are their business models sustainable?- 31
Conclusions and open issues for further researchPossible applications of our methodologyBenchmarking analysis and performance assessmentPerformance comparison with other members of a bank’s peer groupUseful information on areas of strength and weakness in terms of profitability, risk, efficiency, andother performance indicatorsAssessment of the viability of business models to different macroeconomic and financial marketconditionsOpen issues for further researchModel validationTo test our PG classification across alternative supervised (machine) learning algorithmsForecastingTo develop a forecasting tool to assess the bank’s ability to generate adequate profitabilitycompared to its peers, and other business models/peer groups, as a function of the risk factorsidentified in our panel data frameworkEuropean banks in the 21st century – are their business models sustainable?- 32
PrometeiaBolognaVia Guglielmo Marconi,43 39 051 6480911italy@prometeia.comMilanoVia Brera, 18 39 02 80505845italy@prometeia.comLondraDashwood House 69 Old Broad StreetLondon EC2M 1QS 44 (0) 207 786 3525uk@prometeia.comIstanbulMetrocity İş Merkezi No. 171 A blok 3. KatBüyükdere Cad Mecidiyeköy 90 212 7090280–81–82turkey@prometeia.comBeirut2nd floor, Chebli Building,669 Ashrafieh 961 1 425206lebanon@prometeia.comMoscaul. Ilyinka, 4Capital Business Center Office pYoutubeprometeiaEuropean banks in the 21st century – are their business models sustainable?- 33
European banks in the 21st century -are their business models sustainable?- 5 Key results Three BBMs operating in Europe: Retail, Investment and Diversified banks Retail banks were the best performers before the onset of the Sovereign Debt Crisis; after 2010 business strategies hardly account for any significant difference in profitability