Transcription
Pay-Television In-Home Equipment: National Energy Consumption, SavingsPotential, and Policy Barriers and OpportunitiesGregg Hardy, Aaron Phillips, Debbie Driscoll, Philip Walters and Jeffrey Swofford,EcovaABSTRACTOne hundred million homes subscribe to pay-television in the U.S., requiringapproximately 240 million pay-television set-top boxes. The energy use, energy savingsopportunities and policy challenges of these devices is the primary focus of this paper. Wedeveloped a set-top box energy model using recent market and energy use data to estimatehistorical and future energy use. Both national and per-household energy use has increased overtime, primarily because of the growing number of set-top boxes per subscriber household. Nearly11 coal power plants are required in the U.S. to power today’s pay-television set-top boxes (33TWh/year). Per-household energy use has nearly tripled from 120 kWh a decade ago to almost325 kWh today, costing subscribers 4 billion/year. Fortunately, there are a variety of energysavings opportunities that align with the four primary variables that determine set-top box energyconsumption for a subscriber household: on mode power levels, sleep mode power levels, dutycycle, and network architecture. We estimate that the savings potential associated with theseopportunities is 30–50%. Characteristics of the pay-television industry present unique policychallenges and opportunities.IntroductionPay-television (i.e. “pay-TV”) set-top boxes allow subscribers to access video contentfrom distribution networks on their television. The main elements of these distribution networksare (1) regional or national headend facilities that receive video signals from content providersand splice-in local programming and advertisements and (2) land-based or satellite-basednetwork equipment that transports encrypted signals from these headends to pay-TV households.There are approximately 240 million pay-TV set-top boxes installed in 100 million U.S.subscriber households by cable, telecommunications (telco) and satellite service providers. U.S.pay-TV households have an average of 2.5 pay-TV set-top boxes to serve an average of threeTVs (SNL/Kagan 2012; Nielsen 2011). In this paper, we focus on set-top box energy use, energysavings opportunities and policy challenges and opportunities.This paper starts with a technical overview of the pay-TV content delivery system, whichinfluences set-top box energy use. It then presents a national set-top box energy use model usingrecent market data for stock and sales and energy use data from a variety of previous fieldmeasurement studies. We provide a brief comparison to other set-top box energy analyses andpresent a number of energy savings scenarios. Lastly, we identify several policy challenges andopportunities for reducing the energy use of set-top boxes and pay-TV content delivery. 2012 ACEEE Summer Study on Energy Efficiency in Buildings9-164
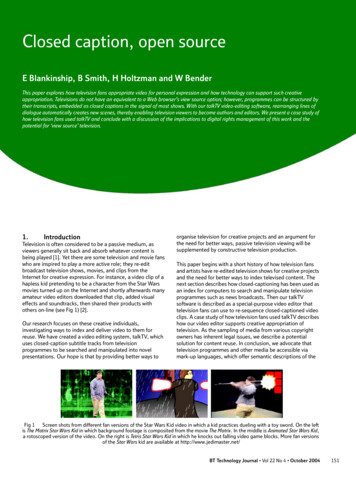
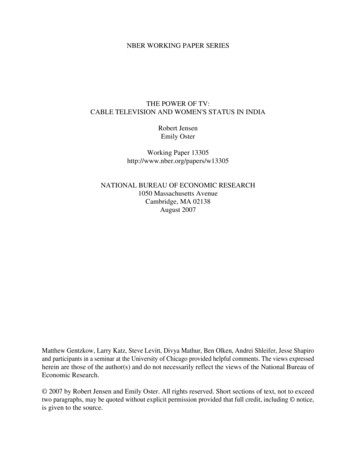
Technical BackgroundThe pay-TV content delivery system consists of a complex network of communicationschannels, network gear and edge devices, like set-top boxes, that deliver video content from TVcontent providers to subscribers. This section provides an overview of the three primary nationalcontent distribution networks then describes fiber-to-the-premises (FTTP) technology and inhome, multi-room set-top box networks. The three major types of pay-TV delivery systems arecable, satellite and Internet Protocol TV (IPTV) (Figure 1).Figure 1. Conceptual Diagram of Cable, Satellite and IPTV Pay-TV Delivery SystemsCableFor cable networks, content providers generally transmit television content via satellitelink to headend equipment, which adds local programming and commercials and sends the signalvia fiber optic cable to neighborhood nodes, which transmit content via coaxial cable toapproximately 250–500 subscriber households within a residential neighborhood. In a householdthat subscribes to multiple services, the coaxial cable runs through a cable splitter to both (1) abroadband access device like a cable modem or integrated access device (IAD), which providesinternet and voice over IP (VOIP) telephone service, and (2) pay-TV set-top boxes, which cantune both TV channel broadcasts and two-way internet protocol (IP) data flow to includesoftware and electronic program guide (EPG) updates and video-on-demand (VOD) movies andpay-per-view content streamed from media servers. The set-top boxes operate independently ofthe cable modem or IAD, which is not the case for IPTV. 2012 ACEEE Summer Study on Energy Efficiency in Buildings9-165
IPTVIPTV networks use existing broadband networks, typically those built by telcos, such asAT&T, to deliver content from a headend via fiber optic cable to a digital subscriber line accessmultiplexor (DSLAM), which acts like a cable node. DSLAMs transmit, in many cases, viatwisted-pair telephone cable to in-home IADs, which provide broadband access to thesubscriber’s computer network and provide IP-based video content to the home’s IPTV set-topboxes. These set-top boxes use less energy than either cable or satellite set-top boxes, but anIAD, which commonly uses 4–14 watts (EPA 2012), is a required part of the home set-top boxnetwork. The IAD’s role in an IPTV set-top box network adds little or no incremental energyconsumption for those homes who had subscribed to telco broadband before subscribing toIPTV.1SatelliteSatellite service providers procure content from content providers, and transmit it viasatellite and fiber link to national headend facilities. Satellite providers also set-up over-the-airantennas to receive free local broadcast content, which they transmit via fiber link to theirheadend facilities. These local channels are often broadcast regionally via spot beams, whichallow reuse of downlink frequencies. Satellite subscribers receive signals via roof or windowmounted satellite dishes, commonly 18” in diameter, that focus the satellite transmission onto anoutdoor unit (ODU), which commonly consists of three low-noise block down converters(LNBs), each of which consumes 1–2 watts to receive signals from a unique satellite position,and an embedded RF switch, which consumes 1–2 watts to package the signals from the LNBsonto a separate coaxial cable for each set-top box, up to a total of three (Dish) or four (DirecTV)set-top boxes. Thin-client, multi-room configurations require only one cable to feed content tothe digital video recorder (DVR) server. Dish set-top boxes share the ODU power load equallythrough the coaxial cables that feeds signals to them from the ODU; while an external powersupply powers the DirecTV ODU. Assuming 85% power supply efficiency, a three-LNB ODUuses about 9 watts continuously.2Fiber-To-The-Premises (FTTP) TechnologySome cable and IPTV networks use fiber optic cable to connect the node or DSLAM tothe home. These FTTP configurations, which support extensive channel line-ups and highbroadband throughput rates, often require an externally-mounted optical network terminal(ONT), which commonly draws a continuous 3–8 watts (EPA 2012), for both broadbandnetwork access and pay-TV reception. Customer premise equipment (CPE) in FTTP networkscommonly includes an IAD that supports broadband, telephone and TV (i.e. triple play) services.While ONTs represent incremental in-home energy consumption relative to copper-basednetworks, some studies argue that FTTP systems, also known as passive optical networks(PONs), consume considerably less energy than wired networks (Baliga et al. 2009).1280% of U.S. homes have broadband access (OECD 2012; U.S. Census 2011).ODUs are not included in our energy use model for this paper. 2012 ACEEE Summer Study on Energy Efficiency in Buildings9-166
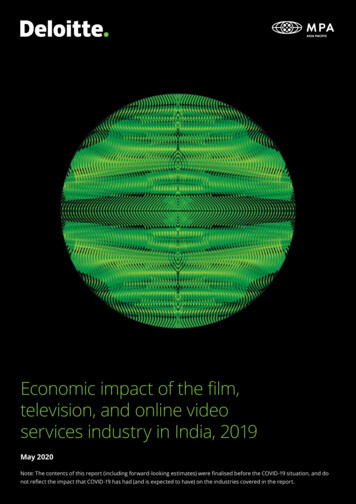
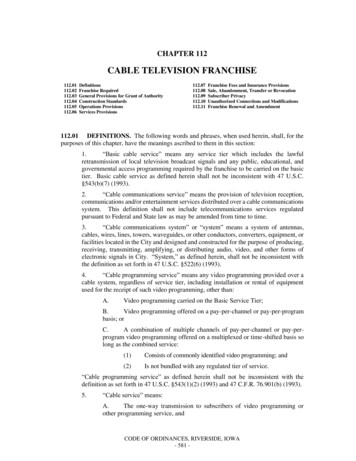
Multi-Room ConfigurationsFigure 2 depicts a multi-room configuration in which a DVR server, located in thedownstairs living space in this example, provides content for two client set-top boxes in theupstairs bedrooms. The subscriber can program and view recordings from any room using themulti-room configuration. In the simplest case, the multi-room server maintains a directconnection with the headend and has enough tuners, four in this scenario, to record one showwhile providing independent video streams to the primary TV and each of the thin-client set-topboxes, which support second and third TVs. This configuration uses much less energy and ismore convenient to program than one in which each TV has its own DVR. Current DirecTVDVRs have five tuners, can serve to clients or record up to five live shows at once, and can serverecorded content to up to 15 thin clients. In the rare case that a subscriber requires more than fivelive streams at once, s/he would need a second DVR server to feed a separate multi-roomnetwork. A second approach used by the cable industry involves providing hybrid clients thathave the ability to program and play content from the DVR server and that also have their owncable TV tuners that communicate directly with the headend. This configuration, in principle,makes the multi-room network more scalable because each client comes with the neededadditional tuner or tuners; however, since today’s cable tuners do not power-down effectively,hybrid clients have higher barriers to effective power management implementation.3 It remainsto be seen which approach will achieve lower energy consumption per household for comparablefunctionality. IPTV multi-room networks are similar except that they require a gateway device orIAD to provide the connection with the IPTV headend. Some multi-room networks have theability to stream content from the DVR server to IP devices such as internet-enabled TVs, bluray players, game consoles, iPads, computers, and smart phones. All of these technologies aredesigned with the goal of providing viewers with the content they want, when and where theywant it.Figure 2. Conceptual Diagram of a Multi-Room Set-Top Box Network3The National Cable and Telecommunications Association (NCTA) has publicly committed to develop technologiesthat enable more effective cable system power management. 2012 ACEEE Summer Study on Energy Efficiency in Buildings9-167
MethodologyWe developed a national set-top box energy use model using recent market data andenergy use data from a variety of previous field measurement studies. The analysis focused onpay-TV set-top boxes, which serve nearly 240 million of the approximately 350 million TVs inuse nationally (Urban, Tiefenbeck, & Roth 2011), 300 million of which are in pay-TVhouseholds. We focus on this subset of set-top boxes because they make-up approximately 90%of total energy consumption of all set-top boxes and because they consume near full-powerregardless of whether or not the subscriber is watching or recording a show or has pressed thepower button. Two-thirds of pay-TV energy consumption occurs when the subscriber is neitherwatching nor recording a show. National set-top box stock data used in our analysis is fromSNL/Kagan (2012) for 2006–2012. Pre-2006 stock values represent extrapolations ofSNL/Kagan (2012) and market assumptions used by NRDC (2011).Table 1. U.S. Pay-TV Set-Top Box Stock, Millions of Units, 2002–2012CableCable - IPCable - 227.291.323.3221201282.52.632.992.927.7239Sales values are calculated by multiplying the replacement rate by the set-top box stockof the previous year, then adding the net number of new boxes (i.e. growth in stock). We assumethe following replacement rates: 12.5% for cable, cable-IP and cable-DTAs, 20% for satellite,12.5% for telco set-top boxes. We use unit energy consumption (UEC) values from fieldmeasurement studies conducted for the Natural Resources Defense Council (NRDC 2011) andthe California Energy Commission’s Public Interest Energy Research (PIER) program (Porter,Moorefield, & May-Ostendorp 2006). We use duty cycle figures, 11.5 hours in on mode and 12.5hours in sleep mode, from Urban, Tiefenbeck, & Roth (2011). Using these data, we calculate thetotal energy use of pay-TV set-top boxes as a function of stock, power levels, and duty cycle.Table 2. Average Unit Energy Consumption of Stock, kWh, 2002–2012CableCable - IPSDSD-DVRHDHD-DVRClientHDDVRCable - 5231188308111170323 2012 ACEEE Summer Study on Energy Efficiency in 2819-168
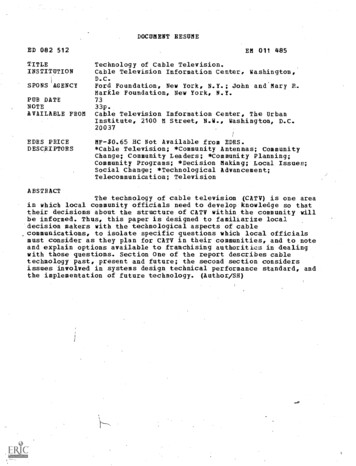
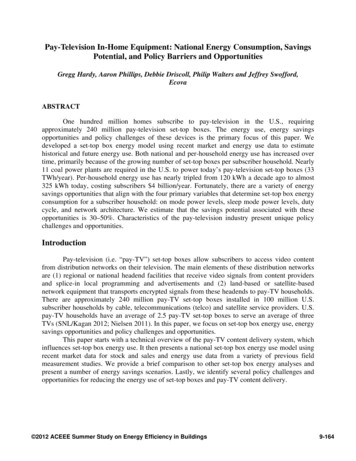
4139Annual Energy Use and Savings Potential EstimatesPay-TV set-top boxes use 33 TWh/year—equivalent to more than 11 coal power plants—costing subscribers 4 billion/year.4,5 Average pay-TV set-top box annual energy consumption(AEC) per household is up from about 120 kWh a decade ago to almost 325 kWh today, anincrease driven primarily by the growing number of set-top boxes per subscriber household.Today’s average pay-TV home pays about 40/year just to power set-top boxes. Figure 3 showsU.S. pay-TV set-top box energy consumption trends at the per-unit, per-household and nationallevels. Our results indicate that average UEC values for each device class have decreased inrecent years. However, pay-TV subscribers have upgraded to higher-power device classes (e.g.HD-DVR) over the same timeframe. Increases in the number of set-top boxes per home and thenumber of pay-TV households in the U.S. have driven up both household and national 004200620082010Unit and Household Energy Use(kWh)National Energy Use(number of power plants)Figure 3. U.S. Pay-TV Annual Energy Consumption, 2002–2012National Annual EnergyConsumptionAverage Annual EnergyConsumption per HouseholdAverage Annual Unit EnergyConsumption020124We use the Rosenfeld unit to calculate coal plant equivalency through this paper, for both energy use and energysavings. A Rosenfeld is the equivalent of displacing a 500 megwatt (MW) existing coal plant operating at a 70%capacity factor with 7% transmission and distribution (T&D) losses. Displacing such a plant for one year would save3 billion kWh/year at the meter and reduce emissions by 3 million metric tons of carbon dioxide (CO2) per year asdescribed in Koomey (2010).5We assume a national residential electricity price of 11.49 cents per kWh, based on EIA (2012). 2012 ACEEE Summer Study on Energy Efficiency in Buildings9-169
Comparison to Other StudiesTable 3 compares results from a number of previous set-top box energy use studies. Wefocus on the key differences between our results with those presented in the most recent analysis,conducted by Urban, Tiefenbeck, & Roth (2011). Urban, Tiefenbeck, & Roth (2011) assume lower satellite set-top box stock than inSNL/Kagan (2012) based on input from a satellite service provider. We use theunaltered stock estimate from SNL/Kagan (2012).Urban, Tiefenbeck, & Roth (2011) assume higher satellite stock power levels than wedo, likely because of different stock turnover assumptions or older box power levelassumptions.Table 3. Summary of Previous Studies and Energy Consumption CalculationsYearUnits (millions)Power (W)On SleepUEC (kWh/yr)AEC (TWh/yr)SourceCable2010 9319 1715514.4This study2010 8718 1715013.0Urban, Tiefenbeck, & Roth (2011)2008 52––1739.0Sanchez et al. (2010)2006 7716 1513410.0Roth & McKenney (2007)2003 3516 161404.9NRDC (2005)2003 ––23––Davis Energy Group (2004)2003 6523 22––Amann (2004)2000 4913 111035.0Rosen, Meier, & Zandelin (2001)Satellite2010 8918 1614613.0This study2010 7614 121128.5Urban, Tiefenbeck, & Roth (2011)2008 51––20610.5Sanchez et al. (2010)2006 7015 141299.0Roth & McKenney (2007)2003 32––––NRDC (2005)2003 ––16––Davis Energy Group (2004)2003 3218 17––Amann (2004)2000 1317 161401.9Rosen, Meier, & Zandelin (2001)Telco2010 1912 11991.9This study2010 1614 121151.8Urban, Tiefenbeck, & Roth (2011)2008 3––1640.5Sanchez et al. (2010)Source: Table was modified from Urban, Tiefenbeck, & Roth (2011) to include our analysis.Energy SavingsTo illustrate the magnitude of opportunities to reduce set-top box energy consumption,we break down today’s base case energy use by device category—DVR, receiver, client, andDTA—where IPTV set-top boxes are clients (Table 4). We then present a calculated savingsanalysis associated with a few scenarios, all grounded in the current number of pay-TVhouseholds and televisions served. 2012 ACEEE Summer Study on Energy Efficiency in Buildings9-170
Table 4. 2012 Base Case: Energy Use Estimates by Set-Top Box TypeDVRsReceiversClientsDTAsU.S. ere are many technologies and practices in discussion today with high technicalsavings potential. If we reduce sleep mode power levels for all set-top boxes to 5 watts,consistent with the stated goal of the cable industry (NCTA 2011), then we would save theequivalent of 4.2 coal power plants. We recognize that satellite and telco have not set such agoal.With a ubiquitous 5 watt sleep mode, each 1 hour reduction of on mode time would save0.3 coal power plants.6 The average U.S. household watches approximately 8–9 hours of TV perday (Nielsen 2011). Since multi-room DVRs must be on when recording shows or when thinclient set-top boxes are in use, it may be difficult to achieve average on mode times of less than11.5 hours. However, we should target less than 11.5 hours for non-DVR set-top boxes. Thereare several means to achieving improved duty cycles. Although many service providers programtheir set-top box remote controls to simultaneously power on and off both the set-top box and theTV at the press of a button, sometimes the set-top box and TV get out of synch such that the TVturns off when the set-top box turns on. Service providers could work with other consumerelectronics industry market actors to address this problem. One possible means for addressingthis issue is to update the High-Definition Multimedia Interface (HDMI) specification to requirea standard way for set-top boxes to know the power state of the TV. Today’s HDMI spec has anoptional means for doing this called Consumer Electronics Control (CEC) that manufacturershave implemented in proprietary ways.If we develop a scenario in which a) each of today’s roughly 100 million subscribersowns a DVR that uses 27 and 5 watts in on and sleep modes and b) all additional set-top boxesare thin-clients with power levels comparable to Apple TV (2.1 and 0.2 watts in on and sleep),then we would save the equivalent of 6 coal power plants relative to the base case even thoughwe have added DVR capability to tens of millions of households.It would save the equivalent of one coal power plant if satellite providers would autopower-down their DVRs to 5 watts.7 Whereas cable and telco providers can store rich programguide content in the cloud, satellite service providers cannot count on their subscribers havingbroadband access, so satellite providers continually update guide data on the hard drive,preventing DVR power down. One savings approach would be for satellite providers to offercloud guides to broadband connected clients. One industry representative estimated that 75% ofsubscribers had broadband and 20% of their set-top boxes were connected to broadband.Cable and telco systems might use less total energy if they streamed content from thecloud as opposed to storing it on local DVRs. This network DVR model would increase the6This does not apply to Cable-DTAs.Assuming a technical potential savings of converting today’s entire stock of satellite DVRs to devices with 5 wattsleep capability.7 2012 ACEEE Summer Study on Energy Efficiency in Buildings9-171
energy consumption of datacenter and network equipment while reducing in-home energyconsumption. Streaming content would involve a complex assessment of equipment utilizationand marginal vs. average energy consumption. To put this discussion into perspective, if wedivide the total energy consumed by the internet by the total volume of data transmitted, we getabout 2 kWh/GB (Taylor & Koomey 2008). Since a Netflix movie requires the transmission ofabout 1.5 GB of data, the average energy consumption associated with this data transmission isequivalent to running a 1,000 watt hair blow-dryer for 3 hours. Average energy consumption ishigh because the utilization of network equipment is generally just a few percentage points(Lanzisera, Nordman, & Brown 2010). With today’s always-on network equipment, it costssociety a lot of energy to have an internet but not much marginal energy to transmit additionaldata given that network equipment power levels do not scale with the rate of data transmitted.Commercial and residential network equipment uses 18 TWh/year on a national scale (Lanzisera,Nordman, & Brown 2010), far less than the 33 TWh/year used by today’s set-top boxes. It isclear that network gear that effectively scales power to throughput would save a significantamount of energy.Policy Challenges and OpportunitiesUnique characteristics of the pay-TV industry present several challenges for energyefficiency policymakers. First, large pay-TV service providers develop, install and manage theconfiguration of set-top box application software, which can determine how much energy a settop box consumes when deployed at the subscriber’s household. In many ways pay-TV serviceproviders do more specification definition, software development and device configuration thancomputer manufacturers like Dell do for laptops, which most computer OEMs source from turnkey hardware vendors like Compal, Quanta and Wistron. These vendors, known as originaldesign manufacturers (ODMs), design, verify, manufacture, and ship laptops and they providewarranty and service support on behalf of computer OEMs, which manage the brand, productmarketing and sales of laptop computers. By developing and in some cases installing set-top boxapplication software, large service providers act like manufacturers. They play a critical role indetermining how much energy set-top boxes consume, which can change over time as serviceproviders update software, change set-top box configuration settings, or offer new features thatalter usage patterns. This distinction presents a challenge for policymakers, who have historicallyaddressed device manufacturers and retailers with policy tools. Second, subscribers have littleinfluence over what set-top box they get. They can typically choose between one cable, twosatellite, and sometimes one telco service provider. Subscribers can then choose a subscriptionpackage, after which the service provider deploys either a refurbished, older set-top box orunused, new set-top box chosen by their procurement team. The consumer has little influenceover what set-top box is deployed.There are several implications associated with these two challenges. First, policymakersshould carefully evaluate whether or not to develop energy efficiency policies that regulate theservice provider instead of the set-top box manufacturer. This issue raises several questions, forexample how to include stand-alone set-top boxes like TiVo and over-the-top (OTT) videostreaming set-top boxes like Apple TV that are primarily sold through retail channels as opposedto deployed by a service provider. Second, electric utility program offices will find it difficult to 2012 ACEEE Summer Study on Energy Efficiency in Buildings9-172
develop traditional incentive programs because of the difficulty in attributing energy savings totheir efforts. This is difficult because large service providers make set-top box procurementdecisions on a national scale, so incentive dollars associated with regional efficiencyimprovements from one or even a few utility territories combined may not suffice to offset thecost to the service modifying its national-scale procurement or development decisions. Third, itis important—but difficult to accomplish with today’s policy tools—to verify that deployed settop boxes continue to meet minimum efficiency levels over time. Fourth, policymakers shouldkeep system-wide energy implications in mind when deploying device-level policy tools. TheU.S. Environmental Protection Agency (EPA) did this when they developed ENERGY STARspecification levels for multi-room DVRs. Fifth, policymakers should take a look at the globalpolicy and legal framework in place for the pay-TV industry. For example, policymakers shouldreview legal barriers to efficient network DVR implementation. Today’s interpretation ofcopyright law, which requires service providers to store individual copies of shows for eachsubscriber, increases the cost and energy consumption of network DVR implementations.Service providers would benefit from reduced capital depreciation and operational andmaintenance expenses resulting from a shift to network DVR. The dollar cost and associationgreenhouse gas emissions of hot-swapping a failed drive at a datacenter are much lower thandriving a van to a subscriber’s household to replace a failed DVR and bringing the unit back tothe shop for repair and redeployment. Moreover, cloud content storage and transmission likelydraws less marginal energy than DVR use, especially in an environment, like today’s, whereDVRs always draw near full power. The benefit of utilizing network DVRs is an important areafor future research.While there are many challenges, the pay-TV industry has several unique attributes thatcan lead to opportunities for policymakers and further research. Trained technicians have accessto homes, service providers have frequent communication with subscribers, and they have dataabout set-top box stock, replacement, and configuration. They also know when set-top boxes arepowered down, and they control the video distribution system. This creates several opportunities.First, the efficiency community could collaborate with service providers to understand theenergy consumption of customer premise equipment, including set-top boxes, network gear andauxiliary equipment like satellite dish electronics. Service providers could provide informationabout stock and configuration while adding features to set-top boxes that would enableparticipating subscribers to report usage data to researchers. Second, service providers couldwork with industry associations to develop and implement standards that would enable set-topboxes to know the power state of the TV they serve and of other connected consumer electronicsdevices in order to improve set-top box duty cycle. Service provider technicians could configurehome entertainment centers to take advantage of such capabilities and train subscribers what rolethey can play in reducing energy consumption. And third, service providers can work with theirinfrastructure and set-top box supply chains to develop new cloud video streaming and in-home,client-server architectures that provide exceptional viewing experiences with reduced greenhousegas emissions. 2012 ACEEE Summer Study on Energy Efficiency in Buildings9-173
ConclusionsWe developed a national set-top box energy use model using recent market and energy use datato estimate historical and future set-top box energy use. Both national and per-household energyuse have increased over time, primarily because of the growing number of set-top boxes persubscriber household. Nearly 11 coal power plants are required in the U.S. to power today’s payTV set-top boxes. Per-household energy use has nearly doubled from 150 kWh a decade ago toalmost 350 kWh today. Fortunately, it is possible in the near term to save energy cost effectivelyin four different ways: reducing on mode power levels, reducing sleep mode power levels,reducing the amount of time boxes spend in higher-power modes, and shifting where recordingand playback occur within the network. We estimate that the savings potential associated withthese opportunities is 30-50%, depending primarily on how effectively service providers developand deploy the technologies and practices necessary to achieve effective power scaling and tomove to more efficient video distribution architectures. Set top boxes have proven particularlychallenging to improve relative to other electronic products like televisions, computers, andpower supplies. The split financial incentives to save energy among manufacturers, serviceproviders, and final users create daunting market barriers to pursuing purely voluntary marketapproaches like labeling and utility rebates. Likewise, the rapid technological innovation innetworks threatens to overtake the secure content distribution models built by cable and satelliteservice providers over a period of decades. A rapid shift to more efficient boxes and means ofsecure data transfer would strand billions of dollars of their assets. However, we find thesechallenges surmountable with good program design, readily available information about productefficiency differences, and the integration of appropriately structured and targeted mandatoryefficiency standards. The value of the resulting energy savings may be small at the individualbox or household level, but it is enormous in total, and entirely worthy of continued pursuit bythe market transformation community.AcknowledgmentsA number of organizations and individuals contributed to the technical and policyunderstanding that forms the basis of this research. This paper is informed by work for clientsincluding the Natural Resources Defense Council, California in
The three major types of pay-TV delivery systems are cable, satellite and Internet Protocol TV (IPTV) (Figure 1). Figure 1. Conceptual Diagram of Cable, Satellite and IPTV Pay-TV Delivery Systems . AT&T, to deliver content from a headend via fiber optic cable to a digital subscriber line access multiplexor (DSLAM), which acts like a cable .