Transcription
fDOCUMENT RESUMEHE 030 776ED 416 730AUTHORTITLEPUB DATENOTEPUB TYPEEDRS PRICEDESCRIPTORSIDENTIFIERSChan, T. C.; Curran, Theresa; Deskin, CarolineEmployment Myths and Realities in Speech and LanguagePathology.1997-11-0022p.; Paper presented at the Annual Meeting of the GeorgiaEducational Research Association (22nd, Atlanta, GA,November 13-14, 1997).Speeches/Meeting Papers (150)Research (143)ReportsTests /Questionnaires (160)MF01/PC01 Plus Postage.Career Choice; Communication Disorders; ComparativeAnalysis; Compensation (Remuneration); *EmploymentCounselors; *Employment Opportunities; EmploymentProjections; *Graduate Students; Graduate Study; HigherEducation; *Job Satisfaction; *Occupational Information;Outcomes of Education; Speech Curriculum; VocationalAdjustmentLanguage Pathology; *Valdosta State University GAABSTRACTThis study compared the professional expectations ofgraduate students in speech and language pathology (SLP) with the employmentrealities offered by the profession. A total of 89 graduate students enrolledin the SLP program at Valdosta State University (VSU) in Georgia during1995-97 completed a seven-item questionnaire on employment prospects. Theresults were compared to national data on employment prospects and attitudes.The study found that SLP students at VSU indicated an overwhelming interestin working in the South, and that students expected an average annual salaryapproximately 6,000 more than the national average for entry-level positionsin the profession. In job satisfaction comparisons, VSU students placed theiremphasis on job nature and efficiency aspects of future employment, comparedto the national preferences of friendly co-workers, helpful co-workers, andfriendly supervision. It was recommended that SLP program planners encouragestudents to have a somewhat more realistic idea of their future profession.An appendix provides statistical tables and a copy of the *Reproductions supplied by EDRS are the best that can be made**from the original ***************************************
Employment Myths1Running head: EMPLOYMENT MYTHS AND REALITIESEmployment Myths and Realitiesin Speech and Language PathologyDr. T. C. ChanAssociate ProfessorGeorgia Southern UniversityTheresa CurranSpeech and Language PathologistNova Care, FloridaCaroline DeskinGraduate AssistantValdosta State University"PERMISSION TO REPRODUCE THISMATERIAL HAS BEEN GRANTED BYU.S. DEPARTMENT OF EDUCATIONOffice of Educational Research and ImprovementTak Cheung ChanEDUCATIONAL RESOURCES INFORMATIONCENTER (ERIC)f7/This document has been reproduced asreceived from the person or organizationoriginating it.1:1 Minor changes have been made toimprove reproduction quality.TO THE EDUCATIONAL RESOURCESINFORMATION CENTER (ERIC)."Points of view or opinions stated in thisdocument do not necessarily representofficial OERI position or policy.A research paper presented to the Annual Conference of the Georgia EducationalResearch Association, Atlanta, Georgia, November 13-14, 1997.BEST COPY AVAILABLE2
Employment Myths2Employment Myths and Realitiesin Speech and Language PathologyMany students enrolled in educational programs have little knowledge of the realities ofthe professional field. Their focus in school is mainly on academics. Many of them are shockedwhen they finally leave school and have to face the real world which is quite different from theirexpectations.The purpose of this study is to compare the professional expectations of graduate studentsin the field of speech and language pathology (SLP) with the employment realities offered by theprofession. Although extensive research has been devoted to examining the opportunitiesavailable within the field of speech and language pathology, little documentation has been foundconcerning expectations of prospective professionals within the profession. Therefore, theeducational significance of this investigation is to assist the graduate clinicians in arriving at morerealistic career expectations.Research QuestionHow are the expectations different from the reported realities in the employment trendsamong speech and language pathology graduate students at Valdosta State University?Specifically, this study is designed to seek answers for the following questions:(1) Is there a significant difference between the students' expectations and the realities inSLP employment setting?(2) Is there a significant difference between the students' expectations and the realities inSLP length of service?3
Employment Myths3(3) Is there a significant difference between the students' expectations and the realities inSLP client population?(4) Is there a significant difference between the students' expectations and the realities inSLP geographical serving areas?(5) Is there a significant difference between the students' expectations and the realities inthe caseload percentage of SLP disorder/diagnosis?(6) Is there a significant difference between the students' expectations and the realities inthe basic annual salary of SLP?(7) Are the job satisfaction factors of SLP realities different from those of the SLPexpectations?Definition of TermsSpeech and Language Pathology (SLP). Speech and language pathology is the study ofspeech, language, and voice disorders for the purposes of diagnosis and treatment.Speech and Language Pathologist. A speech and language pathologist is an individual witha degree and/or certification in speech and language pathology who is qualified to diagnosespeech, language, and voice disorders and to prescribe and implement therapeutic measures.American Speech and Hearing Association (ASHA). ASHA is a national professionalorganization in the study of speech, language and hearing pathology.Employment settings. Employment setting in this study includes hospital, public school,residential health care facility, non-residential health care facility and private practice.Employment realities. Employment realities refer to the latest available data on the actualhappenings in the SLP profession. In this study, employment setting, length of service, client
Employment Myths4population, geographical areas, caseloads of disorder/diagnosis, salaries and job satisfactionfactors have been identified as items of interest.Graduate student expectations. For the convenience of comparison, the same seven areasexamined in the employment realities are also listed as survey items of graduate studentexpectations.Review of Related LiteratureStudies related to specific comparisons between the employment opportunities andexpectations of graduate students in the field of speech and language pathology were not found. Anumber of studies have been conducted to identify the current employment trends within the field.The focus of such studies included: locale, employment setting, population, salary, and jobsatisfaction.LocaleA survey by Bello (1994) disclosed that the majority of SLP professionals were employedin the South, followed by the Midwest, the West and the Northeast. The state with the greatestnumber of certified speech and language pathologists per 100,000 residents was New Mexico,followed by Vermont and Connecticut. The state with the least was Alabama, followed by SouthCarolina and Mississippi.Employment settingAccording to the Omnibus Survey (Slater, 1995a), more than half (53%) of the speech andlanguage pathologists identified the public school as their primary employment facility. Hospitalsrepresented the next largest employer at 14%, followed by residential health care facilities (12%)and nonresidential facilities (11.5%). Those in private practice comprised 4% of those surveyed.5
Employment Myths5PopulationThe Omnibus Survey (Slater, 1995a) revealed that the majority of speech-languagepathologists (33.5%) worked with the 6 to 11 age group, followed by the 65 to 84 (21.7%) and 3to 5 (20.9%) age groups. The survey respondents reported an average caseload of 41 individuals.In addition, the most frequent communication disorder treated was childhood language disorders(26% of caseload) followed by articulation (25.5%) and dysphagia (14%). This was in agreementwith the results of a previous ASHA survey (Slater, 1992).SalarySlater (1995b) conducted a survey on the median basic annual salaries of certified speech-language pathologists. The starting salary for speech-language pathologists on an academic yearbasis was 27,520 and 34,000 on a calendar year basis. The highest per academic year salary( 46,000) was offered in the Northeast whereas the highest per calendar year salary ( 42,765)was offered in the West.Job satisfactionPezzei and Oratio (1991) studied job satisfaction in the SLP profession and found thatmore speech and language pathologists employed in health care settings were dissatisfied withtheir employment than those who worked in schools or private practice. Having friendly coworkers was the strongest predictor of job satisfaction. Other important facets of employmentincluded having enough help to get the job done and working with a friendly supervisor.SummaryThe review of related literature provided a profile of the employment trends within theprofession of speech and language pathology. As a summary of the literature reports, a typical6
Employment Myths6speech and language pathologist works in the public school system, resides in the south and dealsmostly with childhood language disorders. Her annual salary for the academic year (9 months) is 27,500 and the variable that most effected job satisfaction was working in the company offriendly co-workers. This profile proved useful when devising an instrument to measure studentexpectations.HypothesesNondirectional HypothesisBased on the research questions, the hypotheses of this study are derived in the following:(1) There is a significant difference between the students' expectations and the realities in SLPemployment setting.(2) There is a significant difference between the students' expectations and the realities in SLPlength of service.(3) There is a significant difference between the students' expectations and the realities in SLPclient population.(4) There is a significant difference between the students' expectations and the realities in SLPgeographical serving areas.(5) There is a significant difference between the students' expectations and the realities in thecaseload percentage of SLP disorder/diagnosis.(6) There is a significant difference between the students' expectations and the realities in thebasic annual salary of SLP.(7) The job satisfaction factors of SLP realities are different from those of the SLPexpectations.7
Employment MythsNull Hypotheses:Based on the research hypotheses, the null hypotheses of this study are listed in thefollowing:(1) There is not a significant difference between the students' expectations and the realities inSLP employment setting.(2) There is not a significant difference between the students' expectations and the realities inSLP length of service.(3) There is not a significant difference between the students' expectations and the realities inSLP client population.(4) There is not a significant difference between the students' expectations and the realities inSLP geographical serving areas.(5) There is not a significant difference between the students' expectations and the realities inthe caseload percentage of SLP disorder/diagnosis.(6) There is not a significant difference between the students' expectations and the realities inthe basic annual salary of SLP.(7) The job satisfaction factors of SLP realities are not different from those of the SLPexpectations.Methods and ProceduresSubjectsThis study involved the graduate students of the SLP Program at Valdosta StateUniversity (VSU) in the academic years of 1995-96 and 1996-97. The enrollment of graduatestudents in The Department of Special Education at Valdosta State University for a degree in7
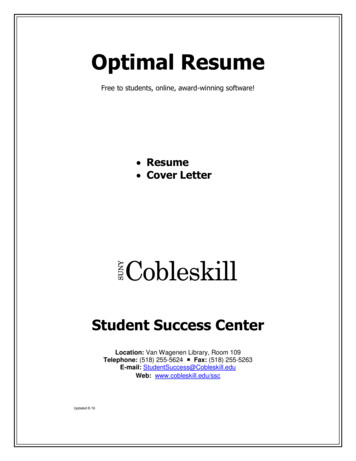
Employment Myths8Speech and Language Pathology averages about 70 students a year. The majority of the studentsare female (97%) and Caucasian (80%). This statistic is consistent with their representation in theprofession. A total of 89 students participated in the survey. 49 of them were enrolled in theWinter Quarter and 40 enrolled in the Summer Quarter of 1996.InstrumentationSince no previous instrument was devised to survey the SLP student expectations, theresearchers came up with an instrument of their own. The instrument consists of seven questionsrelating to employment setting, length of service, client population, geographical areas, caseloadsof disorder/diagnosis, salaries and job satisfaction. To facilitate comparison with the realities,three previous reality surveys in SLP (Slater, 1995a, Slater, 1995b and Pezzi & Oratio, 1991)were brought in as references to design the survey questionnaire. The format and language of thequestions in this survey are straight forward and have been written to reflect the same themes asthose of Slater and Pezzi & Oratio. The instrument was pilot tested with graduate students andrevision was made to accommodate valid responses for research.Procedures and Analyses.The SLP graduate students of 1995-96 and 1996-97 were selected to participate in thisstudy. Surveys were conducted in the Winter Quarter of 1996 and the Summer Quarter of 1996with 19 and 40 responses respectively. Therefore, a total of 89 SLP graduate students in VSUwere actually involved in the study.The student expectation data of employment setting, length of service, client population,geographical areas, and disorder/diagnosis caseloads were compared to reality data stated in theSlater (1995a) report. Chi Square statistical procedure was used for the analyses. The result of9
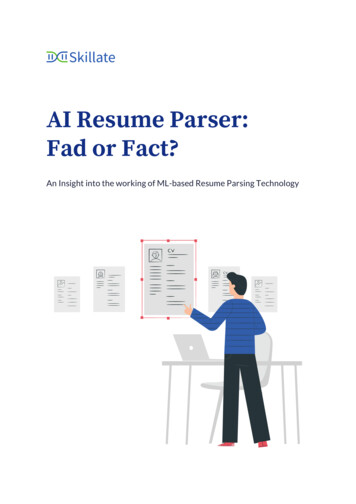
Employment Myths9the analyses would indicate if the student expectations differed significantly from the observedrealities. All Chi Square testings were statistically established at .05 level of significance.Information concerning SLP salary realities was found in the Slater (1995b) report whichwas used as a basis for comparing to student salary expectations. A statistical t-test was used tomeasure the reality and expectation differences at .05 significance level.For job satisfaction, student expectation data were compared to reality data supplied byPezzi and Oratio in the 1991 research findings. Because of the scale difference between the twosets of data, the employment of any statistically procedure for comparison is inappropriate. It wasdecided that the preferences of job satisfaction factors could be determined by examining thefrequencies of the two sets of data.FindingsAs a result of the use of Chi Square method of analyses and the t-test procedure, the datacollected in this study were statistically analyzed. The findings of this study were displayed in thefollowing:(1) Employment setting:The student expectation data were compared to the observed reality data in employmentsetting. A Chi Square value of 12.09 with 5 degrees of freedom was significant at .05 level (seeTable 2). Substantial differences were found in two categories: hospital and school. The realitydata showed 33.7% higher than the expectation data in hospital and 43.2% lower than theexpectation data in school (see Table 1).10
Employment Myths10(2) Length of Service:The three categories of length of service were examined in terms of student expectationsand observed realities by using Chi Square method of analysis. Statistics in Table 2 indicated thata Chi Square value of 5.355 with 2 degrees of freedom was not significant at .05 level. However,the expectation data showed substantial gain over the reality data in calendar year category butloss over the reality data in the school year category (see Table 1).(3) Client population:Table 2 showed the result of a Chi Square test comparing the student expectations with theobserved realities in seven categories of client population. The Chi Square value of 2.883 at 6degrees of freedom did not support any significant findings at .05 level. Nevertheless, substantialdifferences were observed in at least two categories. The expectation data were 13.8% lowerthan the reality data in the 6-11 year old but were 21.5% higher than the reality data in the 22-64year old (see Table 1).(4) Geographical areas:A Chi Square test was performed to see if there was any significant difference between thestudent expectations and the realities in the choice of geographical areas. The Chi Square valueof 280.139 indicated the difference to be highly significant (see Table 2). This was mostly causedby the concentrated preference of the student expectations towards working in the South (seeTable 1).(5) Caseloads of disorder/diagnosis:Twelve categories of SLP disorder/diagnosis were involved in the percentage comparisonbetween the student expectations and the realities. The result of the Chi Square analysis showed a11
Employment Myths11non-significant Chi Square value of 13.399 with 11 degrees of freedom at .05 level (see Table 2).The only prominent difference was observed in childhood language disorders in favor of thereality data (see Table 1).(6) Salary:The student salary expectations were compared with the salaries in reality. A t-test wasemployed to analyze the difference. The result of the test yielded a t-value of 4.02 which was notsignificant at the .05 level ( See Table 3), even though the expectation data were higher in bothcategories of comparison (see Table 1).(7) Job satisfaction:An examination of the Summary of All Statistical Testings (Table 1) showed that friendlyco-workers, helpful co-workers and friendly supervisor were the three most important jobsatisfaction factors according to the reality data whereas the expectation data indicatedchallenging work, interesting work and enough help to get the job done as most important jobsatisfaction factors.ConclusionThe evidence generated by this study, though not conclusive, have lent support to thefollowing statements:(1) Student expectations are significantly different from the realities in employment setting,geographical areas and job satisfaction in the SLP program of Valdosta State University.(2) Student expectations are not significantly different from the realities in the length ofservice, client population, disorder/diagnosis caseloads and salary in the SLP program of ValdostaState University.12
Employment Myths12Conclusions can be drawn in each of the seven areas of comparison with reference to thenull hypotheses:(1) Employment setting:Since significant difference was found between the student expectations and realities inemployment setting at .05 level, the null hypothesis, "There is not a significant difference betweenthe students' expectations and the realities in SLP employment setting." is rejected.(2) Length of Service:The null hypothesis, "There is not a significant difference between the students'expectations and the realities in SLP length of service" is accepted because the Chi Squareanalysis did not yield any significant result at .05 level.(3) Client population:The Chi Square analysis did not result in any significant difference between the studentexpectations and the realities at .05 level. This leads to the acceptance of the null hypothesis,"There is not a significant difference between the students' expectations and the realities inSLP client population."(4) Geographical areas:"There is not a significant difference between the students' expectations and the realities inSLP geographical serving areas." is the null hypothesis rejected at the .05 levelbecause a significant difference was found in the Chi Square analysis.(5) Caseloads of SLP disorder/diagnosis:The difference between the student expectations and the realities was examined by ChiSquare analysis yielding a non-significant finding in support of the null hypothesis,"There is not a13
Employment Myths13significant difference between the students' expectations and the realities in the caseloadpercentage of SLP disorder/diagnosis."(6) Salary:The salary difference between the student expectations and the realities was analyzed by thet-test procedure indicating a non-significant t-value at .05 level. The null hypothesis,"There is nota significant difference between the students' expectations and the realities in the basic annualsalary of SLP" is accepted.(7) Job satisfaction:Descriptive statistics have displayed the students' choice of "challenging work", "interestingwork" and "enough help to get the job done" as the most important factor to job satisfaction.This is totally different from the three factors shown in realities: "friendly co-workers", "helpfulco-workers" and "friendly supervisor". Rejection or acceptance of null hypothesis is notnecessary since no statistical analysis was performed.DiscussionIn examining the findings of this study, the following interesting points drew the attention ofthe researchers:(1) SLP students in Valdosta State University indicated an overwhelming interest in workingin the south. It would be really interesting to see if similar regional preferences be taken by SLPstudents towards their own region in the north, mid-west and the west.(2) The findings in this study indicated that VSU students expected an average annual salary tobe 6,000 more than the national average. At the same time, most of the students also chose towork in hospitals which pay substantially higher than schools. When all these pieces of14
Employment Myths14information are put together, it is easy to misunderstand the students' tendency towards placingeconomic benefit as their top priority.(3) In job satisfaction comparison, the national preferences of "friendly co-workers". "helpfulco-workers" and "friendly supervision" point to a culture of employer-employee cooperation andcollaboration. On the other hand, VSU students placed their emphasis on the job nature andefficiency aspects of future employment. The difference in viewpoints could be traced back to thenational survey which included both veteran and beginning pathologists. Quite the contrary, allthe SLP students in this study were beginners who had basically limited practical fieldexperiences.RecommendationsThis comparative study of SLP student expectations and realities have indicated significantdifferences in three of the seven analyses. However, in some of the non-significant comparisons,substantial differences were obvious. It is important that SLP students be knowledgeable of thecurrent status of the SLP profession so that they will be professionally prepared to face thechallenges of reality. It is recommended that the Speech and Language Pathology programplanners continue to work on encouraging students to update their files of current happenings inSpeech and Language Pathology.Need for Further Research(1) A limitation of this study was to compare Georgia data with national data and makereasonable sense out of it. An involvement of the same study with more states will allow a morepanoramic view of the whole picture.15
Employment Myths15(2) Another equal status study will be to compare the deviations of SLP student expectationsand realities between states. The causes of deviations could also be analyzed.(3) It is also interesting to examine the size of the SLP graduate programs as a factor thatcontributes to the deviation of student expectations and realities.(4) This is a very initial study of the SLP student expectations and realities. The researchdesign has been kept simple and straight forward. As the study continues to go more indepth, amore sophisticated research design needs to be structured. In addition, the measuring instrumentneeds to be revised to reflect more of the same format as the national survey.16
Employment MythsReferencesBello, J. M. (1994). Speech-language pathologists and audiologists: How many and where?ASHA, 36(12), 42-43.Crais, E. R. & Leonard, C. R. (1990). PL 99-457: Are speech-language pathologistsprepared for the challenge? ASHA. 32(4), 57-61.Fein, D. F. & Snyder, N. 0. (1983). Alternative estimates of the supply of speechlanguage-hearing personnel. Rockville, MD: American Speech-Language-HearingAssociation.Pezzi, C. & Oratio, A. R. (1991). A multivariate analysis of the job satisfaction of publicschool speech-language pathologists. Language, Speech, and Hearing Services in Schools,2 2 ( 3 ) 139-146.Slater, S. (1992). Portrait of the professions. AS:U3,1(8), 61-65.Slater, S. (1995a). 1995 Omnibus Survey Results. Rockville, MD: American SpeechLanguage-Hearing Association.Slater, S. (1995b). 1995 Salary Report. Rockville, MD: American Speech-LanguageHearing Association.St. Louis, K.O. & Durrenberger, C.H. (1993). What communication disorders doexperienced clinicians prefer to manage? ASHA, 35(12), 23-31.Steckol, K. F. & Cunningham, D. R. (1993). Practitioners speak out. ASHA, 35(4), 4043.1716
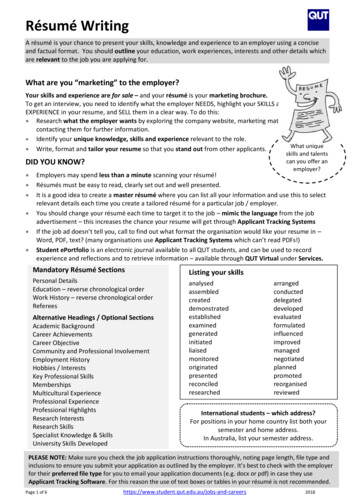
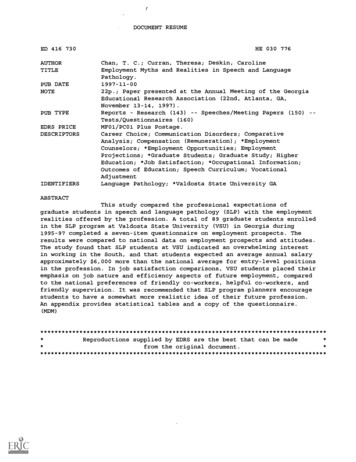
Employment MythsAppendices* Table 1Summary of All Statistical Testings* Table 2Summary of Chi-Square Analyses* Table 3Summary oft -test analysis* Table 4Descriptive Statistics* SLP Graduate Student Questionnaire1817
Employment MythsSpeech-Language-Pathology Graduate Student Survey, Valdosta State University, GeorgiaSummary of all statistical testingsTable 14.111.611.52.33.2Expectation(%) Test Values54.844.80.4Chi .419.75.35.330.313.62.88324.530.719.625.27 (A)7 (B)7 (C)7 (D)7 (E)7 (F)7 (G)7 (H)7 (I)7 (J)7 (K)7 (L)7 (M)7 (N)7 '(0)Realties(point) s:17.5.4.916.89.01.018.9' Shaded areas indicate the students'.priority preferences.* Bold typed statistics indicate areas ofsignificant differences at .05 level' Because of a difference in the data scale,no statistical comparison was performedin Question 7.4.99.02.02.83.59.813.39919Test Value4.02280.13912.48.3.32333420002.396.60.0Chi Square5 (A)5 (B)5 (C)5 (D)5 (E)5 (F)5 (G)5 (H)5 (I)5 (J)5 (K)5 (L)2752034000t-test77.516.95.6Chi Square4 (A)4 (B)4 (C)4 (D)Expectation ( )12.09Chi Square3 (A)3 (B)3 (C)3 (D)3 (E)3 (F)3 (G)Realities ( )6 (A)6 (B)23.657.34.57.92.24.5Chi Square2 (A)2 (B)2 (C)Questions18BEST COPY AVAILABLE
Employment MythsTable 2Questions12345Table 3EX6 -RE6Table 4Summary of Chi-Square AnalysesTest Test (Paired Samples)MeanS. D.tdfSig. escriptive StatisticsMinimumNEX1Sig. 084582.05219
Employment Myths20SLESzlii:OLIATESUIDENTAILIESTIMNAIREThis is a survey to gather information regarding the professional expectations of graduatestudents in speech-language pathology as part of an educational research project. Yourassistance is greatly appreciated.Please read each question carefully and circle your response. Answer each question basedon your employment plans. Unless otherwise indicated, please choose only one answer.Date you plan to graduate:Questions:1.2.What setting do you plan to work in:A. SchoolB. HospitalD. Nonresidential health care facilityE. Private practiceC. Residential health care facilityF. OtherIn what capacity do you expect to be employed:A. Full-time (calendar year)B. 9-10 months (school year)C. Part-time3.Which age population do you plan to work with:A. Birth- 2 yearsB. 3-5 yearsC. 6-11 yearsD. 12-17 years4.E. 18-21 yearsF. 22-64 yearsG. 65 and olderWhich area of the country do you plan to work in:A. NortheastB. SouthC. WestD. Midwest21
Employment Myths5.21Which disorder/diagnosis do you think will comprise the majority of your caseload:A. AphasiaB. ApraxiaC. Articulation/phonological disordersD. Degenerative neurological disordersE. Disorders resulting from autismF. Disorders resulting from TBIG. DysarthriaH. DysphagiaI.Fluency disordersJ. Hearing disordersK. Voice disordersL. Other childhood language disorders6.Identify the basic annual salary you expect to receive in your professional employment(after attaining your Certificate of Clinical Competency):7.Number (in order of most important to least important) the three factors you feel willhave the greatest bearing on your professional job satisfaction:A. Friendly co-workersB. Helpful co-workersC. Friendly supervisorD. Clearly defined responsibilitiesE. Challenging workF. Good fringe benefitsG. Fair hiring of personal for advanced positionsH. Enough help to get the job doneI. Enough time to get the job doneJ. Chances to make friendsK. Good job securityL. Good hoursM. Interesting workN. Freedom in deciding how to do work0. Supervisor who is concerned about the welfare of those under her22
P.2APR. 9 '90 11:04A1 ERIC-FEDeparbnant of EducationOffice of Educational Rematch and improvement (OEMMotional &Na of Education (NLE)Educational Reeouneos Intimation Centel (ERIC)REPRODUCTION RELEASE(p ac Document)I. DOCUMENT IDENTIFICATION:EMPLOYMENT MITRE AND REALITIES IN SPEECH AND. LANGUAGE PATHOLOGY.linft.10116), Tak MO MIRC1tat I pTIreedit Cu; CaU 'DeakinCOrpOrItt SOW*:Publication Dal CGeorgia Southern UniversityNov 1997Statesboro, GAIL REPRODUCTION RELEASE:in miler to anecdotal, SO AWN, p pdaNDN Cludy And atntlicaot metootolo of Miami toeducational community. dociaminto untiounood In theYdbelt. Reauunum Ay Museum (iic). NO "Sully mad, wallobto to users In rricolictio, fopmduced pow cam,and elsdrania mod*, sad Sold thiough the ERIC pookowait Haprodectbn &man MOM. Cold is given to the swan of own downlink int enone*Owfogrwtomi
Job satisfaction. Pezzei and Oratio (1991) studied job satisfaction in the SLP profession and found that more speech and language pathologists employed in health care settings were dissatisfied with their employment than those who worked in schools or private practice. Having friendly co-workers was the strongest predictor of job satisfaction.