Transcription
TeensandSpeedingBreaking theDeadly Cycle
ContentsExecutive Summary. 3Parents’ Role. 15Introduction. 4In-vehicle Driver Monitoring. 15Size and Nature of the Problem. 6Smartphone Apps.16Speeding-related Fatal CrashesAmong Teen Drivers. 6In-Vehicle Safety Technology. 17Why the Problem Exists. 11Parental Involvement in theLearning-To-Drive-Process. 18Developmental Issues. 11Modeling Safe Driving Behavior.19Driver Skills and Driving Behavior. 11Parent-Teen Driving Agreements.19Reducing the Problem. 11Peer-to-Peer Programs.20Speed Limits andSpeed Enforcement. 12Conclusion. 21Driver Education and Training. 12Graduated Driver Licensing.14References.23Appendix 1. 25Appendix 2.26AcknowledgmentsRichard Retting, Sam Schwartz Consulting, researched and wrote the report in consultation withPam Shadel Fischer, GHSA Senior Director of External Engagement.Russ Martin, GHSA Senior Director of Policy and Government Relations, and Kerry Chausmer,GHSA Director of Programs and Member Services, edited the report. Jonathan Adkins, GHSAExecutive Director, oversaw the report.Creative by Brad Amburn. This report is made possible with support from Ford Motor Company Fund.Published January 2021This publication is primarily directed to Governors Highway Safety Association (GHSA) members,the state and territorial Highway Safety Offices (SHSOs) tasked with addressing the behavioralsafety issues that plague the nation’s roadways and contribute to the vast majority of trafficcrashes. It is not intended to be inclusive of all policies or programs, nor does inclusion of a policy orprogram imply endorsement by GHSA or Ford Motor Company Fund. Rather it is intended to fosterdiscussion and action that advances the safety of all roadway users. While SHSOs are the primaryaudience, teen driving program providers and advocates, educators, elected officials and othersworking to advance highway safety will also find it instructive.PAG E 2 o f 2 7
Executive SummaryThe U.S. has a speeding problem. Driving at high rates of speed or too fast for conditions is oneof the most prevalent factors contributing to serious and fatal crashes on our nation’s roadways.Over the past five years (2015-2019), speeding has claimed the lives of approximately one-third ofall people killed in motor vehicle crashes. While speeding is risky for all drivers, it is particularlyproblematic for teens 16 to 19 years of age. A closer look at the speeding data reveals a troublingand persistent trend—teen drivers and their passengers accounted for a greater proportion ofspeeding-related fatalities than all other motorist age groups (43% versus 30%).Why the disparity? Teen drivers do not have the experience necessary to recognize and quicklyreact appropriately to dangerous situations, which makes speeding even riskier for them. Thispropensity to speed, however, is not innate. Teens learn about speeding at an early age, as theyride in vehicles driven by their parents and other adults and observe persistent speeding behavior.They are likely taught by driver education professionals and/or their parents that speeding isdangerous. But as teens gain confidence behind the wheel, their travel speeds are likely toincrease and be exacerbated by other drivers on the road. For teens, like the adults they grew upriding with, keeping up with traffic—even if it requires going well over the speed limit—becomesthe norm.This report examines what we know about speeding-related teen driver fatal crashes—the driverwas more likely to be male (37% versus 28%), have run-off the road or rolled over the vehicleand to be unbelted. While the youngest teen drivers (16- and 17-year-olds) have the highest fatalcrash risk due to lack of experience, their older counterparts (18- and 19-year-olds) are more likelyto crash later at night (midnight to 5 a.m.) and on highways and freeways. And when it comes topassengers, the risk of a teen driver being involved in a speeding-related fatal crash increasesexponentially with each additional peer in the vehicle.Breaking this deadly cycle is critical for driving down serious injuries and deaths involving teendrivers and their passengers. The good news is that this problem is not insurmountable. Thisreport identifies some of the best no-tech, low-tech and high-tech resources (many of which arefree) available to help families rein-in their speeding teens—and for parents to monitor their owndriving speeds, as well. These include parent-teen driving agreements, state graduated driverlicensing systems, peer-to-peer and parent-education programs, online training, and in-vehiclesafety technology. Even a teenager’s cellphone can be tapped to deliver information to mom anddad about their speeding and other driving behaviors via free or low-cost apps.The key is convincing parents to not only learn about and leverage these resources, but also torecognize the danger speeding poses for their teen drivers and take appropriate action. Theformer is the job of the State Highway Safety Offices and their partners working in the teendriving arena, which is why this report includes recommendations directed specifically at them.PAG E 3 o f 2 5
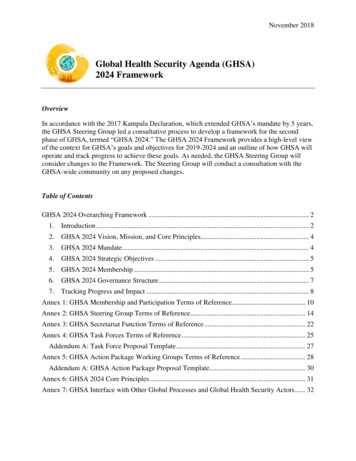
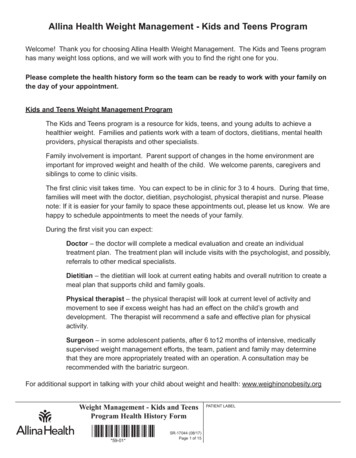
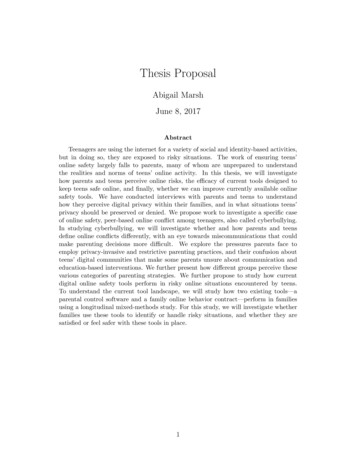
IntroductionLosing a child is, without a doubt, a parent’s worst nightmare. But sadly, each year there are parentsin the United States (U.S.) that find themselves in the unimaginable position of making finalarrangements for their teenage child killed in a motor vehicle crash, rather than organizing birthdayparties or graduation celebrations. As shown in Figure 1, despite welcome declines in the number oftraffic fatalities involving teenage drivers and passengers in 2018 and 2019, more than 2,000 U.S.teen vehicle occupant deaths occured each year. The data in this report come from the NationalHighway Traffic Safety Administration’s (NHTSA) Fatality Analysis Reporting System (FARS).FIGURE 1 Teen Drivers and PassengersKilled in Motor VehicleCrashes, 01,000500020152016201720182019For all teen driver and passenger fatalities during that same 5-year period, 43% involvedspeeding. By comparison, 30% of fatalities involving drivers and passengers ages 20 werespeeding-related (Figure 2). A total of 4,930 teen drivers and passengers were killed in thesespeeding-related crashes. A state-by-state breakdown of teen driver and passenger fatalities forthis 5-year period is provided in the Appendix.According to the Centers for Disease Control and Prevention (CDC), motor vehicle crashes are theleading cause of death for U.S. teens1. The fatal crash rate per mile driven for 16- and 17-year-oldsis about three times the rate for drivers 20 and older2. Based on police-reported crashes of allseverities, the crash rate for 16- to 19-year-olds is nearly four times the rate for drivers 20 and older.Risk is highest at age 16.In addition to having higher death rates, teen drivers pose a greater danger to others on the road.They pose the highest risk of death to their passengers, occupants of other passenger vehiclesand non-vehicle occupants such as pedestrians and cyclists3.Risk factors for teen crashes include inexperience, impulse control, lower seat belt use rates thanother age groups4 and speeding. This report focuses on speeding.PAG E 4 o f 2 7
FIGURE 2 Percent of All Driver andPassenger Deaths thatWere Speeding Related,2015–201943%30%Teen driversand passengers(Ages 13-19)Drivers andpassengers(Ages 20 )The U.S. has a speeding problem. Driving at high rates of speed or driving too fast for conditions isone of the most prevalent factors contributing to serious and fatal crashes for drivers of all ages.Speed limits are routinely violated and many drivers freely admit to speeding on a regular basis5. Inrecent years, many states have raised speed limits with some having maximum posted speed limitsof 75 mph or higher. The result of higher speed limits is even higher vehicle speeds6.Speeding increases both the likelihood of being in a crash and crash severity. Vehicles travelingat higher speeds cover a greater distance between the time a hazard is detected and the time thedriver reacts, so the vehicle will travel farther before coming to a stop. Higher speeds also increasecrash energy forces. This compromises a vehicle’s ability to protect occupants against serious andfatal injuries, even with substantial improvements in vehicle crashworthiness (e.g., steel reinforcedsafety cage, air bags, three-point seat belts, crumple zones). And even small increases in travelspeed have significant, often deadly, consequences when a vehicle collides with a pedestrian orbicyclist.While speeding is a risk factor for all drivers, teenagers (and other novice drivers) are at greaterrisk for serious crashes when speeding. Traveling at higher speeds or at speeds too fast forconditions reduces the amount of time drivers have to react to unforeseen dangers such as lossof control on slick pavement or a child or deer running into the road. Teen drivers are in the earlystages of gaining the experience needed to recognize and get out of dangerous situations, whichmakes speeding even more risky.Despite clear evidence of the harmful effects of speeding on fatal crashes, speeding by teendrivers continues to claim thousands of lives each year. This report provides the latest data onspeed-related fatal crashes among teen drivers and evidence for their increased propensityto speed. It points to possible reasons for the speeding problem and suggests potentialcountermeasures as well as recommendations for possible implementation by the State HighwaySafety Offices and their partners.PAG E 5 o f 2 7
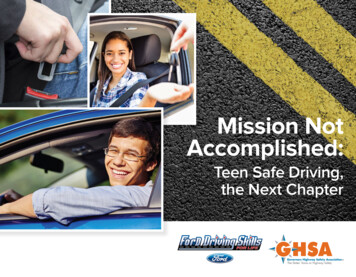
Size and Nature of the ProblemSpeeding-related Fatal Crashes Among Teen DriversFrom 2015 to 2019, 15,510 teen drivers ages 16 to 19 were involved in fatal motor vehicle crashes.More than one-third of those crashes—5,202—involved speeding as documented in FARS.Figures 3 and 4 illustrate the percentage of all speeding-related fatal crashes by driver age andgender for the five-year period. (Throughout the remainder of this report, passenger vehicle isreferred to as vehicle.)The youngest drivers (ages 16 to 19) had the greatest proportion of fatal crashes involvingspeeding (34%), followed closely by 20- to 29-year-old drivers (33%).Male drivers in every age group account for the greatest proportion of fatal crashes involvingspeeding, although the disparity with female drivers diminishes with age. The youngest drivers(ages 16 to 19) of both sexes have the greatest proportion of fatal crashes involving speeding, with36% of males and 28% of female teen drivers involved in these crashes.In many speeding-related fatal crashes, drivers fail to keep their vehicles on the road. Roadwaydeparture often results in high-speed collisions with trees, utility poles, culverts, parked cars andFIGURE 3 40%Percent of All Fatal Crashesthat were Speeding-Relatedby Driver Age, 1920–2930-64Driver Age65 FIGURE 4 Percent of All Fatal Crashesthat were Speeding-Relatedby Driver Age and Gender,2015–2019n Malen %5%0%16–1920–2930-64Driver AgePAG E 6 o f 2 765
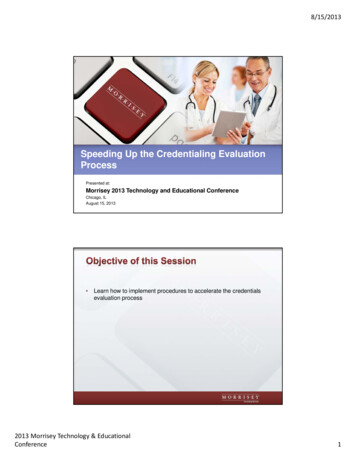
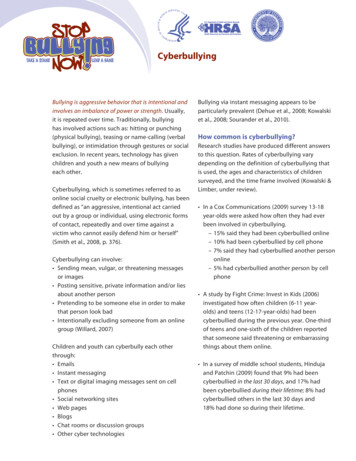
other roadside objects. As shown in Figure 5, the youngest drivers (16- and 17-year-olds) had thehighest percentage of fatal, speeding-related crashes resulting in roadway departure (71%),with the rate declining as drivers age. High levels of roadway departure for young drivers mostlikely reflects a lack of experience in selecting appropriate speeds for driving conditions and couldalso be associated with driver distraction and alcohol/drug impairment.FIGURE 5 Percent of Speeding-RelatedFatal Crashes that InvolvedRoadway Departure byDriver Age, %58%55%52%40%30%20%10%0%16171819Driver Age20–29 30–39 40–4950 Another major risk factor in speeding-related crashes is vehicle rollover, which can be dangerousand deadly. As shown in Figure 6, the youngest drivers (16-year-olds) had the highest percentageof speeding-related fatal crashes involving rollover (41%), with a slight, gradual decline in therate as drivers age. As with roadway departure, higher levels of young driver rollover crashesmight reflect a lack of experience in selecting appropriate speeds for driving conditions, as well asinappropriate response to sudden changes in driving conditions at high speeds.FIGURE 6 Percent of Speeding-RelatedFatal Crashes that InvolvedRollover by Driver %26%20%15%10%5%0%16171819PAG E 7 o f 2 7Driver Age20–29 30–39 40–4950
Driving after dark is riskier than daytime driving for several reasons, including higher travel speedsdue to emptier roads, driver fatigue and a higher prevalence of alcohol impairment. As shown inFigure 7, the percent of speeding-related fatal crashes that occurred at night among teen driverswas lowest for 16-year-olds and increased with age. For 16- to 19-year-old drivers combined,51% of all fatal crashes occurred in the dark. The increasing percent of nighttime crashes as teendrivers age is likely due to parental restrictions and/or state Graduated Driver License (GDL) lawslimiting nighttime driving by the youngest novice teen drivers.Similarly, late night hours, such as midnight to 5 a.m., can be particularly risky, especially foryoung drivers. As shown in Figure 8, the percent of speeding-related fatal crashes that occurredbetween this time period among teen drivers was also lowest for 16-year-olds and increasedwith age. As teens age and earn additional nighttime driving privileges, they are at increased riskof being involved in deadly late-night crashes.FIGURE 7 FIGURE 8 Percent of All Speeding-Related FatalCrashes that Occurred at Night by DriverAge: 2015–2019Percent of All Speeding-Related FatalCrashes that Occurred from Midnight to5 AM by Driver Age: %1922%20–2928%21%15%50 32%01840–4946%50 15%30–3953%40–4911%1747%Driver AgeDriver geAll occupants of a vehicle should wear seat belts—on every trip. However, due to their higher-crashrisk, it is especially important that teens always wear seat belts. Today’s teens grew up with carPAG E 8 o f 2 7
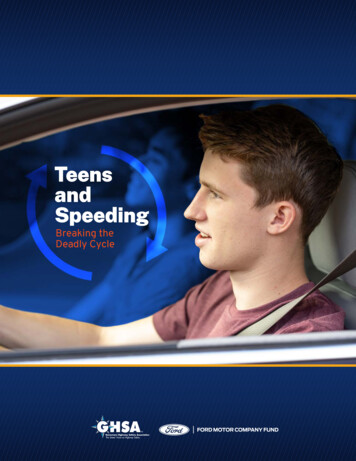
seats and seat belts, which should make it natural for them to buckle up. Yet sadly, more than halfof all teen drivers killed in speeding-related crashes were unrestrained. As Figure 9 shows, thenumber of unrestrained fatally injured teen drivers increased with age. This could be the resultof exposure (e.g., number of licensed drivers by age, amount of time spent driving by age) and thatteenagers typically feel more comfortable driving at higher speeds as they gain experience. Thislevel of comfort may also result in lower seat belt usage rates as teenagers age. As shown in Figure10, the percent of fatally injured teen drivers in speeding-related crashes that were unrestrainedwas lowest for 16-year-olds, and higher for 17-,18-, and 19-year-olds.FIGURE 9 Number of Fatally Injured Unrestrained Teen Drivers in Speeding-Related Crashes, 2015–2019123Driver Age16242173311837419050100150200250300350400FIGURE 10 Percent of Fatally Injured Teen Drivers in Speeding-Related Crashes that were Unrestrained by Age, 2015–201943%Driver Age1647%Driver Age1746%Driver Age1847%Driver Age19It is well known the presence of one or more teen passengers in a teen driver’s vehicle hasbeen shown to negatively affect driver behavior and increase crash risk7. Teen passengers, forexample, can goad the driver on or the driver could be showing off to friends. In some cases,passengers could physically interfere with the driver (e.g., grabbing the steering wheel). Thisproblem is exacerbated with higher numbers of teen passengers in the vehicle. Figure 11 showsthe percentage of teen driver (ages 16 to 19) speeding-related fatal crashes by teen passengerpresence. For both male and female teen drivers, the rate of fatal crashes that were speedingrelated increased with each additional teen passenger in the vehicle.Understanding where teen drivers are speeding—the road type—is also important. Public roadsgenerally fall into three categories: freeways such as interstates and limited access-highways;non-freeway arterials, typically the main roads that carry local and regional traffic throughcommunities; and collector/local roads. Figure 12 shows the percentage of speeding-related fatalPAG E 9 o f 2 7
30%FIGURE 11 Percent of Speeding-RelatedFatal Teen Driver Crashes byTeen Passenger Presence,2009-2018n Driver Alonen 1 Teen Passengern 2 Teen Passengersn 3 Teen 6%15%10%5%0%MaleFemaleTotalcrashes by roadway category. Note that teen speeding is not confined to freeways. In fact, it ismore likely to occur on non-freeway and local roads.Interstates and other freeways have features that promote safety (e.g., median barriers to help preventhead-on collisions; elimination of intersections and crossing-path collisions through limited access),and speed limits and travel speeds are highest on these roadways, which can be a significant challengefor novice drivers. For this reason, many young drivers limit or delay driving on Interstates and otherfreeways, or travel more slowly than other drivers on these high-speed roads. As young drivers gainexperience, they may be more willing to travel on Interstates and other freeways, and/or travel atFIGURE 12 Percent of Speeding-RelatedFatal Crashes by RoadwayType, 2015–2019n Freewayn Non-Freeway Arterialn %10%048%47%46%41%14%16%9%5%1617PAG E 1 0 o f 2 718Driver Age1920
higher speeds on these roads. This likely explains why the percent of all fatal crashes that occur onInterstates and other freeways increases steadily with driver age through the teen years.Why the Problem ExistsElevated crash rates for teen drivers result both from inexperience and immaturity. Young drivers arestill learning critical driving skills that experienced drivers take for granted. And teenagers are stilldeveloping physically, mentally and emotionally. Lack of experience behind the wheel makes it moredifficult for teenagers to assess potential crash risks, such as speeding, as well as to recognize andrespond to hazards when they occur. While the relative contribution of driver age versus inexperiencehas long been debated, the effects of experience are clearly demonstrated by a steep drop in crashrates, especially among the youngest drivers, during the first few months of driving8.Developmental IssuesAdolescents’ brains differ from those of adults in important ways. Higher teen driver death ratesare reported to be related to problems with behavior and emotion control9. The human brain isn’tfully developed until the early to mid-twenties, particularly the prefrontal cortex where impulsecontrol, decision making and judgment are centered, thus compromising important functionsrelated to safe driving. Some teenagers may also be impulsive, thrill seeking and more drawn tothe rewards of risky behavior rather than wary of the negative consequences of such behaviors.Driver Skills and Driving BehaviorLearning to drive safely takes time and extended practice, regardless of age. Many skills mustbe mastered. New drivers usually learn maneuvering skills such as steering, accelerating andbraking relatively quickly. Meanwhile, more complex tasks such as visual search, risk and hazardperception, and appropriate responses to the latter, come with practice over a longer time period.Novice drivers’ attention can be easily overloaded such that their ability to pay attention to multipleactivities on the road (e.g., pedestrians and cross traffic) is limited. There is evidence novice driversare less able to assess hazards in the traffic environment and their visual search patterns are lessattuned to detect potential future risks10. Observational studies have documented the tendencyfor teen drivers to speed and allow shorter following distances11 12. These risky behaviors areexacerbated in the presence of teen passengers.Reducing the ProblemOne of the biggest challenges in addressing the dangers of speeding isthat this behavior is widely accepted nationwide. The U.S. has a cultureof speeding in which many drivers view speed limits as minimums ratherthan the maximums based on ideal conditions. According to the “2019AAA Safety Culture Index,” 48.3% of motorists reported exceeding theposted speed limit by 15 mph on highways, while 41.5% admitted driving10 mph over the posted speed limit on residential streets in the past month13.The latest speed research conducted for NHTSA confirms what the motoringpublic admits: 68% are exceeding the posted speed limit on limited accessroads and 56% and 58% are doing so on arterials and collectors, respectively.PAG E 1 1 o f 2 7The U.S. has a culture ofspeeding in which manydrivers view speed limitsas minimums ratherthan the maximums.SPEEDLIMIT70
Approximately 16% to 19% of these motorists are also traveling more than 10 mph over the postedspeed limit14.Although speeding has long been recognized as a critical factor contributing to fatal teencrashes, effective measures to reduce the problem have been elusive. Potential countermeasuresinclude driver training, safety education, state GDL laws that set a minimum age at which teensmay obtain a driving permit and license and restrictions on when teens can drive and with whom,speed enforcement, and a growing array of in-vehicle technologies. The remainder of this reportaddresses various approaches to help reduce the teen speeding-related crash problem andrecommendations for consideration by the SHSOs.Speed Limits and Speed EnforcementSpeed limits and their enforcement have the potential to deter teen drivers from speeding, butmost law enforcement agencies have insufficient staffing resources to conduct rigorous, sustainedspeed enforcement campaigns. In addition, some law enforcement officials believe public concernsabout perceived racism in traffic enforcement might be a factor in the apparent slowdown in trafficenforcement by police15. Although police speed enforcement activities do not specifically targetdrivers by age, law enforcement agencies could conduct periodic speed enforcement at crashprone locations frequented by younger drivers, such as near high schools or shopping malls.While automated traffic enforcement (e.g., safety cameras) has been shown to dramatically reducespeeding behavior16, many states either prohibit this technology, do not expressly authorize its use,or restrict cameras to school and/or work zones.RecommendationsPartner with community advocates, parents and others concerned about speeding to educateelected officials, the media and key influencers about the effectiveness of automated speedenforcement (safety cameras) as a supplement to traditional police enforcement. A checklist,developed by AAA, Advocates for Highway and Auto Safety, the Insurance Institute forHighway Safety and the National Safety Council, for implementing red light camera programscan serve as a useful resource for automated speed enforcement17.Identify speeding-related teen-driver crash hot spots and partner with local police agencies toconduct enforcement.Driver Education and TrainingBeginning drivers need training to learn basic driving skills, as well as to master more advancedtechniques over time. Driver education enjoys widespread public support as the preferred way toprepare teenagers for driving. There is mixed evidence regarding the effectiveness of traditionaldriver training in reducing crashes among young drivers. Several comprehensive internationalreviews of the best scientific evaluations of driver education programs for young beginnersconcluded there is no difference in the crash records of driver education graduates compared withequivalent groups of beginners who learned to drive without formal education18.PAG E 1 2 o f 2 7
Newer research conducted in Nebraska, however, investigated whether teens who obtainedtheir intermediate-level provisional operators permit (POP) in a GDL environment through drivereducation had fewer crashes and traffic violations then teens who obtained their POP by completinga supervised driving certification log in lieu of taking driver education. A descriptive epidemiologicalstudy examining a census of all 151,880 teen drivers in Nebraska from 2003 to 2010 found thedriver education cohort had significantly fewer injury and fatal crashes and violations than thecertification log cohort during the first two years of driving following receipt of their POP19.In partnership with the American Driver and Traffic Safety Education Association, GHSA andseveral other safety-related organizations, NHTSA developed driver training curricula andadministrative standards. NHTSA also developed a driver education program assessment tool tohelp states conduct a comprehensive review of their education and training programs to determinewhere improvements can be made.Computer-based curriculum provides another option for delivering teen driver education andtraining with more consistency and convenience, though safety outcomes vary. For example:»Researchers tested a stand-alone, self-administered training module intended to acceleratethe process of perceptual expertise for young, novice drivers among a small sample of youngdrivers20. Five out of the six pilot-study participants demonstrated robust improvements in alllearning categories included in the training – path conflict, stopping vehicle, roadside incursion,forced path change, obscured potential hazard and emergency vehicle effects. While thisapproach appears promising, the study did not examine the training’s effect on actual drivingskills or crash risk and whether these effects are long-lasting.»Researchers developed and evaluated Accelerated Curriculum to Create Effective Learning(ACCEL), a computer-based training program that can be downloaded from the Internet on anypersonal computing device (e.g., laptops, smartphones, tablets)21. The program targeted sixskills based on a literature review of factors linked to novice driver crash risk. The researchersfound the ACCEL training group performed better than the placebo training group in five of thesix skills, with tactical hazard mitigation performance marginally better for the ACCEL groupas compared to the placebo group. The study also examined whether the skills were sustainedthree to six months post-training and the effects of a second ACCEL training session. Findings,however, were limited due to high participant attrition. Overall, the ACCEL training programaccelerated the development of novice drivers’ strategic and tactical hazard anticipation andattention maintenance skills across the riskiest crash scenarios.»Ford Driving Skills for Life offers TheAcademy, a free online resource to helpteens “test [their] safe driving knowledgeand gain valuable safe driving skills.” TheAcademy also includes a Parent-Teen DriverAgreement (see page 19 for more informationon this proven tool), and science-basedresources that use algebra and biology toreinforce critical traffic safety concepts22.PAG E 1 3 o f 2 7
A number of high-performance driver training programs are available for parents that want toexpose teens to emergency driving exercises such as hard braking, emergency lane change andslide recovery, and skid control, as well as cognitive skills like hazard anticipation, visual scanningand situational awareness.RecommendationsPromote state adoption of the national driver training curricula and administrative standards.Use the NHTSA driver education program assessment tool to conduct a comprehensive reviewof your state’s driver education and training programs to determine where improvements canbe made.Provide and/or promote resources and programs that build upon driver education and trainingto help teens develop higher order driving skills.Conduct research to determine whether teens in your state that complete mandated drivereducation have lower crash and violation rates than teens who do not complete mandateddriver education.Graduated Driver LicensingGraduated Driving Licensing (GDL) is widely recognized as one of the mosteffective approaches for reducing the risk of teen crashes. GDL restrictsteen driving to times of the day and situations that are considered lower risk.According to NHTSA, this approach can reduce teen crash risk by as muchas 50%23. GDL addresses well-known high risks for novice drivers by limitingdriving at night and with teen passengers during the initial six to 12 monthsof licensure, only allowing unrestricted driving after more experience hasbeen gained.GDL restricts teendriving to times of theday and situationsthat are consideredlower risk. Thisapproach can reduceteen crash risk by asmuch as 50%.The effects of GDL specifically on teen speeding behavior have not been established by research.But limiting driving under conditions for which speeding is known to be more prevalent — at night(when
They pose the highest risk of death to their passengers, occupants of other passenger vehicles and non-vehicle occupants such as pedestrians and cyclists. 3. Risk factors for teen crashes include inexperience, impulse control, lower seat belt use rates than other age groups. 4. and speeding. This report focuses on speeding. 0 500 1,000 1,500 .