Transcription
TEXASW.t4TERDEVELOPMENTBOARDReport 136GROUND-WATER RESOURCES OFMONTGOMERY COUNT'Y, TEXASNOVEMBER 1971
TEXAS WATER DEVELOPMENT BOARDREPORT 136GROUND-WATER RESOURCES OFMONTGOMERY COUNTY, TEXASByBarney P. PopkinUnited States Geological SurveyPrepared by the U.S. Geological Surveyin cooperation with theTexas Water Development BoardMontgomery County Commissioners CourtSan Jacinto River Authorityand theCity of ConroeNovember 1971
TEXAS WATER DEVELOPMENT BOARDW. E. Tinsley, ChairmanRobert B. GilmoreMilton T. PottsMarvin Shurbet, Vice ChairmanJohn H. McCoyCarl IlligHarry P. Burleigh, Executive DirectorAuthorization for use or reproduction of any material contained in thispublication, i.e., not obtained from other sources, is freely granted without thenecessity of securing permission therefor. The Board would appreciateacknowledgement of the source of original material so utilized.Published and distributedby theTexas Water Development BoardPost Office Box 13087Austin, Texas 78711ii
TABLE OF CONTENTSPageABSTRACT,.INTRODUCTION3Location and Extent of the Area . . . . . . . . . . . . . . . . . . . . . . . . . . . . . . . . . . . . . . . . . . . . . .3Purpose and Scope of the Investigation . . . . . . . . . . . . . . . . . . . . . . . . . . . . . . . . . . . . . . . . . .3Previous Investigations3Methods of Investigation. . . . . . . . . . . . . . . . . . . . . . . . . . . . . . . . . . . . . . . . . . . . .4Well-Numbering System . . . . . . . . . . . . . . . . . . . . . . . . . . . . . . . . . . . . . . . . . . . . . . . . . . . .4Acknowledgments4Population and Economy of the Area. . . . . . . . . . . . . . . . . . . . . . . . . . . . . . . . . . . . . . . . . . .4Physiography and Drainage8Climate8GROUND-WATER HYDROLOGY9General Geology9Source and Occurrence of Ground Water9Hydrologic Units11Catahoula Sandstone. . . . . . . . . . . . . . . . . . . . . . . . . . . . . . . . . . . . . . . . . . . . . . . . . .11Lower Part of the Jasper Aquifer. . . . . . . . . . . . . . . . . . . . . . . . . . . . . . . . . . . . . . . . . .11Upper Part of the Jasper Aquifer. . . . . . . . . . . . . . . . . . . . . . . . . . . . . . . . . . . . . . . . . .15Burkeville Aquiclude. . . . . . . . . . . . . . . . . . . . . . . . . . . . . . . . . . . . . . . . . . . . . . . . . .15Evangeline Aquifer . . . . . . . . . . . . . . . . . . . . . . . . . . . . . . . . . . . . . . . . . . . . . . . . . . .15Chicot Aquifer . . . . . . . . . . . . . . . . . . . . . . . . . . . . . . . . . . . . . . . . . . . . . . . . . . . . . .15Hydraulic Properties of the Aquifers15Recharge, Movement, and Discharge of Ground Water . .' . . . . . . . . . . . . . . . . . . . . . . . . . . . . .30CHEMICAL QUALITY OF GROUND WATER. . . . . . . . . . . . . . . . . . . . . . . . . . . . . . . . . . . . . . . .30Relationship of Quality of Water to Use . . . . . . . . . . . . . . . . . . . . . . . . . . . . . . . . . . . . . . . . .32Water Quality in the Hydrologic Units34iii
TABLE OF CONTENTS (Cont'd.)PageCatahoula Sandstone. . . . . . . . . . . . . . . . . . . . . . . . . . . . . . . . . . . . . . . . . . . . . . . . . .34Lower Part of the Jasper Aquifer. . . . . . . . . . . . . . . . . . . . . . . . . . . . . . . . . . . . . . . . . .34Upper Part of the Jasper Aquifer. . . . . . . . . . . . . . . . . . . . . . . . . . . . . . . . . . . . . . . . . .34Burkeville Aquiclude. . . . . . . . . . . . . . . . . . . . . . . . . . . . . . . . . . . . . . . . . . . . . . . . . .34Evangeline Aquifer . . . . . . . . . . . . . . . . . . . . . . . . . . . . . . . . . . . . . . . . . . . . . . . . . . .34Chicot Aquifer. . . . . . . . . . . . . . . . . . . . . . . . . . . . . . . . . . . . . . . . . . . . . . . . . . . . . .35Water-Quality Problems. . . . . . . . . . . . . . . . . . . . . . . . . . . . . . . . . . . . . . . . . . . . . . . . . . . .35Disposal of Oil-Field Brines35Protection of Water Quality in Oil-Field Drilling Operations . . . . . . . . . . . . . . . . . . . . . . . . . . . .3535DEVELOPMENT OF GROUND WATERUse of Ground Water35Water-Level Declines and Land-Surface Subsidence . . . . . . . . . . . . . . . . . . . . . . . . . . . . . . . . . .37Well Construction. . . . . . . . . . . . . . . . . . . . . . . . . . . . . . . . . . . . . . . . . . . . . . . . . . . . . . . .38AVAILABILITY OF GROUND WATER49NEED FOR FUTURE STUDIES. . . . . . . . . . . . . . . . . . . . . . . . . . . . . . . . . . . . . . . . . . . . . . . . . .51REFERENCES CITED53TABLES1.2.Well Numbers Used in This Report and CorrespondingNumbers Used in Older Reports5Hydrogeologic Units Used in This Report and inReports on Adjacent Counties103.Characteristics of the Hydrologic Units in Montgomery County124.Summary of Aquifer Tests in the Upper Part of theJasper Aquifer in Montgomery and Adjacent Counties. . . . . . . . . . . . . . . . . . . . . . . . . . . . . .31Source and Significance of Dissolved-MineralConstituents and Properties of Water . . . . . . . . . . . . . . . . . . . . . . . . . . . . . . . . . . . . . . . . .336.Estimated Use of Ground Water in Montgomery County, 1966 . . . . . . . . . . . . . . . . . . . . . . . . . .387.Records of Wells in Montgomery and Adjacent Counties558.Drillers' Logs of Wells in Montgomery and Adjacent Counties. . . . . . . . . . . . . . . . . . . . . . . . . . .829.Water Levels in Wells in Montgomery and Adjacent Counties5.iv107
TABLE OF CONTENTS (Cont'd.)Page10.Chemical Analyses of Water From Wells in Montgomery and Adjacent Counties. . . . . . . . . . . . . . .11811.Field Analyses of Water From Wells in Montgomery and Adjacent Counties125FIGURES1.Map Showing Location of Montgomery County . . . . . . . . . . . . . . . . . . . . . . . . . . . . . . . . . . . .32.Graph Showing Annual Precipitation at Conroe, 1931-66 . . . . . . . . . . . . . . . . . . . . . . . . . . . . . .83.Graph Showing Average Monthly Precipitation at Conroe, 1931-6694.Graph Showing Average Monthly Temperature at Conroe, 1931-6695.Photograph of Well TS-60-53-502, the Largest CapacityFlowing Well in Montgomery County . . . . . . . . . . . . . . . . . . . . . . . . . . . . . . . . . . . . . . . . .116.Map Showing the Approximate Altitude of the Base of the Catahoula Sandstone137.Map Showing the Approximate Altitude of the Base of the Lower Part of theJasper Aquifer and Base of the Sand Containing Fresh Water in the Aquifer17Map Showing the Approximate Altitude of the Base of the Lower Part of the Jasper Aquiferand Base of the Sand Containing Slightly Saline Water in the Aquifer. . . . . . . . . . . . . . . . . . . .19Map Showing the Approximate Altitude of the Base of the Upper Part of the Jasper Aquiferand Areas Where Slightly Saline Water is Present in the Aquifer. . . . . . . . . . . . . . . . . . . . . . . .2110.Map Showing the Approximate Altitude of the Base of the Burkeville Aquiclude . . . . . . . . . . . . .2311.Map Showing the Approximate Altitude of the Base of the Evangeline Aquifer and theThickness of Fresh Water-Bearing Sands in the Chicot and Evangeline Aquifers25Map Showing the Approximate Altitude of the Base of the Chicot Aquifer and theApproximate Altitude of Water Levels in Wells Screened in the Aquifer, 1966-672713.Graph Showing Relation of Drawdown to Transmissibility and Distance2914.Photograph Showing a Comparison of New and Corroded Check Valves3615.Graph Showing Comparison Between Depth of Sands Containing Fresh to Slightly Saline Waterand the Depth of Protection Required in Oil Fields in Montgomery County37Hydrographs of Water Levels in Wells Tapping theUpper Part of the Jasper Aquifer at Conroe . . . . . . . . . . . . . . . . . . . . . . . . . . . . . . . . . . . . .39Map Showing the Approximate Altitude of Water Levels inWells Screened in the Upper Part of the Jasper Aquifer, 1966-6741Map Showing Approximate Altitude of Water Levels in WellsScreened in the Evangeline Aquifer, 1942-43 . . . . . . . . . . . . . . . . . . . . . . . . . . . . . . . . . . . .43Map Showing Approximate Altitude of Water Levels in WellsScreened in the Evangeline Aquifer, 1966-67 . . . . . . . . . . . . . . . . . . . . . . . . . . . . . . . . . . . .458.9.12.16.17.18.19.v
TABLE OF CONTENTS (Cont'd.)Page20.Hydrograph of Selected Water Levels in a Well Tapping the Chicot Aquifer at Conroe21.Map Showing the Approximate Altitude of the Base ofFresh Water in the Report Area. . . . . . . . . . . . . . . . . . . . . . . . . . . . . . . . . . . . . . . . . . .133Map Showing the Approximate Thickness of FreshWater-Bearing Sands Below the Burkeville Aquiclude135Map Showing the Approximate Altitude of the Base ofSlightly Saline Water in the Report Area. . . . . . . . . . . . . . . . . . . . . . . . . . . . . . . . . . . . . . .137Map Showing the Approximate Thickness of Fresh to SlightlySaline Water-Bearing Sands Below the Burkeville Aquiclude13925.Hydrogeologic Map Showing Location of Wells in Montgomery and Adjacent Counties . . . . . . . . .14126.Hydrologic Section A-A'14327.Hydrologic Section B-B', Harris and Montgomery Counties14528.Hydrologic Section C-C', Walker, Montgomery, and Harris Counties. . . . . . . . . . . . . . . . . . . . . . .14729.Hydrologic Section 0-0', Montgomery and Harris Counties14922.23.24.vi47
GROUND-WATERRESOURCES OFMONTGOMERY COUNTY, TEXASABSTRACTGround water in Montgomery County is containedin sands of the Catahoula Sandstone, lower part of theJasper aquifer, upper part of the Jasper aquifer,Burkeville aquiclude, Evangeline aquifer, and Chicotaquifer. The Chicot, Evangeline, and upper part of theJasper generally contain fresh water throughout thecounty. The Catahoula Sandstone and lower part of theJasper contain fresh and slightly saline water in thenorthern and central parts of the county. The Evangel inetransmits about 10 mgd (million gallons per clay) and theupper part of the Jasper transmits about 3,,5 mgd. Thequality of water in the aquifers is good and can be usedfor most purposes.The ground-water resources of the county arepractically untapped. In 1966, about 6.2 mgd of groundwater was used for all purposes. The principal uses,about 2.6 mgd, were for rural domestic and livestocksupplies. Almost all of the water was obtained from theEvangeline and the upper part of the Jasper.About 80 million acre-feet of fresh ground water isin storage in Montgomery County. However, most ofthis water cannot be economically produced.Calculations based on the transmission capacity of theEvangeline and upper part of the Jasper indicate thatabout 65 mgd could be obtained with pumping levelsnot exceeding 400 feet along an assumed line ofdischarge in the latitude of Conroe. Probably as much as150 mgd could be pumped with only moderatewater-level declines and land-surface subsidence. If therejected recharge in the outcrop areas were salvaged, anadditional 140,000 acre-feet per year (125 mgd) ofwater would be available.
GROUND-WATERRESOURCES OFMONTGOMERY COUNTY, TEXASINTRODUCTIONavailability and dependability of sources of water suitable for municipal supply, industrial use, and irrigation.A related purpose was to determine areas of present orpotential ground-water pollution.Location and Extent of the AreaMontgomery County is in southeastern Texas inthe West Gulf Coastal Plain physiographic: province(Fenneman, 1938). It is bordered by Walker County onthe north, San Jacinto and Liberty Counties on the east,Harris County on the south, and Waller and GrimesCounties on the west. Peach Creek is the boundary withSan Jacinto County, and Spring Creek forms most of theboundary with Harris County. Montgomerv County,which is adjacent to the Houston metropolitan area, hasan area of 1,090 square miles (Figure 1).The study included a determination of: (1) theextent and location of sands containing fresh water(dissolved solids less than 1,000 milligrams per liter) andslightly saline water (dissolved solids of 1,000 to3,000 milligrams per liter); (2) the quantity of groundwater pumped and the effect of pumping on waterlevels; (3) the hydraulic characteristics of the aquifers;and (4) the quantity of ground water available fordevelopment.Previous InvestigationsThe first investigation of the ground-water resources of Montgomery County was that ofTaylor (1907), who discussed briefly the railroad wellsat Dobbin and Conroe. Deussen (1914) discussed thegeology and ground-water resources of the county inmore detail. Both reports contained records of wells,drillers' logs, and chemical analyses of water samples.Livingston (1939) inventoried 56 wells inMontgomery County and published chemical analysesand drillers' logs. Rose (1943) described 138 wells andpublished chemical analyses, drillers' logs, and columnarsections of sands.Wood (1956) and Wood, Gabrysch, andMarvin (1963) discussed the ground-water supplies potentially available from the principal water-bearing unitsin the Gulf Coast region of Texas, includingMontgomery County. Wood and Gabrysch (1965) discussed the hydrology of the Houston district, includingparts of Montgomery County. Measurements of waterlevels in wells in Montgomery County have been madesince 1931 as part of the observation-well program inTexas. Records of these measurements have been published by the Texas Water Development Board and theU.S. Geological Survey (see Rayner, 1959; Sayre, 1957;and Hackett, 1962).Figure 1.-Location of Montgomery CountyPurpose and Scope of the InvestigationThe Montgomery County ground-water investigation was started in May 1966 as a cooperative projectof the Texas Water Development Board, the San JacintoRiver Authority, the Montgomery County Commissioners Court, the city of Conroe, and the U.S.Geological Survey. Its purpose was to determine theoccurrence, quality, and quantity of the ground-waterresources of Montgomery County and to describe the- 3-
the well number. Each well within a 2%-minute quadrangle is given a two-digit number in the order in whichit is inventoried, starting with 01. These are the lasttwo digits of the well number.Methods of InvestigationThe investigation of the ground-water resources ofMontgomery County included an inventory of 497 wellsin the county and 81 wells in adjacent counties, including all industrial, public supply, and irrigation wells,and a representative number of livestock and domesticwells (Table 7).All of Montgomery County is within the 1-degreequadrangle 60. The second two digits are shown in theupper left corner of each 7%-minute quadrangle on thewell location map (Figure 23); the last three digitsappear at the well location.Figure 25 shows the location of inventoried wellsand test holes. Electrical logs of test holes were used tocorrelate and evaluate the subsurface characteristics ofthe water-bearing sands. Drillers' logs (Table 8), electrical logs of selected test holes, and analyses of samplesof water collected from a large number of wells(Table 10) were used to determine the chemica qualityof the water and the total thickness of sands containingfresh to slightly saline water.In order to facilitate the use of well data fromother reports, the previously inventoried wells wereassigned new State numbers. The old and new numbersare cross-referenced in Table 1.AcknowledgmentsThe author acknowledges the assistance of thosewho contributed data and helped with the preparationof this report. Particular thanks are due the officials ofHumble Oil and Refining Company; Texaco, Incorporated; Tennessee Gas and Transmission Company; andthe City of Conroe for their assistance in supplyingrecords of their wells and oil and gas tests.Field analyses of water from selected wells weremade to determine pH at the time of sampling(Table 11). Pumping test data (Table 4) were collectedto determine the hydraulic characteristics of the freshwater-bearing sands. Measurements of water levels inwells and records of past measurements were used todetermine the effects of pumping. Pumpage of groundwater for municipal supply, industrial use, and irrigationwas inventoried. Elevations of water wells were determined from U.S. Geological Survey topographic maps.Climatological records and streamflow records werecollected and analyzed.Drillers of water wells generously supplied drillers'logs, electrical logs, and well-completion data.Layne-Texas Company and Con-Tex Water Wells wereespecially helpful. Property owners granted access totheir lands, wells, and records. The active and retiredemployees of Humble Oil and Refining Company,Superior Oil Company, Sun Oil Company, andTidewater Oil Company gave generous field assistance inlocating many of the old flowing water wells in theConroe and Lake Creek oil fields.Well-Numbering SystemThe well-numbering system used in this report is astatewide system adopted by the Texas Water Development Board.Population and Economy of the AreaA 2-letter prefix to the well number is used toidentify each county. The prefix assigned toMontgomery County is TS. Prefixes assigned to adjacentcounties are:COUNTYPREFIXCOUNTYPREFIXSan Montgomery County had a population of 2,384in 1850. By 1900, the population had increasedto 17,067. The oil boom in the 1930's did not substantially increase the county population because the city ofHumble, in Harris County, served as the operationheadquarters. During the period 1950-70, the populationincreased from 24,504 to 46,950. Conroe, with a population of 10,931 in 1970, is the county seat. Willis,Montgomery, and Cut and Shoot are among the smallercommunities.Under this system, each one-degree quadrangle inthe State is given a number consisting of two digits from01 to 89. These are the first two digits in the wellnumber. The one-degree quadrangles are divided into7%-minute quadrangles which are given two-digit numbers from 01 to 64. These are the third and fourth digitsof the well number. Each 7%-minute quadrangle issubdivided into 2%-minute quadrangles which are given asingle digit number from 1 to 9. This is the fifth digit ofThe county serves as a recreational center formuch of the Houston area. The Sam Houston NationalForest, the W. Goodrich Jones State Forest, the BoyScout camp (Camp Strake), and numerous lakes, camps,and country clubs are integral parts of the county'srecreational facilities. Lake Conroe, the 32.8 square-milelake under construction on the West Fork San JacintoRiver, will add to these facilities.- 4-
Table 1.-Well Numbers Used in This Report and Corresponding Numbers Used in Older ReportsMontgomery 860-37-10260-45-50560-36-30260-29-701222914445TS 3-20160-35-90160-36-50260-36-40160-45-1061622THIS 304- 5-
Table 1.-Well Numbers Used in This Report and Corresponding Numbers Used in Older EUSSEN1943193919591957196219149091929394THIS REPORTTS 5-40860-45-80160-52-204CROMACK1943THIS 360-42-70260-42-80160-42-8026768- 6-
Table 1.-Well Numbers Used in This Report and Corresponding Numbers Used in Older Reports-ContinuedHarris CountyWHITE AND OTHERSLIVINGSTON AND TURNER19441939THIS REPORT9393LJ-60-61 -50465-06-305298Walker CountyWINSLOW1950THIS REPORT1-34J-18J-19K-11K-18L- 6YU-60-26-20160-27-60160-28 ·40160-29-70560-29-80360-29-902Waller CountyFLUELLEN1952THIS REPORT0-14YW-60-58-203-7-
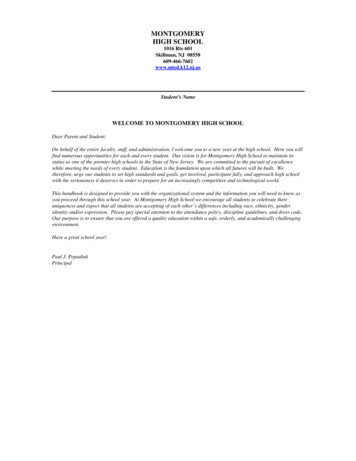
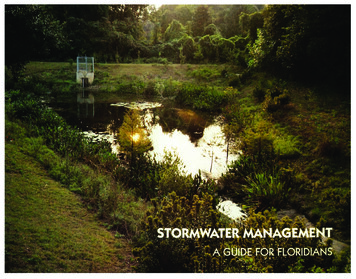
Montgomery County derives its income principallyfrom the petroleum and timber industries. Farming,dairying, gravel production, and beef cattle productionalso contribute to the economy of the area. Thediscovery of oil near Conroe in 1931 was the beginningof large-scale oil production. Over 400 million barrels ofoil were produced in the county prior to 1966. Consequently, petrochemical industries and refineries havebeen establ ished.West Fork San Jacinto River has a stream gradientof about 5 feet per mile in the northern part of thecounty and about 3 feet per mile in the central andsouthern parts. Caney Creek has a gradient of 8 to12 feet per mile in the northern part of the county andabout 5 feet per mile in the central and southern parts.Spring Creek has a gradient of about 5 feet per mile inthe southwestern part of the county and about 3 feetper mi Ie in the southeastern part.Physiography and DrainageClimateThe topographic surfaces vary from almost flatnear the larger streams and in the southern part of thecounty to hilly in the northern part. Altitudes rangefrom about 45 feet above mean sea level in the southeastern corner of the county to about 440 feet in thenorthwestern corner.Montgomery County has a warm humid climate.Precipitation averages about 47 inches annually(Figures 2 and 3). Droughts occur infrequently andgenerally are not prolonged. The average annual grosslake surface evaporation rate from 1940 through1965 was 49.5 inches (Kane, 1967).The county is in the San Jacinto River drainagebasin in which the primary drainage trends fromnorthwest to southeast. The larger streams are the WestFork San Jacinto River, Peach, Spring, Stewart, andCaney Creeks. Secondary drainage which is roughly westto east is principally by Lake and Spring Creeks. Theprimary drainage is controlled by the southeasterly slopeof the land surface while the secondary drainage iscontrolled to a large extent by the occurrence ofalternating outcrops of sand and clay.The average annual temperature at Conroe(Figure 4) is about 20 C (68 F). Temperatures belowfreezing occur on the average of only 22 days per year;temperatures above 38 C (100 F) are unusual. Themean date for the first frost is November 30; the meandate for the last frost is March 7. The county has agrowing season of about 268 ------,---- ----"""T'"-- ,801--------------------------------------- Average 47.12 inches601------VA------fCJ)UJ:I:UZ4020o U-LL.L.c.L.L.LLI .o .L.L.L.LJL.L L. .L.k:.L.L.L.L.L. .I(. L. I1950119451955Figure 2.-Annual Precipitation at Conroe, 1931·66- 8-19601965
which dips at a rate of 40 feet per mile, is overlapped bythe Willis Sand of Pliocene(?) age, which dips at a rate of10 feet per mile; consequently, the Goliad is exposedonly in the deeper stream valleys. The units crop out inbelts that are approximately parallel to the coast. Theyounger units, which crop out nearer the coast, form aplain composed of remnants of terraces; the older units,which crop out farther inland at higher elevations, formcuestas or sand hills.The formations dip toward the Gulf at an anglegreater than the slope of the land surface, and the dipincreases with depth. For example, the base of theCatahoula Sandstone dips about 90 feet per mile whilethe base of the Willis Sand dips about 10 feet per mile.Intermediate beds dip at rates ranging from 85 to 40 feetper mile.Figure 3.-Average Monthly Precipitationat Conroe, 1931-66100 -I IAVerOf)t annual 67,6 F8060-V/.- I-----.'//-[7.- /The major structural features are the deep-seatedConroe Dome and the northern flanks of the highlyfaulted, deep-seated Tomball Dome and the PiercementHumble Dome, which are mostly in adjacent HarrisCounty. These domes cause a flattening of the regionaldip and thinning of the overlying water-bearing units.30'"""20\.'" "More detailed discussions of the geology of thearea can be found in the publications of Deussen (1914),Sellards, Adkins, and Plummer (1932), Doering (1935),Michaux and Buck (1936), Fisk (1940), Metcalf (1940),Weeks (1945), Bernard, LeBlanc, and Major (1962), andBernard and LeBlanc (1965a and 1965b). Table 2 correlates the geologic units and the hydrologic units usedin this and other reports. Montgomery County isincluded in the Beaumont sheet of the Geologic Atlas ofTexas (Bureau Economic Geology, 1968).I40 20 Figure 4.-Average Monthly Temperatureat Conroe, 1931-66Source and Occurrence of Ground WaterThe principal source of ground water inMontgomery County is rainfall within the county and inadjoining areas to the north. Most precipitation runs off,evaporates, or is transpired by plants. Only a small partof it percolates through the soil and into the underlyingrocks.GROUND-WATER HYDROLOGYGeneral GeologyThe 9.eologic units that contain fresh to slightlysaline water in Montgomery County are, from oldest toyoungest: the Catahoula Sandstone of Miocene age; theFleming Formation of Miocene age; the Goliad Sand ofPliocene age; the Willis Sand of Pliocene(?) age; theBentley Formation, Montgomery Formation, andBeaumont Clay of Pleistocene age; and the alluvium ofHolocene age (Table 2). These units consist of alternating beds of sand and clay with minor amounts ofgravel. Local occurrences of limestone are reported insome drillers' logs.Ground water in Montgomery County occursunder two conditions-water-table and artesian. Watertable conditions exist where the water is under atmospheric pressure only and the water table is free to rise orfall in response to changes in the volume of water stored.Water-table conditions occur in the outcrop areas of thewater-bearing rocks.Artesian conditions exist where an aquifer, orwater-bearing unit, is overlain by a less permeable bedthat confines the water under hydrostatic pressure.Artesian conditions occur downdip from the outcrops ofthe aq ifers. Under these conditions, water in wells willrise above the top of the aquifer. If the pressure head isExcept for the Catahoula Sandstone and most ofthe Goliad Sand, all of these geologic units are exposedwithin the county. The Catahoula crops out north ofMontgomery County. The Goliad Sand of Pliocene age,- 9-
Table 2.--Hydrogeologic Units Used in This Report and in Reports on Adjacent CountiesHYDROGEOLOGIC UNITS USED IN OTHER REPORTSWalker County,Winslow (1950, plate 2)Houston District,Lang and Winslow(1950, plate 1)Houston District,Wood and Gabrysch(1965, figure 3)UNITS USED IN THIS REPORTSan Jacinto County,Sandeen (1968)ySystemAlluviumBeaumont Clay andAlta Loma SandBeaumont Clay andAlta Loma SandSeriesGeologic UnitHoloceneAlluviumPleistoceneBeaumont ClayMontgomery FormationBentley FormationQuaternaryChicot aquiferHydrologic UnitChicot aquiferPliocene( 1)Willis Sand(Absent)Zone 3, 4, 5, 6, 7Heavily pumpedlayerEvangeline aquiferLagarto ClayZone 2Zone 2Burkeville aquicludeOakville SandstoneZone 1Zone 1PlioceneWillis SandGoliad SandTertiaryEvangeline aquiferBurkeville aquicludeMioceneFleming FormationUpper part of JasperaquiferJasper aquifer.oLower part of JasperaquiferCatahou1a SandstoneCatahoula SandstoneCatahou1a SandstoneJackson Group,undifferentiatedYJackson GroupAlso, Liberty County (Anders and others, 1968) and Austin and Waller Counties (Wilson, 1967).EoceneJackson GroupCatahou1a Sandstone
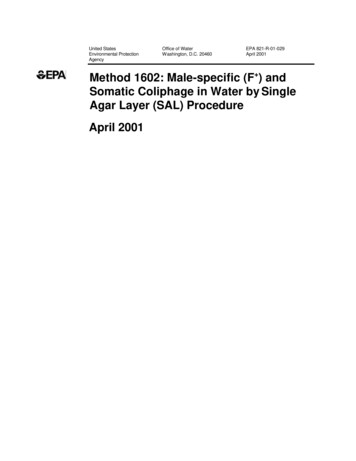
Figure 5.-Well T8-6o-53-502, the Largest Capacity Flowing Well in Montgomery Countyhigh enough, water in a well may rise to an altitudegreater than that of the land surface, causing the well toflow. Figure 5 is a recent photograph of the largestcapacity flowing well in Montgomery County(460 gallons per minute from end of casing 8 feet aboveland surface, August 19, 1966).Chicot aquifer. The relationship of these units to thosein adjacent areas is shown in Table 2. Characteristics ofthese units in Montgomery County are given in Table 3.Hydrologic sections are shown onFigures 26, 27, 28, and 29.Catahou la SandstoneHydrologic UnitsThe Catahoula Sandstone, which consists of sandoverlain by clay, is the deepest fresh water-bearing unitin the county. Figure 6 shows the approximate altitudeof the base of the Catahoula, which extends from about1,500 feet below sea level in the northwestern corner ofthe county to more than 5,000 feet below sea level inthe southeastern part. Figure 6 also shows the extent ofthe fresh and slightly saline water in the aquifer.Two types of hydrologic units considered inground-water studies are aqurfers and aquic:ludes. Anaquifer is a geologic formation, group of formations, or apart of a formation that contains and transmits water.An aquiclude is a relatively impermeable 'formation,group of formations, or part of a formation that maycontain water but is relatively impermeable or incapableof transmitting significant quantities in comparison tothe adjacent aquifers.Lower Part of the Jasper Aqu iferIn Montgomery County, the aquifers consist ofsemi-consolidated or unconsolidated sand, interbeddedwith clay; the aquicludes consist of clay that in someplaces includes sand. Six hydrologic units are recognized: the Catahoula Sandstone, the lower part of theJasper aquifer, the upper part of the Jasper aquifer, theBurkeville aquiclude, the Evangeline aquifer, and theThe lower part of the Jasper aquifer is separatedfrom the upper part mainly
which is adjacent to the Houston metropolitan area, has an area of 1,090square miles (Figure 1). Figure 1.-Locationof Montgomery County Purpose and Scope of the Investigation The Montgomery County ground-water investi gation was started in May 1966 as a cooperative project of the Texas Water Development Board, the San Jacinto