Transcription
Montgomery CountyCommunity Health Assessment 2016Submitted by the Montgomery County Health Departmentin Collaboration with FirstHealth of the Carolinas and the First‐In‐Health 2020 Vision Task ForceMontgomery County Health Department217 South Main StreetTroy, NC 27371(910) 572‐1393
AcknowledgementsThe Montgomery County Health Department, in collaboration with the First‐In‐Health 2020Vision Task Force, as well as other community partners are pleased to submit the MontgomeryCounty Community Health Assessment 2016. We feel that the information shared will bebeneficial in the continuing quest to improve the health and quality of life in MontgomeryCounty.Community Care of the SandhillsFirstHealth Community Health ServicesFirstHealth School Based Health CentersMontgomery Community CollegeMontgomery County Council on AgingMontgomery County Department of Social ServicesMontgomery County Health DepartmentMontgomery County Partnership for ChildrenMontgomery County School NursesMontgomery County SchoolsMontgomery County Sheriff’s OfficeNorth Carolina Cooperative Extension Service (Montgomery Chapter)Sandy Ridge Assisted LivingTroy‐Montgomery Senior CenterMontgomery County CHA 2016Page 2
Table of ContentsIntroduction4County Profile6Population Demographics8Factors that Affect Health Socioeconomic Factors Educational Factors Environmental Factors10101011Secondary DataCurrent Status Mortality Overweight and Obesity Cancer Incidence Diabetes Prevalence Communicable Disease Teen Pregnancy Mental Health Substance AbuseMontgomery County Trends Mortality Trends Teen Pregnancy TrendsSummary of DisparitiesSecondary Data Analysis & Implications151720202122232425262729Primary Data Survey Participation Demographics Survey Results Analysis & Implications323340Health Priorities43Appendices A: Collaborative Partners B: Health & Wellness Resources C: Health Opinion Survey (English) D: Health Opinion Survey (Spanish) E: Data Sources4648525966Montgomery County CHA 2016Page 3
IntroductionThe 2016 Community Health Assessment process is coordinated by the Montgomery CountyHealth Department in collaboration with First Health of the Carolinas and the First‐in‐Health2020 Vision Task Force. The main purpose of the assessment is to evaluate the health status ofMontgomery County in comparison to state health statistics, identify and prioritize healthissues that pose a threat to the health of the community and develop an action plan to addressprioritized community health concerns. CHA findings can be used to assist inprogrammatic/organizational decisions, to plan effective, collaborataive interventions topromote better health, to advocate for community change, to promote collaboration andpartnership, and to furnish a baseline by which to monitor changes.Methodology, Data Collection & AnalysisPrimary Data. Primary data was gatherered for the 2016 Community Health Assessmentutilizing a stratified convenience sample. The 2016 CHA team prioritized obtaining arepresentative sample of our population by ensuring that every community was sampled, everyage group, and socioeconomic status. FirstHealth and the Montgomery County HealthDepartment partered to develop the Community Health Opinion Survey tool which was thendistributed throughout the county by paper and electronic mechanisms. Electronic surveyswere sent out via Survey Monkey, and groups were asked to forward it to other friends, familymembers and business associates living within Montgomery County. Paper surveys werecollected at daycares, restaurants, church gatherings, doctors’ offices, beauty salons, barbershops, banks, pharmacies, and other local businesses. Paper surveys were hand‐entered intothe Survey Monkey platform for combined analysis of paper and electronic surveys.When surveying using a convenience sample, it is recommended that at least 500 peopleparticipate in survey completion, but it is most important that the sample mirror the populationas a whole. The 2016 CHA sampling method yielded 1,443 respondents, includingrepresentation from all five towns in the county (Troy‐ 35.26%, Mt. Gilead‐ 17.63%, Biscoe‐14.95%, Candor‐ 13.01%, and Star‐ 10.41%). More women (61.66%) completed the survey thanmen (38.34%). Racial groups were represented as following: White (71.05%), Black (18.47%),Hispanic (11.27%), Asian (1.02%), and American Indian (0.63%), which is very similar to theracial composition of the county. Sixty‐six percent of respondents were employed, with sixteenpercent being retired, and just under six percent being unemployed. Fifty‐nine percent ofrespondents indicated their incomes to be above the federal poverty level, while twenty‐sevenpercent indicated income levels below poverty. Almost 14% preferred not to answer incomequestions. With the large sampling size and the representative nature of respondents, the CHAteam feels strongly that this method was effective and results are generalizable to thecommunity.Montgomery County CHA 2016Page 4
Secondary Data. The 2016 Community Health Assessment shares data from a variety ofsources, predominantly the North Carolina State Center for Health Statistics, the Centers forDisease Control and Prevention (CDC), US Census Department, Cecil G. Sheps Center for HealthServices Research and LINC: Log Into North Carolina.Throughout the report, local statistics for Montgomery County will be displayed in comparisonto state statistics, as well as peer counties. The NC State Center for Health Statistics hasidentified seven “peer counties” for Montgomery which are similar in terms of age, race andpoverty characteristics, and population demographics. The peer counties identified forMontgomery are: Anson, Bladen, Pasquotank, Richmond, Scotland and Vance counties. Forcomparison purposes in this report, we have chosen to concentrate on data from Anson,Richmond and Scotland counties as they are in our region and we work collaboratively onseveral projects and intiatives.Priority Selection. The Community Health Assessment Steering Committee evaluated the dataas a large group during the fall of 2016. In December 2016, the Health Department shared thefindings of the assessment and feedback from the CHA work team with members of thecommunity, community partners and representatives during a Priority Setting Session.The group then engaged in a dot‐mocracy and identified four priority health concerns: Substance Abuse Prevention and Reduction (including Opioids, Alcohol and Tobacco)Diabetes/Obesity Prevention and ControlTeen Pregnancy PreventionInfant Mortality ReductionDissemination Plan. Copies of the 2016 Montgomery Community Health Assessment will beprinted and shared with all members of the Work Team and other key stakeholders asidentified by the group. Electronic versions of the document will be made available to thepublic upon request by contacting the Health Department. Electronic versions will beaccessible on the Montgomery County website (www.montgomerycountync.com). Printedcopies will be located at all library branches in the county.Montgomery County CHA 2016Page 5
County ProfileMontgomery County is located in the southern Piedmont region of North Carolina. Agricultureand manufacturing make up most of the county’s economy. Cotton and tobacco are the mostproductive crops while the county’s primary industries include textiles and lumber.Montgomery County is known as the “Golden Opportunity” county. A rural and woodedregion, Montgomery County’s primary woodland attracts hunters, fisherman and other outdoorenthusiasts. It is also home to much of the Uwharrie National Forest‐ approximately 50,000acres. Also, many rivers, lakes and mountains are within the region. Several parts of theYadkin‐Pee Dee River flow through the county as well as Badin Lake, a body of water dammedfrom the river.Location. Montgomery County is the exact geographic center of North Carolina and iscomprised of 502 square miles. Although the county ranks forty‐fifth in geographical size, itranks seventy‐first in population, as approximately two‐thirds of the county acreage is includedin the Uwharrie National Forest. Montgomery County is bounded by Moore, Richmond, Stanly,Davidson and Randolph counties.Towns and Festivals. Five townships make up Montgomery County: Biscoe, Candor, Mt.Gilead, Star and Troy, which is the county seat. Other communities include Blaine, Ether, Ophir,Pekin, Steeds, Wadeville, Eldorado and Uwharrie. The Star Fiddler’s Convention, Star HeritageDays, Troyfest, North Carolina Peach Festival, Small Town USA, and the Uwharrie MountainFestival are a few of the annual festivals hosted within the county.Montgomery County CHA 2016Page 6
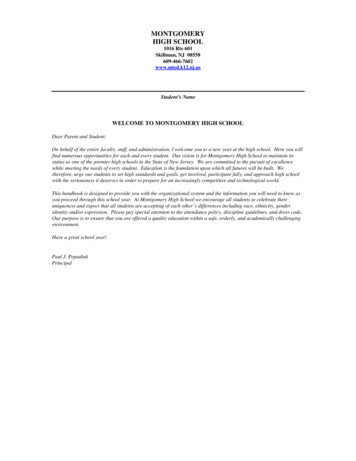
Transportation. Regional Coordinated Area Transportation System (RCATS) providestransportation for county residents, mostly for medical travel. The RCATS program hasincreased citizens’ ability to access medical care both in and out of the county. There is noother public transportation services in the county.Existing and Needed Health Resources. Asevidenced throughout this assessment, there arereal needs and barriers to healthcare inMontgomery County. However, there are alsomany resources available and the importance andutilization of those resources cannot beunderstated. Input regarding county assets wassought in a variety of ways through thisassessment process including community forums,community surveys, internet surveys andconversations with the public. The following list isa compilation of all resources indicated as beingbeneficial to Montgomery County:2020 Vision Committee, Angel Tree, Autumn Care ofBiscoe, Back Pack Pals, Chamber of Commerce,Child Care Centers, Churches, Civic Clubs,Communities in Schools, Community OutreachCenters, Cooperative Extension Service, Council onAging, FirstHealth of the Carolinas, FirstHealthSchool Based Health Centers, Food Pantries, HealthDepartment, Hospice, JobLink, Maternity Programs,Meals on Wheels, Montgomery Community College,Montgomery County Public Libraries, MontgomeryCounty Schools, Montgomery County Schoolsafterschool programs, Montgomery County SchoolsTeen Pregnancy Prevention Task Force,Montgomery County School Nurses, MontgomeryCounty Farmers’ Market, Partnership for Children,Sandy Ridge Assisted Living, School NutritionProgram, Sheriff’s Office,Troy‐Montgomery SeniorCenter, Veteran’s Services Office, WaterDepartment, and a variety of youth sports.Primary Care Physicians per 10,000 4Dentists per 10,000 4Registered Nurses per 10,000 20092014Physician Assistants per 10,000 ResidentsNCSource:North Carolina County Trends ReportFebruary 2017Montgomery County CHA 20162.92.92004Montgomery4.83.72.52.920092014Page 7
Population DemographicsThe North Carolina Office of State Budget and Management (OSBM) has certified the 2016population at 27,826. The US Census Bureau indicates the population percent change fromApril 2010 to July 1, 2015 showed a decline (‐0.9%) for the county, while the state of NorthCarolina experienced a 5.3% increase. All three peer counties also showed population declinesduring this time frame (Anson: ‐4.4%; Richmond: ‐2.6%; Scotland: ‐1.8%). On the contrary,OSBM predicts Montgomery County to increase it’s population from July 2020 to July 2030 by670 residents, giving an expect growth rate of 2.40%. North Carolina’s population is expectedto increase by 10%. Anson is expected to show no change; Scotland and Richmond are bothexpected to decline.Age. Age demographics for Montgomery County are similar to state demographics, withthe biggest difference being seen in our aging population. Nineteen percent of the countypopulation is aged 65 and over, as compared to 15.1% of the state’s population. Twenty‐threepercent of the population in Montgomery are children 18 years and under. The median age inMontgomery County is 41.52.Six hundred and seventy grandparents live in the same home as their grandchildren (less than18 years of age). Of those, 38.8% have responsibility for their grandchildren. Almost twentypercent of caregiving grandparents have had the responsibility for more than five years. Themajority of grandparent caregivers are female (51.9%) and married (66.5%).Life expectancy is the averageTotal Life Male Female WhiteAfricannumber of additional years thatExpectancyAmericansomeone at a given age would beexpected to live if ty conditions remainedconstant throughout their lifetime.NorthAccording to the 2013‐2015 Life74.971.078.776.469.8CarolinaExpectancies Report issued by theNorth Carolina State Center for Health Statistics, babies born in Montgomery County areexpected live an average of 77.7 years. As can be seen in the table above, women have higherlife expectancies than men, and white persons have higher expectancies than African‐Americanpersons for the county and the state.Gender. Males and females are represented almost equally in Montgomery County,with females just slightly more predominant (females‐ 51.3%, males‐ 48.7%). This closelymirrors North Carolina.Montgomery County CHA 2016Page 8
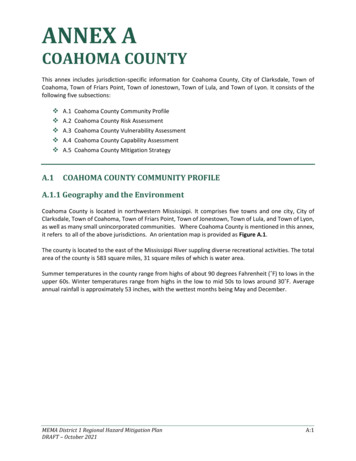
Race. The racial composition of Montgomery County consists of 63.4% white alone,19.0% black alone, 15.5% Hispanic or Latino, 1.0% American Indian, and 1.5% Asian alone. Thepercentage of Hispanic people is higher in Montgomery County than the state and all threepeer counties. Fifteen percent of households in Montgomery County report speaking alanguage other than English at home, as compared to 11.2% in North Carolina.Race and Hispanic Origin,2015 estimates70%60%50%40%30%20%10%0%North CarolinaMontgomeryAnsonRichmondScotlandRacial Composition‐ Montgomery County2%1%15%White AloneBlack AloneHispanic/Latino19%63%AsianOtherMontgomery County CHA 2016Page 9
Factors that Affect HealthSOCIOECONOMIC FACTORSIncome. The N.C. Department of Commerce annually ranks the state’s 100 countiesbased on economic well‐being and assigns each a Tier designation. The 40 most distressedcounties are designated as Tier 1, the next 40 as Tier 2 and the 20 least distressed as Tier 3. Asof December 2016, Montgomery County, Anson, Richmond and Scotland counties all continueto be designated as Tier One counties. According to the US Census, the median householdincome for Montgomery County from 2011‐2015 is 32,500 as compared to the state medianincome of 46,868. For the same time period, the per capita for Montgomery is 19,331 ascompared to the state of 25,920.Unemployment. The North Carolina Department of Commerce reports thatMontgomery County’s unemployment rate for 2015 was 5.7%, which is less than all three peercounties: Anson‐ 6.6%, Richmond‐7.9%, and Scotland‐10.7%.Free and Reduced Lunch Participation79.576.575.879.856Poverty. Just shy of twenty percent of thepersons in Montgomery County are in poverty, ascompared to 16.4 percent of the state population. NCChild reports that three out of every four students areeligible to participate in the free and reduced lunchprogram in Montgomery County, which is similar to thethree peer counties, but almost twenty percent higherthan state rate for participation.Percent Uninsured/Disabled. The US Census Bureau reports that 20.1% of MontgomeryCounty’s population (under 65 years of age) does not have insurance. It further estimates that15.8% of the total civilian non‐institutionalized population is living with a disability. 3.1% ofchildren aged 18 and under are disabled, 13.7% of adults between 18 years and 64 years aredisabled, and 39.7% of seniors 65 years and older are disabled.EDUCATIONAL FACTORSSchools. Montgomery County is home to six public elementary schools (CandorElementary, Green Ridge Elementary, Mt. Gilead Elemetnary, Page Street Elementary, StarElementary and Troy Elementary), two middle schools (East Middle School and West MiddleSchool), and three high schools (East Montgomery High School, West Montgomery High School,and Montgomery Learning Academy). Additionally, two private schools serve childrenkindergarten through high school: Wescare Academy and Family Worship Ministries.Montgomery Community College, located in Troy, provides higher education for the county.Plans are currently underway to open an Early College through the public school system in Fallof 2017. Combining the two high schools into one centrally located high school is in process.Montgomery County CHA 2016Page 10
Educational Attainment. According to the US Census, 1 in 4 Montgomery Countyresidents have not obtained a high school diploma or its equivalent. The percentage ofMontgomery residents having at least a high school diploma is only 75.0%, and although asignificant difference does not exist, it is the lowest rate among its peers (Anson‐ 79.2%,Richmond‐ 80.6%, and Scotland‐ 78.7). North Carolina’s rate is significantly higher at 85.8%.Similarly, the percent of Montgomery’s population having attained a bachelor’s degree orhigher is only 14.5%, which is half the state rate of 28.4%, but higher than Anson and Richmondrates (9.8% and 12.8%).Dropout Rate. The NorthCarolina Department of PublicGrade 7‐13 Dropout RatesInstruction reports that an average of427 students have dropped out3Ansonbetween grades 7‐13 annually since22012 in Montgomery County (’12‐’13:Montgomery27; ’13‐’14: 30; ’14‐’15: 22; ’15‐’16:1Richmond30). (Grade 13 refers to students in0Scotlandearly college). However,NCMontgomery’s dropout rate is lowerthan the state rate and all three peercounties. Data from the same sourceindicates that males are at much higher risk than females for dropping out in MontgomeryCounty.SAT Scores. The North Carolina Department of Commerce reports that the average SATscore in Montgomery County in 2016 was 1,265 on a 2400 scale. Of the peer counties, onlyAnson (1195) has SAT scores lower than Montgomery; Scotland (1282) and Richmond (1332)are both higher. Forty‐one perdecnt of graduates take the SAT in Montgomery County,indicating less than half of graduates intend to enter a four‐year college post high school.ENVIRONMENTAL FACTORSWater Quality. The water that is used by Montgomery County Public Utilities System issurface water from Lake Tillery, part of the Yadkin‐Pee Dee basin. The water is treated at thefacility in Mt. Gilead, and pumped into the Montgomery County transmission system where it issold to over 5300 individually metered customers, all five towns in the county, Carolina WaterService for Woodrun on Tillery and Carolina Forest subdivisions, and the Town of Robbins inMoore County. During the year 2015, this system received no violations. The 2015 AnnualDrinking Water Report indicated no microbiological contaminants in the distribution system.Turbidity is a measure of the cloudiness of the water and is monitored because it is a goodindicator of the effectiveness of the filtration system. The turbidity rule requires that 95% ormore of the monthly samples be less than or equal to 0.3 NTU. The highest single turbiditymeasurement in the sample for Montgomery was .28. Additionally, 99.95% of samples met theMontgomery County CHA 2016Page 11
turbidity limits. There were no inorganic contaminants, nitrate/nitrite contaminants, orasbestos contaminants detected.Air Quality. Air quality indices (AQI) are numbers used by government agencies tocharacterize the quality of the air at a given location. As the AQI increases, an increasingly largepercentage of the population is likely to experience increasingly severe adverse health effects.Air quality index values are divided into ranges, and each range is assigned a descriptor and acolor code. Standardized public health advisories are associated with each AQI range. TheUnited States Environmental Protection Agency (EPA) uses the following AQI:According to www.usa.com, Montgomery County has the seventh highest air quality ranking inthe state, with an index of 52.2. Anson ranks 51st, with an index level of 47.4. Scotland ranks53rd, with an index of 47.3, and Richmond ranks 54th, with an index of 47.1.The United States Environmental Protection Agency (EPA) defines air pollution as “any visible orinvisible particle or gas found in the air that is not part of the natural composition of air.”Air pollution comes from many different sources – some are man‐made and some are naturallyoccurring. Air pollution includes gases, smoke from fires, volcanic ash and dust particles.Research shows that air pollution can worsen asthma symptoms. According to data released bythe North Carolina State Center for Health Statistics, Montgomery County has lower hospitaldischarges with a primary diagnosis of asthma than its peer counties and the state as a whole.2013 NC Hospital Discharges with Primary Diagnosis of AsthmaCounty al NumberNumberAges 1Source: North Carolina State Center for Health StatisticsMontgomery County CHA 2016Total RateRateAges 0‐14110.574.8285.0296.3148.9Page 12
Lead Poisoning. Starting July 5, 2012, the CDC recommends public health actions to beinitiated when a child has a blood level above 5 microgram per deciliter (µg/dL). No safe bloodlead level has been identified.Ages 1 and 2 YearsAges 6 Months to 6 YearsTargetNumber Percent Lead Percent Number Confirmed Confirmed ConfirmedScreenedPopulation* Screened Screened 5 55-910-19 4,89252.01,8661.5145,2305187817Target Population is based on the humber of live births in the previous 2 years.Includes ages 9‐11Source: Children’s Environmental Health Branch, North Carolina Department of Environment and Natural ResourcesPhysical Environment. The Robert Wood Johnson Foundation annually distributes a“County Rankings and Roadmaps” report that is based on a model of population health thatemphasizes the many factors that can impact and improve health. The “Food EnvironmentIndex” is a score based on limited access to healthy foods and food insecurity. Food insecurityrepresents the percentage of the population who did not have access to a reliable source offood during the past year. For this index, a score of 0 is the worst, and 10 is the best. Access toexercise opportunities is a score based on the percent of the population that lives reasonablyclose to a local for physical activity (a park or recreational facility).Food EnvironmentIndexAccess to ExerciseOpportunitiesMontgomery County CHA d5.97.25.94.675%6%77%60%66%Page 13
Secondary DataMontgomery County CHA 2016Page 14
Secondary Data‐ Current StatusTotal death rates and cause‐specific death rates are expressed as resident deaths per 100,000.Deaths are assigned to cause‐of‐death categories based on underlying (or primary) cause ofdeath from the death certificate. The North Carolina State Center for Health Statistics lists thefollowing as the ten leading causes of death in North Carolina and Montgomery County. Theserates are for all age groups for the 2011‐2015 time frame. Note: For this section, unlessotherwise specified, all data is from the North Carolina State Center for Health Statistics.Leading Causes of Death for All Ages, 2011‐201512345678910Montgomery County Cause ofDeathCancer‐All SitesHeart DiseaseChronic Lower RespiratoryDiseaseAlzheimer’s DiseaseStrokeDiabetes MellitusUnintentional InjuriesFlu/PneumoniaMotor Vehicle InjuriesKidney DiseaseTotal Death RateRateNorth Carolina Cause ofDeath204.3 Cancer‐ All Sites202.2 Heart Disease71.7Chronic Lower RespiratoryDisease56.5Stroke48.5Alzheimer’s Disease39.9Unintentional Injuries31.2Diabetes Mellitus29.0Flu/Pneumonia21.7Kidney Disease18.8Septicemia1018.8Total Death 851.4Source: North Carolina State Center for Health StatisticsLeading Causes of Death in Montgomery County by Individual Age Groups, 2011‐2015Rank00‐19 Years20‐39 Years40‐64 Years65‐84 Years85 YearsConditions originating Motor VehicleCancer‐Cancer‐Diseases12in the perinatal periodMotor Vehicle InjuriesInjuriesHomicide3SuicideCancer‐All Sites4Cancer5SIDSDiseasesof the HeartOtherUnintentionalInjuriesAll SitesDiseasesof the HeartChronic LowerRespiratoryDiseaseDiabetesMellitusChronic LiverDisease &CirrhosisAll Sitesof the HeartDiseasesAlzheimer’sof the HeartDiseaseChronic LowerCancer‐RespiratoryAll SitesDiseaseCerebrovascular CerebrovascularDiseaseDiseaseDiabetesPneumonia &MellitusInfluenzaSource: North Carolina State Center for Health StatisticsMontgomery County CHA 2016Page 15
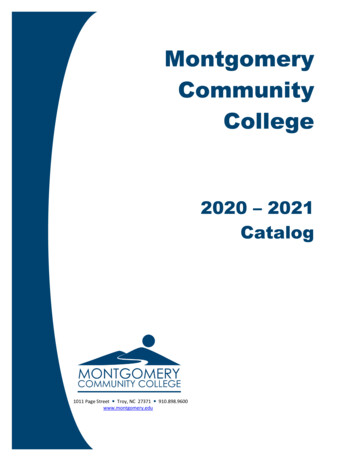
Although the causes of death are very similar for the top five, Montgomery’s rates are higherthan state rates in almost all areas. Of significant interest is that Motor Vehicle Injuries ranks9th for the county, and it doesn’t appear at all in the top ten for the state as a whole. The topfive leading causes of death are the same for the peer counties of Anson, Richmond andScotland. Montgomery’s total death rate is lower than all peer counties.Infant and Child MortalityThe North Carolina State Center forHealth Statistics indicates that infantdeath is when a child dies before itreaches his/her first birthday.Eighteen babies died in MontgomeryCounty from 2011‐2015.Infant Deaths in Montgomery County by Race,2011‐2015HispanicOtherAfrican AmericanWhite0246810Infant Deaths per 1,000 Live ndTrend data for Infant Deaths inMontgomery County shows an initialrate of 9.3, declining slightly to 8.6before a sharp increase to 11.2 forthe final time period. The state ratefor infant mortality has declinedsteadily at the same time thatMontgomery County rates haverisen. The North Carolina HealthyStart Foundation reports that NorthCarolina’s infant mortality rate was atits highest in 1988 and has had adramatic 42 percent reduction.However, North Carolina continuesto exceed the national average.2001‐2005 2006‐2010 2011‐2015Montgomery County saw the deaths of 21CHILD DEATHS ,NumberRatechildren during the years 2011‐2015, giving the2011‐2015of Deathscounty a child death rate of 65.0 which is higherNorth Carolina660157.8than the state rate, but lower than all three peerAnson County29107.3 counties. Of those that died, 14 died due toMontgomery County2165.0conditions originating during the perinatal period,Richmond County4174.92 to illnesses, 1 to SIDS, 1 to Motor Vehicle Injury,Scotland County3684.51 was the victim of homicide and 2 were due toother reasons. Eighteen of the child deaths were less than one year of age (classified as infantmortality).Montgomery County CHA 2016Page 16
Males have higher mortality rates than women inMontgomery County for nine of the ten leadingMortalitycauses of death. Females die more frequentlythan males due to complications of Influenza andPneumonia. Death rates based on fewer than 20cases are unstable and are therefore not reported. Due to this, minority rates are unavailablefor some causes of death. However, for those that are reported (Heart Disease, Stroke, Cancer,and Diabetes) African‐American males have the highest rates.WHO’S AT RISK?Infant mortality was compared between white (non‐Hispanic) and African American (non‐Hispanic) to determine the racial disparities for the years 2011‐2015. North Carolina’s disparityratio was 2.35. Richmond’s disparity ratio was slightly higher at 2.78, but both other peercounties were below (Anson‐1.60 and Scotland‐1.25) However, the disparity ratio forMontgomery County was almost double the state rate at 4.42, indicating a clear risk for AfricanAmerican babies.Overweight and ObesityPercent of Adults with BMI over 65.666.165.865.1Piedmont 64.864.264.565.063.8NCOverweight and obesity continue to beconcerns in the United States and in NorthCarolina. According to The State ofObesity, North Carolina now has the 24thhighest adult obesity rate in the nation, at29.7%. Overweight is defined as having abody mass index (BMI) of 25 or greater.Obesity is defined as having a BMI greateror equal to 30.The North Carolina State Center for HealthStatistics reports the results of theBehavioral Risk Factor Surveillance Systemregionally, and is not reported forindividual counties. Montgomery Countyis part of the Piedmont region. It shouldbe noted that all BRFSS findings are theresults of self‐reported data. This data issupported by additional data receivedSource: Professional Research Consultants, Inc.from FirstHealth of the Carolinas, a projectpartner for this Community HealthAssessment. FirstHealth routinely contracts with “Professional Research Consultants” toconduct surveys similar to the BRFSS, but only in the counties served by the hospitalorganization. By so doing, they are able to collect and share similar data specific to eachMontgomery County CHA 2016Page 17
county, which can then be compared against each other. (One of the counties they serve isRichmond, which is also considered a peer county throughout this 2016 Community HealthAssessment.) According to the 2015/2016 PRC data, 70.1% of adults in Montgomery Countyhave BMIs 25.0 or higher. Additionally, only 27.4% of adults in Montgomery County reportthemselves to be at a healthy weight, as compared to 32.2% of North Carolina.Overweight and obese adults aremore likely to report a number ofadverse health conditionsincluding hypertension, highcholesterol, chronic depression,activity limitations, “fair” or “poor”physical health, diabetes, asthma,chronic obstructive pulmonarydisease (COPD), and kidneydisease. The chart shownrepresents the relationship ofoverweight and other health issues, as reported by Professional Research Consultants.The North Carolina Pediatric Nutrition Epidemiology Surveillance System (NC‐PedNess)generates reports that inc
Montgomery County School Nurses, Montgomery County Farmers' Market, Partnership for Children, Sandy Ridge Assisted Living, School Nutrition Program, Sheriff's Office,Troy‐Montgomery Senior Center, Veteran's Services Office, Water Department, and a variety of youth sports. Source: