Transcription
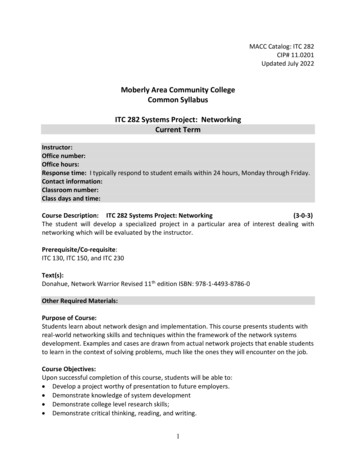
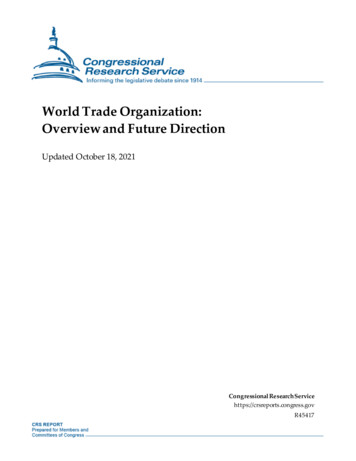
WorldTariffProfiles2021Panel a. Import NTMs: Coverage and frequencyFish & fish productsDairy productsFruit, vegetables, plantsAnimal productsCereals & preparationsCoffee, teaBeverages & tobaccoSugars and confectioneryOilseeds, fats & oilsPetroleumOther agricultural productsCottonElectrical machineryClothingTransport equipmentChemicalsTextilesmachinerySPECIAL Non-electricalTOPICLeather, footwear, etc.Manufactures, n.e.s.Non-tariff measures:Wood, paper, etc.Estimating analyticalMinerals & etalsindicators usingUNCTAD’s Trade AnalysisInformation System(TRAINS)020406080100
About this publicationWorld Tariff Profiles is a co-publication of the WTO,ITC and UNCTAD on market access for goods.This annual publication provides comprehensiveinformation on the tariffs and non-tariff measuresimposed by over 170 countries and customsterritories. Non-WTO members are included ifdata on the tariffs they applied in 2020 or 2019are available in the databases of the WTO, ITCor UNCTAD.For more informationThe statistical tables included in thisreport can be downloaded from the WTOweb site at www.wto.org/statistics
General note and abbreviations 2Introduction3I. Summary tables TariffI SUMMARYTABLESContents466Technical notes 7All products 8Agricultural products 14Non-agricultural products 20TradeII COUNTRY/TERRITORYTARIFF PROFILESDescription of column headings 26Description of column headings 26Technical notes 27Imports and exports profile 28II. Country/territory tariff profiles3437Technical notes38Country/territory tariff profiles43III. Non-tariff measures1941. Introduction1972. Statistics on some selected non-tariff measures1981982.2. Countervailing measures2092.3. Safeguards218IV. Special topic: Non-tariff measures:Estimating analytical indicatorsusing UNCTAD’s Trade AnalysisInformation System (TRAINS)224226Data availability and dissemination227Use of NTMs230236Annex237V. Annexes 238A. Data sources240B. Frequently asked questions245WTO ITC UNCTADWorld Tariff Profiles 2021ANNEXES231ReferencesVResults and policy conclusionsAcknowledgementsIV SPECIAL TOPIC2.1. Anti-dumpingIntroductionIII NON-TARIFF MEASURESIndex of tariff profiles248Download the data:www.wto.org/statistics1
General note and abbreviationsAbbreviationsAVGAverageAGAgricultural productsAVEAd valorem equivalentHS Harmonized System(nomenclature)MaxMaximum dutyMFNMost favoured nationNAVNon-ad valorem dutyNon-AGNon agricultural productsSSGSpecial safeguardsTLTariff lineUVUnit valueNotations–Not applicable0 0 (not rounded)0.0 0 and 0.05100 100 (not rounded)100.0 99.95 and 100Blank Bound or appliedduties and/or importsare not availableat all for a givencountry or territory.Italics Maxima, based on AVEestimates are printed initalics; this also appliesin cases when thead valorem is part ofa compound or mixedduty as ceiling or floor.US United States dollarThe statistics related to applied tariffsand imports are calculated usingdata which are based on the HSnomenclature adopted by the countryfor the reference year. For statisticson bound tariffs, the calculations arebased on the approved schedule ofconcessions of the WTO member.In previous issues of World TariffProfiles, each schedule is based onthe HS version which the memberused when it acceded to the WTO.Starting with the 2010 issue of thispublication, bound tariff statisticsare based on the approved scheduleof concessions for each memberin the most recent HS version. Thismight have some implications on thehistorical series of various boundtariff indicators affected by the useof a different nomenclature. Whilethe member’s commitments have notchanged as a result of the transposition,some aggregate statistics might havebeen affected as a consequence ofthe change to another HS version.The classification of products intoagricultural and non-agriculturalis based on Annex 1 of the WTOAgreement on Agriculture which listsall products covered in the Agreement.The Annex enumerates HS codesthat are subject to the agriculturenegotiations in the WTO and areconsidered agricultural products.HS codes which are not in Annex 1are subject to the non-agriculturalmarket access negotiations and areconsidered non-agricultural products.In the comparison of bound and appliedduties within countries and acrosscountries, the following caveats need tobe taken into account besides that of theeffects of different HS versions used andnomenclature breakdowns. These are:(1) binding coverage; (2) tariff bindingsnot fully implemented; and (3) AVEs. While binding commitments coverall agricultural products, in principle,this is not always the case fornon-agricultural goods. There are anumber of WTO members where thebinding coverage for non-agriculturalproducts is less – and sometimesmuch less – than 100 per cent. Also,a number of developed countrieshave not yet fully bound all thetariff lines in their schedules. Anycomparison of bound and appliedtariff indicators is only valid in casesof full binding coverage. For most WTO members, exceptthe most recently acceded ones,all commitments dating back tothe Uruguay Round have by nowbeen implemented. In caseswhere commitments are not yetfully implemented, one may seeMFN applied averages or maximaexceeding the corresponding boundduty indicators. Last but not least, the calculationof AVEs may affect the comparisonbetween bound and applied dutieswhen the changes in nomenclaturehave resulted in the use of differentunit values. In other cases, boundduties have been expressed in away that is not directly comparablewith the currently used appliedduties. In a number of cases, theestimated MFN applied AVEs wereadjusted when the correspondingbound tariff lines were defined inad valorem terms. In these cases,the corresponding bound ad valoremduty was used as ceiling for theAVE estimate.This publication covers the latest available tariff data (either 2020 or 2019) and thelatest available import data (either 2019 or 2018). The tariff information providedfor the European Union covers its 28 member states as of 1 January 2020. TheUnited Kingdom withdrew from the European Union as of 1 February 2020.The European Union and the United Kingdom have communicated that during thetransition period, which ended on 31 December 2020, European Union law, witha few limited exceptions, continued to be applicable to and in the United Kingdom.During that transition period, the EU most-favoured nation (MFN) applied andpreferential tariffs continued to be applicable in the United Kingdom.2Download the data:www.wto.org/statisticsWTO ITC UNCTADWorld Tariff Profiles 2021
IntroductionWTOThe World Trade Organization (WTO) isthe only global international organizationdealing with the rules of trade betweennations. At its heart are the WTOagreements, negotiated and signed bythe bulk of the world’s trading nations andratified in their parliaments. The goal isto help producers of goods and services,exporters, and importers conduct theirbusiness. The WTO’s main function isto ensure that trade flows as smoothly,predictably and freely as possible. It doesthis by administering trade agreements,acting as a forum for trade negotiations,settling trade disputes, reviewingnational trade policies, assistingdeveloping countries in trade policyissues through technical assistance andtraining programmes and cooperatingwith other international organizations.ITCThe International Trade Centre (ITC)is the joint agency of the World TradeOrganization and the United Nations. ITCenables small business export successin developing countries by providing,with partners, sustainable and inclusivetrade development solutions to the privatesector, trade support institutions andpolicymakers. ITC’s strategic objectivesare to strengthen the internationalcompetitiveness of enterprises, todevelop the capacity of trade serviceproviders to support businesses, and tosupport policymakers in integrating thebusiness sector into the global economy.UNCTADEstablished in 1964, the UnitedNations Conference on Trade andDevelopment (UNCTAD) promotesthe development-friendly integrationof developing countries into the worldeconomy. UNCTAD has progressivelyevolved into an authoritative knowledgebased institution whose work aimsto help shape current policy debatesand thinking on development, witha particular focus on ensuring thatdomestic policies and internationalaction are mutually supportive in bringingabout sustainable development.WTO ITC UNCTADWorld Tariff Profiles 2021The World Tariff Profiles is a jointpublication of the WTO, ITC andUNCTAD devoted to market accessfor goods. This statistical yearbookcontains a comprehensive compilationof the main tariff parameters for eachof the 164 WTO members plus othercountries and customs territorieswhere data is available. Each tariffprofile presents information on tariffsimposed by each economy on itsimports complemented with an analysisof the market access conditions itfaces in its major export markets.Statistics for all countries and territoriesare given in standardized tables whichallow easy comparisons betweencountries/territories, between sectorsand, specifically for WTO members,between bound and applied tariffsas well. The calculations are basedon national tariff schedules andimports in conformity with a standardHarmonized System (HS) nomenclatureversion. To the extent possible, advalorem equivalents (AVEs) of nonad valorem tariffs are estimated andare included in the estimation of tariffindicators. Nonetheless, certain caveatsapply in the interpretation of theseindicators and the reader is advisedto read the methodological notesthat precede the statistical tables.The publication is presented in fivemain parts. The first part showssummary tariff and trade statistics for allcountries and territories for all products,as well as a breakdown into agriculturaland non-agricultural products. Thesecond part shows for each of thesecountries and territories one full pagewith disaggregation by sectors and dutyranges. It also contains a section onthe market access conditions faced intheir respective major export markets.The third part covers informationon non-tariff measures which are ofincreasing importance in internationaltrade. The fourth part contains thespecial topic which presents a newsubject in each edition. The annexesare in part five and include the datasources and the compilation of“Frequently Asked Questions”.The summary tariff tables inthe first part are designed to allowcross-country comparison as wellas comparison of the levels of boundand applied duties. Apart from thestandard indicators like tariff averages,maxima, percentage of duty-freetariff lines, peaks and non-ad valoremduties, it also contains indicators oftariff dispersion such as the numberof distinct duties and the coefficientof variation. The calculation ofthese indicators is based, whereapplicable, on a pre-aggregationto HS six-digit subheadings, whichleads to a standardization acrosscountries and thus makes thecomparisons more compatible.Similarly, the summary trade tableshowing the imports and exports profilefacilitates the comparison of selectedindicators among the economieslisted. The statistics are presentedby agricultural and non-agriculturalsector as well as for the total economy.The indicators related to the exportsprofile are based on mirror datareported by the importing economy.The tariff profiles tables are dividedinto two blocks covering (A) thedomestic market access protectionand (B) the protection faced in themajor export markets. In part A,information on bound and appliedduties is shown by duty ranges andby sectors. Information for agriculturaland non-agricultural duties is shownseparately. In addition, there areindicators on the occurrence of specialsafeguards and on tariff quotas. Inpart B, the trade diversification andmarket access conditions in the fivemajor export markets are depicted,broken down into agricultural andnon-agricultural products.The third part contains the summarytables on anti-dumping actions,countervailing duties and safeguardmeasures. The new special topicpresented on the fourth part isentitled “Non-tariff measures:Estimating analytical indicatorsusing UNCTAD’s Trade AnalysisInformation System (TRAINS)”.Download the data:www.wto.org/statistics3
I. S ummary tables4
TariffDescription of column headings6Technical notes7All products8Agricultural products14Non-agricultural products20TradeDescription of column headings26Technical notes27Imports and Exports profile285
TariffDescription of column headingsColumnheadingsDescription or method of calculationYear of MFNapplied tariffCalendar year or start of fiscal yearBindingcoverageShare of HS six-digit subheadings containing at leastone bound tariff line. Full binding coverage is indicatedby 100 without further decimals. If some tariff linesare unbound but the result still rounds to 100 this isreflected by maintaining one decimal, i.e. 100.0.Simple averageSimple average of the ad valorem orAVE HS six-digit duty averages.Duty-freeShare of duty-free HS six-digit subheadings in the totalnumber of subheadings in the product group. Partially dutyfree subheadings are taken into account on a pro rata basis.Non-ad valoremdutiesShare of HS six-digit subheadings subject to nonad valorem duties. When only part of the HS six-digitsubheading is subject to non-ad valorem duties thepercentage share of these tariff lines is used.Duties 15 %Share of HS six-digit subheadings subject to ad valoremduties or AVEs greater than 15 per cent. When onlypart of the HS six-digit subheading is covered by suchduties, the calculation is done on a pro rata basis.Share of HS six-digit subheadings subject to ad valoremduties or AVEs greater than three times the national average.Duties 3 AVGWhen only part of the HS six-digit subheading is coveredby such duties, the calculation is done on a pro rata basis.Share of HS six-digit bound subheadings not yetConcessions notimplemented in 2020. When only part of the HSyet implementedsix-digit subheading is covered by such dutiesin 2020the calculation is made on a pro rata basis.6Download the data:www.wto.org/statisticsMaximum dutyMaximum tariff line level ad valorem duty or AVE.Numberof distinctduty ratesNumber of distinct duty rates. Non-ad valorem duties arealways treated as distinct because AVE calculations wouldalways yield distinct AVEs. For this indicator, however,duties not provided are not included in the count.Coefficientof variationStandard deviation of tariff line duty rates dividedby the simple tariff line level average of all dutyrates. Includes only ad valorem duties or AVEs.Number ofMFN appliedtariff linesTotal number of MFN applied tariff linesWTO ITC UNCTADWorld Tariff Profiles 2021
Only duties and imports recordedunder HS Chapters 01–97 are takeninto account. Each applied tariffschedule is validated against thestandard nomenclature at the HSsix-digit subheading level of the HSversion adopted by the country for thereference year. National tariff lines thatdo not follow this standard (i.e., thefirst six digits should be based on thestandard subheading nomenclature ofthe HS version used by the country) arediscarded and not taken into account.On the other hand, missingsubheadings are added. Hence,WTO ITC UNCTADWorld Tariff Profiles 2021I SUMMARYTABLESTechnical notesall calculations are based on thecomplete standard nomenclature. Allsimple averages are based on preaggregated HS six-digit averages.Pre-aggregation means that duties atthe tariff line level are first averagedto HS six-digit subheadings.Subsequent calculations are basedon these pre-aggregated averages.To the extent possible, non-ad valoremduties are converted into ad valoremequivalents. The methodology used forthe conversion is in Technical Annex Bof World Tariff Profiles 2006.Download the data:www.wto.org/statistics7
All productsSummary TablesAll productsCountry/Territory1Year nia2020Algeria2019Duty-freeNon ad valorem dutiesBoundMFNappliedBoundMFNapplied4567in %MFNappliedBoundDuties 15 %MFNappliedBoundShare of HS 6 digit subheadings in per Antigua and .113.20.0Azerbaijan2019Bahrain, Kingdom rus8.72019BelizeBenin2020Bhutan2019Bolivia, Plurinational State of2020Bosnia and 10031.413.31.05.10096.4Brunei Darussalam201995.525.40.2095.80.30.395.30.0Burkina 568.612.80.837.700.919.441.8Cabo 7.06.561.435.7Central African o15.816.827.4012.203.414.30.3098.80.872.814.8Cook Islands2019Costa Rica202010043.15.62.051.60096.01.2Côte 421.610.12.06.60014.96.3Democratic Republic of the .30.00Dominica92.159.5001.199.692.1Dominican .10.20.269.821.7El 94.319.27.714.360.402.739.220.629.2European 70053.046.8The mala8Simple 0097.638.6Download the data:www.wto.org/statisticsWTO ITC UNCTADWorld Tariff Profiles 2021
Concessionsnot yetimplementedin 2020Duties 3 * AVGMFNappliedBoundNumber of distinct dutyratesMFNMFN appliedBoundappliedMaximum dutyBoundSummary TablesAll productsCoefficient of variationBoundMFNapplied1920Share of HS 6 digit subhdgs in per cent1213144.709.915160700200.117186015960Number ofMFNappliedtariff a0.26.8022070321438946,705Antigua and 12510,237Azerbaijan0200200410401897,520Bahrain, Kingdom 0.706.41000402.34016271211477807,896Bolivia, Plurinational State of13410,320Bosnia and 055353214287310,299Brazil0.24.20 1000121272513385011,205Brunei DarussalamBurkina urundi2.16.2055551214811296,138Cabo CanadaCentral African 6838,548China0.80227985115592.20.2020301.1147 ok Islands2652 1000Congo0.11.2023315019133616110,528Costa Rica0.100643515559616,128Côte 4Democratic Republic of the 312351337,241Dominican Republic0.20.80868619230391038,001Ecuador0.44.20 1000 7El 3031920011869431891719,482European Union0.10.70596 10359521616,128The nea-BissauWTO ITC UNCTADWorld Tariff Profiles 202127I SUMMARYTABLESAll products47GuatemalaDownload the data:www.wto.org/statistics9
All productsSummary TablesAll productsCountry/Territory1Year ofMFNappliedtariffBindingcoverage23Duty-freeNon ad valorem dutiesBoundMFNappliedBoundMFNapplied4567in %MFNappliedBoundDuties 15 %MFNappliedBoundShare of HS 6 digit subheadings in per 1.95.81.950.70089.80.7Hong Kong, 6Iran2019Israel2020Jamaica10Simple .410.7Kiribati2019Korea, Republic of20200100.016.216.90.20.60Kuwait, the State of201999.997.94.72.110.501.697.80.2Kyrgyz Republic202099.97.56.619.615.20.59.33.01.1Lao People's Democratic Republic201910019.28.61.11.700.157.1Lebanese 6Liberia202010026.712.10.11.70086.538.6Macao, 8.712.16.039.55.16.309.58.4Micronesia, Federated States of2019Moldova, Republic u2019Nepal201999.41.43.3New .6North 22.85.13.83.816.956.80.22.30.167.91.0Papua New .3Qatar202010015.75.13.010.50017.80.7Download the data:www.wto.org/statisticsWTO ITC UNCTADWorld Tariff Profiles 2021
Concessionsnot yetimplementedin 2020Duties 3 * AVGMFNappliedBoundNumber of distinct dutyratesMFNMFN appliedBoundappliedMaximum dutyBoundSummary TablesAll productsCoefficient of variationMFNappliedBoundShare of HS 6 digit subhdgs in per cent121314151617181920Number ofMFNappliedtariff 311447,235HondurasGuyana0000011007,583Hong Kong, 88788720413633841712,563Korea, Republic of00.2010010024201137,507Kuwait, the State of0.10.5018718750403788612,284Kyrgyz Republic0.74.10.490401811598411,512Lao People's Democratic Republic8.12016,146Lebanese 12538616,128Liberia0000011006,640Macao, ,180Malawi1.713.10 1000 nesia, Federated States ofMoldova, Republic Nauru1.272 101181377,926New 1066662932081171289,842North Macedonia6.64.90 1000 .001851577060572525,829Papua New .702001001651091597,641Qatar 1000WTO ITC UNCTADWorld Tariff Profiles 2021I SUMMARYTABLESAll productsDownload the data:www.wto.org/statistics11
All productsSummary TablesAll productsCountry/Territory1Year FNappliedBound456Non ad valorem dutiesMFNappliedin %MFNappliedBoundDuties 15 %BoundMFNappliedShare of HS 6 digit subheadings in per cent7891011Russian 2010089.312.51.139.300.796.940.9Saint Kitts and Nevis201995.776.59.1025.800.395.621.7Saint Lucia202099.864.69.2041.700.199.826.1Saint Vincent and the oa09.90.52.155.3Sao Tomé and Principe2019Saudi Arabia, Kingdom lles20201009.82.546.990.800.527.66.4Sierra .09.10.017.3100.00.50.00.50.0Solomon Islands201910078.89.600.51.30.796.30.5South i .77.55.320.931.478.868.66.44.3Chinese 52.7Trinidad and e 20201005.84.530.940.20.10.14.02.8United Arab Emirates202010014.64.63.010.500.90.80.2United States of 202010040.19.23.426.20096.3Venezuela, Bolivarian Republic of201910036.513.804.90099.036.8Viet wnload the 10.788.19.217.515.7WTO ITC UNCTADWorld Tariff Profiles 202129.1
Concessionsnot yetimplementedin 2020Duties 3 * AVGMFNappliedBoundNumber of distinct dutyCoefficient of variation Number ofratesMFNMFNMFNMFN appliedBoundBoundappliedappliedappliedtariff linesMaximum dutyBoundShare of HS 6 digit subhdgs in per cent121314Summary TablesAll nda0.12.802501002328251096,292Saint Kitts and Nevis0.39.002501003717461306,552Saint Lucia0.35.702501003812461046,504Saint Vincent and the Grenadines0.2609435,504Sao Tomé and Principe0.104220525Russian FederationSamoa0.21.00 1000 10001092619441212,689Saudi Arabia, Kingdom ychellesSierra 80.40.00 1000965884484,21510,812Singapore0.10.30 10002518084261586,285Solomon IslandsSouth Africa3.39.60597716582401301717,9390.018.90175 100054128632207,497Sri Lanka06.204050211050936,289Suriname5.14.20 1000 671772122119,135Chinese Taipei0.8029100.701201081280955,683Tanzania0.94.80 020061914TajikistanTogo14TongaTrinidad and 91137,579United Arab Emirates7.47.203503501323114529425911,610United States of kistan4.0164 417111,168Venezuela, Bolivarian Republic of2.66.51356437113121020011,090Viet mbabwe6.3WTO ITC UNCTADWorld Tariff Profiles 2021 1000490I SUMMARYTABLESAll products196Download the data:www.wto.org/statistics13
Agricultural productsSummary TablesAgricultural productsYear ty-freeAlbania2020Algeria2019Non ad valorem BoundDuties 15 %MFNappliedBoundShare of HS 6 digit subheadings in per 20069.9Angola201952.719.3029.50094.341.7Antigua and aijan2019Bahrain, Kingdom zeBenin2020Bhutan2019Bolivia, Plurinational State of2020Bosnia and 1.946.1013.772.622.6Brazil202035.410.12.77
Electrical chinery Clothing Transport uipment Chemicals Textiles Non-electrical chinery Leather, ootwear, tc. Manufactures, .e.s. Wood, aper, tc. Minerals tals SPECIAL TOPIC Non-tariff measures: Estimating analytical indicators using UNCTAD's Trade Analysis Information System (TRAINS) About this publication World Tariff Profiles is a co-publication of the WTO, ITC and UNCTAD on market access .