Transcription
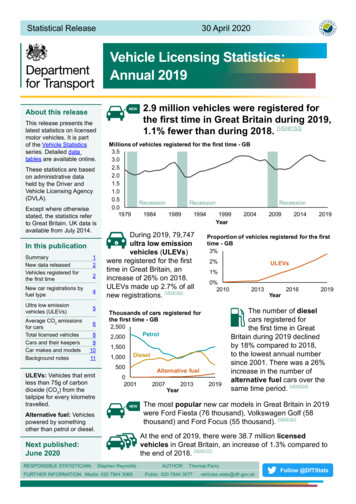
Statistical Release30 April 2020Vehicle Licensing Statistics:Annual 2019NEWAbout this releaseThis release presents thelatest statistics on licensedmotor vehicles. It is partof the Vehicle Statisticsseries. Detailed datatables are available online.These statistics are basedon administrative dataheld by the Driver andVehicle Licensing Agency(DVLA).Except where otherwisestated, the statistics referto Great Britain. UK data isavailable from July 2014.In this publicationSummaryNew data releasedVehicles registered forthe first time122New car registrations byfuel type4Ultra low emissionvehicles (ULEVs)5Average CO2 emissionsfor carsTotal licensed vehiclesCars and their keepersCar makes and modelsBackground notes6891011Millions of vehicles registered for the first time - 841989199419992004YearDuring 2019, 79,747ultra low emissionvehicles (ULEVs)were registered for the firsttime in Great Britain, anincrease of 26% on 2018.ULEVs made up 2.7% of allnew registrations. [VEH0150]1,50002001NEWAlternative fuel: Vehiclespowered by somethingother than petrol or diesel.Year201320142019ULEVs1%0%2010Alternative fuel2007200920192013Year20162019The number of dieselcars registered forthe first time in GreatBritain during 2019 declinedby 18% compared to 2018,to the lowest annual numbersince 2001. There was a 26%increase in the number ofalternative fuel cars over thesame time period. [VEH0253]The most popular new car models in Great Britain in 2019were Ford Fiesta (76 thousand), Volkswagen Golf (58thousand) and Ford Focus (55 thousand). [VEH0161]At the end of 2019, there were 38.7 million licensedvehicles in Great Britain, an increase of 1.3% compared tothe end of 2018. [VEH0101]Next published:June 2020RESPONSIBLE STATISTICIAN:2%Diesel1,000RecessionProportion of vehicles registered for the firsttime - GB3%Thousands of cars registered forthe first time - GB2,500Petrol2,000500ULEVs: Vehicles that emitless than 75g of carbondioxide (CO2) from thetailpipe for every kilometretravelled.2.9 million vehicles were registered forthe first time in Great Britain during 2019,1.1% fewer than during 2018. [VEH0153]Stephen ReynoldsFURTHER INFORMATION: Media: 020 7944 3066AUTHOR:Thomas ParryPublic: 020 7944 3077vehicles.stats@dft.gov.ukFollow @DfTStats
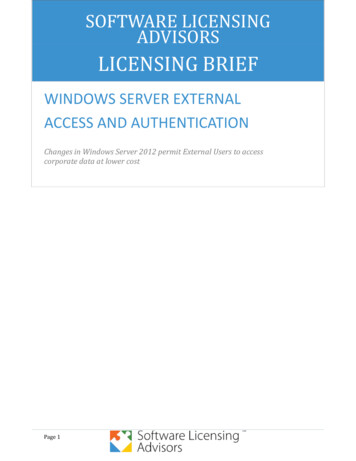
New data releasedThis release includes a number of new and enhanced data tablesrelating to ultra low emission vehicles (ULEVs) and additionalbreakdowns by propulsion / fuel type for all main body types.This initiative has been put in place to meet the growing need fromusers for regularly updated datasets on the fast developing trends forvehicles using alternative fuels, particularly on a geographical basis.Ultra low emission vehicles (ULEVs) VEH0132: Licensed ULEVs by local authority, including abreakdown for battery electric vehicles (BEVs) and plug-inhybrid electric vehicles (PHEVs), and a breakdown for privateand company keepers for the latest quarter (enhanced). VEH0133: Licensed ULEVs by body type and propulsion / fueltype, including top 20 licensed models at the end of the latestquarter (new). VEH0134: Licensed ULEVs by postcode district (with BEV andPHEV breakdown) (new). VEH0171: New ULEV registrations by body type and propulsion/ fuel type, including top 20 models for the latest year (new). VEH0172: New ULEV registrations by region (new).Propulsion / fuel typeA consistent propulsion / fuel type table has been introduced for allbody types, with an enhanced layout for cars and vans.This has resulted in an enhanced version of VEH0203, VEH0253,VEH0403, and VEH0453, as well as new tables VEH0303, VEH0353,VEH0503, VEH0553, VEH0603, and VEH0653.GeographyVehicles are allocated to alocal authority according tothe postcode of the registeredkeeper. This is the keeper’saddress for privately ownedvehicles or the company’sregistered address forcompany owned vehicles. Theaddress does not necessarilyreflect where the vehicle islocated. This is especiallytrue for large fleets kept bycompanies involved withvehicle management, leasingor rentals. Significant changesin the number of vehiclesfrom year to year can oftenoccur when these companieschange their registeredaddress.There are several hotspotsof ULEVs registered tocompany addresses thatdistort the geographicdistribution of these figures.These include the followinglocal authorities: Birmingham,Forest of Dean, Leeds,Leicester, Milton Keynes,Peterborough, Portsmouth,Renfrewshire, Slough, SouthGloucestershire and Swindon.Table VEH0132d shouldhelp illustrate whether anyparticular area is affected.Vehicles registered for the first timeDuring 2019, 2.9 million vehicles were registered During 2.9 millionfor the first time in Great Britain. [VEH0150]2019 vehiclesregistered forNew vehicle registrations have been declining for the past threeNEWthe first time inyears, mainly due to the fall in new car registrations (which typicallyGreat Britainrepresent around 80% of new registrations). In 2019, overall newregistrations were 1.1% lower than during 2018, 6.5% lower thanduring 2017, and 12.0% lower than during 2016, which was the highest recorded level ever.Body TypeHeavy goods vehicles (HGVs), which includes vehicles such as motor homes, saw a largeincrease in new registrations during 2019 of 11.0% compared to 2018, as shown in Figure 1. ThisVehicle Licensing Statistics: Annual 2019 - Page 2
was impacted by the introduction of mandatory smart tachographs duringthe year. Bus & coach registrations fell by 11.4% over the same period,largely due to a reduction in minibus registrations during early 2019.[VEH0150]EuropeAccording to figures produced by ACEA (see side bar): “Overall in 2019,new car registrations increased by 1.2% across the European Union,reaching more than 15.3 million units in total. Looking at the five majorEU markets, Germany ( 5.0%) recorded the largest increase last year,followed by France ( 1.9%) and Italy ( 0.3%). By contrast, both Spain(-4.8%) and the United Kingdom (-2.4%) saw demand fall in 2019.” [ACEA]Figure 1: Annual percentage change in vehicles registered for thefirst time compared to 2018 by body type, Great Britain, 2019 [VEH0150]All -5%0%5%Annual percentage change - GB10%15%Although the number of new registrations in Great Britain can varyconsiderably each year, the total vehicle stock varies much more slowlyas there are many more vehicles that remain licensed over the year.Table 1: Vehicles registered for the first time by body type, withprevious year and total stock comparison, Great Britain, 2019 [VEH0101,VEH0150]Thousand / Percentage2019Proportion ofall newNewregistrations registrationsLight goodsvehicles (LGVs)Heavy goodsvehicles (HGVs)MotorcyclesBuses &coachesOtherUK data is provided byThe Society of MotorManufacturers andTraders (SMMT), whichrepresents new carsales rather than newregistrations with DVLA,so the figures will bebroadly comparable butwill not match.Monthly seasonality-2.0%LGVsCarsThe ACEA (EuropeanAutomobileManufacturers’Association) producenew registration figurescollected from tradebodies across Europe.-1.1%CarsBuses & coachesACEA2018Proportion ofall newNewregistrations registrationsTotalstock atthe endof 7Vehicle Licensing Statistics: Annual 2019 - Page 3Up to 1998, newregistration plates wereissued once a year inAugust, causing a peakin new registrations in thethird quarter.Since 1999, new plateshave been issued twicea year, in March andSeptember. This changedthe distribution of newregistrations through theyear, with peaks in thefirst and third quarters.INSET: Vehiclesregistered for the firsttime by month, GreatBritain, 2019 [VEH0150]Thousands of vehiclesregistered for the first -19556106195
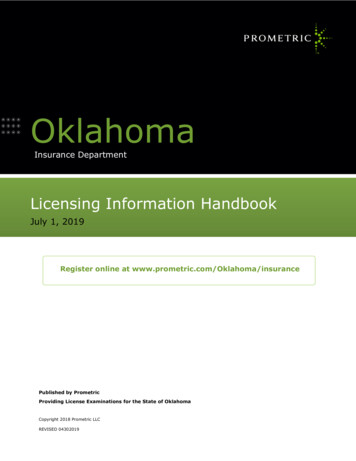
New car registrations by fuel typeNew diesel car registrations continue to declinesharply in Great Britain, with large increases seenfor alternative fuel cars. [VEH0253]There was a 18% decline in thenumber of diesel cars being registeredfor the first time in 2019 compared to2018, falling to 605 thousand cars,which is below the 2008/09 recession dip andsimilar to 2002 registrations.Key events aroundthe decline in newdiesel carsApril 2017: changes areintroduced for newlyregistered car tax bandsand rates.New car registrationsAnnual change in 2019 - GBDiesel Petrol Alt. fuelJuly 2017: UK Planfor Tackling RoadsideNitrogen DioxideConcentrations isannounced, endingthe sale of all newconventional petrol anddiesel cars and vans by2040.-18% 3% 26%Compared to 2018 new registrations, petrol cars increased by 3% andalternative fuel cars increased by 26% in 2019.Figure 2: Cars registered for the first time by fuel type, Great Britain,2001 to 2019 [VEH0253]November 2017:Transport for Londonannounces the “world’sfirst Ultra-Low EmissionZone” - although newdiesel cars would notbe charged under thecurrent plan.Thousands of cars registered for the first time - ive fuel200420072010Year201320162019Battery electric new car registrations more thandoubled in Great Britain, which contrasts with asharp decline in plug-in hybrid electric cars. [VEH0253]Electric VehicleCharging DeviceStatisticsThe Department forTransport publishesstatistics on the numberof publicly availableelectric vehicle chargingdevices in the UK.In 2019, out of all new alternative fuel car registrations, there were 112thousand hybrid electric (HEVs), 38 thousand battery electric(BEVs), 35 thousand plug-in hybrid electric (PHEVs), and lessDoes the vehiclethan one thousand using other fuel types.use petrol orThe number of battery electric cars registered for the first time in2019 more than doubled ( 141%) compared to 2018, affectedby the release of Tesla Model3 and strong growth for otherDoes the vehicleYes, and is ause electric power?plug-inpopular models.Hybrid electric cars increasedby 30% in 2019 compared to2018, whereas the numberof plug-in hybrid electric carsdecreased by 17%.diesel?YesNoPlug-in hybrid1electric (PHEV)Battery electric(BEV)Yes, but isnot a plug-inHybrid electric(HEV)Fuel cell electric(FCEV)NoPetrol / DieselOther*1. A range-extended electric vehicle is a special case of PHEV, where the conventional fuel doesnot power the wheels directly, usually only charging the battery for additional range.* This table excludes rare combinations based on biofuels and other emerging technologies.Vehicle Licensing Statistics: Annual 2019 - Page 4
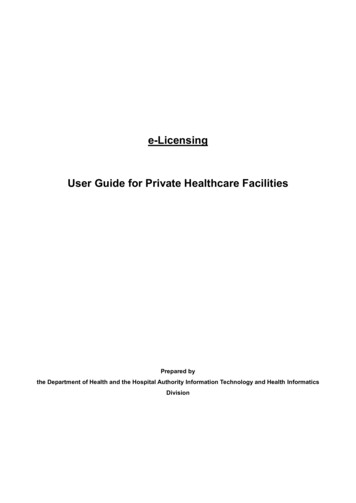
Ultra low emission vehicles (ULEVs)This section relates to the United Kingdom rather than Great Britain.Large increases in new battery electric ULEVspush total new ULEV numbers up in the UK. [VEH0171]In 2019, 80,578 ULEVs were registered for the first timein the United Kingdom, an increase of 26% on 2018 and52% on 2017. ULEVs accounted for 2.7% of all new vehicleregistrations, up from 2.1% in 2018. [VEH0150]In 2019, the most common generic model of ULEV registered for the firsttime in the UK was the Tesla Model 3 with 10,649 vehicles, followed bythe Mitsubishi Outlander with 6,195 vehicles and the Nissan Leaf with5,280 vehicles. [VEH0171]Figure 3: ULEVs registered for the first time by fuel type, UnitedKingdom, 2010 to 2019 [VEH0171]ULEVs registered for the first time - UK90,000Battery electric vehicle (BEV)75,000Plug-in hybrid electric vehicle (PHEV)60,000Annualchangein 2019Other fuel types 140%45,00030,000 16%15,0000Key eventssurrounding theuptake of newULEV registrations2011/2012: plug-in carand van grants areintroduced, reducing thecost of new qualifyingmodels. These wereexpanded to cover morebody types in March2016.July 2018: Road to ZeroStrategy is announced,confirming thegovernment’s ambitionto see at least half ofnew cars to be ultra lowemission by 2030.October 2018: Thegovernment announcedthat changes would bemade to the plug-in cargrant, focusing on batteryelectric vehicles. 41%20102011201220132014 2015Year2016201720182019Figure 4: Top 20 generic models for ULEVs registered for the first time by fuel type, UnitedKingdom, 2019 [VEH0171]Thousands of ULEVs registered for the first time - UKTESLA MODEL 3MITSUBISHI OUTLANDERNISSAN LEAFBMW 3 SERIESBMW 5 SERIESBMW I3JAGUAR I-PACELAND ROVER RANGE ROVERVOLKSWAGEN GOLFMINI COUNTRYMAN2.4RENAULT ZOE2.1LEVC TX1.9NISSAN E-NV2000.71.1KIA NIRO1.6VOLVO XC901.5BMW 2 SERIES0.9HYUNDAI IONIQ 0.51.3MERCEDES E CLASS1.3TESLA MODEL X1.2TESLA MODEL S10.66.25.34.54.44.10.34.24.03.83.8Battery electric vehicle (BEV)Plug-in hybrid electric vehicle (PHEV)Range-extended electric vehicleVehicle Licensing Statistics: Annual 2019 - Page 5
Table 2: ULEVs registered for the first time by body type, with previous year andtotal new registrations comparison, United Kingdom, 2019 [VEH0170]Number / PercentageNew ULEV registrationsCarsLight goods vehicles (LGVs)Heavy goods vehicles (HGVs)MotorcyclesBuses & 541,60612668901,250Annual percentage Proportion of all newincrease (2019) registrations (2019)213.11261.0581551.4341.7803.9Number/ PercentageULEVs byNewtheULEVendregistrations5: LicensedAtof 2019, there were 269 thousand Figurefueltype, UK,Annual[VEH0130]percentageProportionof 2019all newultra low emission vehiclesintheUK.increase (2019) registrations (2019)20192018[VEH0133]There were 36% more72,853licensed ULEVsCars60,254 at the end21Range-extendedof vehicles2019 comparedto the3,625previous 1,606year, where there 126electricLight goods(LGVs)5%were198 thousand.Heavy goodsvehicles(HGVs)191258Motorcycles1,706 at the end668 of 2019 were 155Thevast majority of ULEVs licensedBuses&coaches12190either PHEVs (53%) or BEVs (39%). A small proportionwere 34Other1,250range-extendedelectric vehicles2,254(5%), whichis currently only 80available in a small selection of models. [VEH0133]In the UK, at the end of 2019, ULEVs accounted for 0.7% ofall licensed vehicles. Regionally, the highest rate was seenin London with 1.3% and the lowest was in the North East,Northern Ireland and Wales, each with 0.3%. [VEH0101, VEH0130]39%Other3.11.03%1.41.73.9LicensedULEVs by rage CO2 emissions for carsAverage CO2 emissions of cars registered forthe first time have been affected by regulationand market changes over the past few years.Average CO2 emissions of cars registered for the firsttime in Great Britain steadily fell between 2003 and2016, but then began to increase, with a shift towardsregistering larger cars (which have higher reported emissions)and increases in reported emissions for popular petrol car models(Figure 6). [VEH0150]Changes to the official measurement procedure used, from NEDC toWLTP (see side bar), to determine car CO2 emissions have causeda number of discontinuities to the time series from September 2018onwards, which have complicated the interpretation of recent trends.These changes are summarised in Table 3 and the side bars.Vehicle Licensing Statistics: Annual 2019 - Page 6Methods used tomeasure CO2 emissionsNew European Driving Cycle(NEDC): Original laboratorytest based on theoreticalbehaviour.Worldwide HarmonisedLight Vehicle Test Procedure(WLTP): More advanced labtest to replace NEDC, basedon real driving data.NEDC correlated value: Thisvalue has been calculatedusing the results of a WLTPtest via the COM2PAS tooldeveloped by the EuropeanCommission, for tax andemissions monitoringpurposes.
Figure 6: Average CO2 emissions for cars registered for the firsttime, monthly, Great Britain, Dec 2012 to Dec 2019 [VEH0150]Grams per kilometre (g/km) - GB140Transitionperiod causesbreak in onof 7Dec-18Dec-19Table 3: The use of different testing systems for average reportedCO2 emissions of new cars, United KingdomNamePeriodTestingsystem usedFigure used whenregisteredNEDC / Pre-WLTPUp to August 2018NEDCNEDCTransition periodSeptember 2018 toDecember 2018WLTPNEDC and NEDCcorrelatedSome NEDC testedvehicles allowed to beregisteredWLTPJanuary 2019 onwardsWLTPNEDC correlatedWLTP figure will be usedfrom April 2020 onwardsNotesVED bands [VEH0256]Prior to 2011, over 90% of cars registered for the first time each yearhad emissions above 110 g/km. This percentage had dropped to 59% by2015, following increases in new ULEV and HEV registrations. However,a market shift to registering larger cars (e.g. SUVs) began to reversethis trend between 2015 and 2019, as illustrated in Figure 7. Therewas a marked shift back towards lower emission vehicles in the last twoquarters of 2019. [VEH0256]Figure 7: Cars registered for the first time by CO2 emission / VEDband, quarterly, with insert for lowest four bands, Great Britain, 2003Q4 to 2019 Q4 [VEH0256]Proportion of cars registered for the first time - GB100%90%VED bandsystem changedUnknown80%INSET: Lowest fourbands10%8%70%60%6%50%51-75 g/km40%4%30%2%20%10%0%2003 Q476-90 g/km2007 Q42011 Q42015 Q42019 Q41-50 g/km0 g/km0%2019 Q4Vehicle Licensing Statistics: Annual 2019 - Page 7Break in series foraverage reportedCO2 emissions ofcarsThe “NEDC correlated”figure is not directlycomparable with theNEDC figure as theirunderlying methodologiesare different.Table 3 illustrates whichtime periods are notdirectly comparable as aresult: Up to August 2018 September 2018 toDecember 2018 January 2019onwardsVED bandsVehicle Excise Duty(VED) is charged onvehicles registered in theUK.Since March 2001, carVED has charged inbands on the basis oftheir CO2 emissions(NEDC).From April 2017, the CO2emission bands for VEDwere revised.From April 2020, whilstthe VED bands did notchange, the emissionsused to allocate a bandchanged to use WLTPfigures. This change willnot be reflected in thesestatistics until 2020 Q2.
Total licensed vehiclesAt the end of 2019, there were 38.7 millionAt the end 38.7 millionlicensed vehicles in Great Britain, a 1.3%vehicles licensedof 2019[VEH0103]for use on roadsincrease compared to the end of 2018.in Great BritainThe number of licensed vehicles at the end of the year hasincreased in all but one year (1991) since the end of theSecond World War.Figure 8: Licensed vehicles at theend of the year, Great Britain, 1950to 2019 [VEH0103]Millions of licensed vehicles - GB ure 9: Annual percentagechange in licensed vehiclesby body type, Great Britain,end of 2019 [VEH0101]All es &-1.9%coaches-4% -2% 0% 2% 4%Annual percentage change - GBAll body types apart from buses & coaches saw an increase in overalllicensed vehicles since the end of 2018. The largest percentage increasewas for LGVs at 2.8%, which has been sustained for a number of years.There was a 1.9% fall in the buses & coaches fleet in 2019, whichreflects the 11.4% decline in the number of new registrations during2019. [VEH0101]Figure 10: Index of licensed vehicles at the end of the year by bodytype, Great Britain, 1994 to 2019 [VEH0101]25 year change to 2019GB Index: 1994 100200LGVs 93%180Motorcycles 73%160All vehicles 53%Cars 50%140120HGVs 19%100Buses & coaches 1%19992004Year2009Figures on total licensedvehicles have slowervariations compared tovehicles registered forthe first time as there aremany more vehicles thatremain licensed over theyear.0.6%Cars make up the majority of licensed vehicles. There were 31.9 millioncars (82.4%), 4.1 million LGVs (10.7%), 0.50 million HGVs (1.3%), 1.3million motorcycles (3.2%), 0.15 million buses & coaches (0.4%), and0.77 million other vehicles (2.0%) licensed at the end of 2019. [VEH0101]801994How are thesedifferent from newregistrations?20142019Vehicle Licensing Statistics: Annual 2019 - Page 8MotorcyclesThe number of licensedmotorcycles fluctuatesconsiderably by quarter,with higher numberslicensed at the end ofJune and Septembercompared to the end ofMarch and December.This is consistent withriders typically licensingtheir motorcycle for6 months during thesummer months but notduring winter.The National TravelSurvey provides moreinformation on motorcycleuse.
The average age of a licensed car in Great Britain was 8.3 years atthe end of 2019. [VEH0211]Petrol cars were older, with an average age of 9.1 years compared with 7.3 years for diesel cars.The average age of licensed LGVs was 8.3 years, HGVs was 7.4 years, buses & coaches was10.9 years, and for motorcycles was 15.0 years. [VEH0211, VEH0311, VEH0411, VEH0511, VEH0611]Figure 11: Licensed vehicles at the end of the year by body type and year of firstregistration (1995 onwards), Great Britain, 2019 [VEH0211, VEH0311, VEH0411, VEH0511, VEH0611]Vehicles registered before 1995 have been omitted for simplicity. They account for a small proportion of all licensed vehicles.Proportion of licensed vehicles (1995 onwards) - GBProportion of licensed vehicles (1995 onwards) - GB12%12%10%10%Diesel cars8%8%6%0%2019LGVsBuses & coaches6%Petrol cars4%2%HGVs4%Motorcycles2%2015201120072003Year of first registration199919950%20192015201120072003Year of first registration19991995Cars and their keepersCompany kept cars are a primary driver of newregistrations for cars. [VEH0202, VEH0252]During 2019, 59% of cars registered for the first time had acompany keeper. However, the proportion of licensed cars atthe end of 2019 kept by companies was much lower at only 9%.This illustrates that company-kept cars registered for the first timebecome privately-kept within a few years. The proportion of companykept cars in the fleet has remained relatively stable between 8-10% since1994.Over the last 10 years, the number of female registered keepersof licensed cars had increased by 17%, compared with anincrease of only 9% in male keepers. Women now account for35% of registered car keepers with men accounting for 50%.For privately-kept vehicles where the keeper’s gender is recorded, 59%are male and 41% are female at the end of 2019. Overall, privately-keptcars, including those where the gender is unknown, accounted for 89%of all cars at the end of 2019, with those between keepers accounting for2%.Vehicle Licensing Statistics: Annual 2019 - Page 9Who is a registeredkeeper?Every registered vehicle,unless it is in the processof changing hands, has aregistered keeper, whosedetails are held by DVLA.Note that the registeredkeeper of a vehicle is notnecessarily the personwho uses it, and thevehicle is not alwaysbased at the keeper’scontact address. Thisis particularly truefor company or fleetvehicles.
Car makes and modelsFord remained the most common make for new car registrations inGreat Britain during 2019. [VEH0260]During 2019, the top five makes were Ford (10%), Volkswagen (9%), MercedesBenz (7%), BMW (7%), and Vauxhall (7%). The equivalent top five for 2018 wereFord (11%), Volkswagen (8%), Vauxhall (7%), Mercedes-Benz (7%) and BMW (7%). [VEH0260]There were 17 makes with over 50 thousand cars registered for the first time each in 2019,accounting for 84% of all new car registrations. [VEH0260]For total licensed stock at the end of 2019, the top five makes were different to new registrations,namely Ford (13%), Vauxhall (10%), Volkswagen (9%), BMW (6%), and Audi (5%). [VEH0210]There were 21 makes with over 500 thousand licensed cars each, accounting for 92% of alllicensed cars. [VEH0210]Figure 12: Top five makes for cars registered for the first time during 2019 and for thoselicensed at the end of 2019, Great Britain [VEH0210, VEH0260]Other smallermakes16%Other %7%New carregistrationsby make43%7%Mercedes-BenzBMW49%7%9%Licensed carsby makeVolkswagen6%BMW5%Vauxhall12 makeswith over 50 thousand16 makes withover 500 thousandAudiFord Fiesta was the most common new car registration in 2019, with 76 thousand registered forthe first time. This was followed by Volkswagen Golf with 58 thousand and Ford Focus with 55thousand. [VEH0161]Land Rover Range Rover and Nissan Qashqai were fifth and sixth respectively (52 and 51thousand) despite their makes only accounting for 3% and 4% of all new car registrations. [VEH0161]At the end of 2019, the most common licensed car was Ford Fiesta, with 1.5 million cars licenced,followed by Ford Focus with 1.2 million, and Vauxhall Corsa with 1.1 million. [VEH0128]Figure 13: Top five generic models for cars registered for the first time during 2019 and forthose licensed at the end of 2019, Great Britain [VEH0128, VEH0161]Millions of licensed carsThousands of cars registered for the first timeFORD FIESTA76VOLKSWAGEN GOLFFORD FOCUSVAUXHALL CORSALAND ROVER RANGE ROVER58FORD FIESTAFORD FOCUS55VAUXHALL CORSA54VOLKSWAGEN GOLF521.5VAUXHALL ASTRAVehicle Licensing Statistics: Annual 2019 - Page 101.21.11.00.9
Background notesAbout these statisticsAlmost all the statistics in the vehicle licensing statistics series are derived by Department forTransport statisticians from extracts of the Driver and Vehicle Licensing Agency (DVLA) vehicledatabase. The main purpose of the database is to administer vehicle registration and licensingrecords in the United Kingdom.For further information about the data used in this release, please see the detailed notes anddefinitions. There is also a Statement of Administrative Sources for the DVLA vehicles database.A separate note on users and uses of these statistics is available from the vehicles statisticsinformation web page.Strengths and weaknesses of the dataThe DVLA database can be regarded as being virtually complete in terms of the number ofvehicles registered for the first time, licensed vehicles and vehicles with a SORN (StatutoryOff-Road Notification). However, there may be some errors in some of the specific details ofindividual vehicles.The Department for Transport estimates that under 2% of the vehicles records have aninaccuracy in one of the variables used for the statistics published. Other factors to consider ininterpreting these statistics include: Changes in legislation; Revisions to the series; Seasonal variation which affects some vehicle types; Foreign registered vehicles may also use UK roads without being registered with DVLA; Vehicle Excise Duty (VED) evasion.Most of these factors will only have a marginal effect for most uses of the data.GeographyIn July 2014, vehicle and registration services for Northern Ireland were centralised at DVLA,where these services for Great Britain were already administered. This created a single vehicleregister for the United Kingdom, in place of separate registers for Great Britain and NorthernIreland.As a result of these changes, the coverage of the vehicle licensing statistics tables was expandedto cover UK as well as GB where practical. Because of the greater availability of GB time seriesdata, this statistical release will continue to focus mainly on GB rather than UK results for now.For further information, please see the detailed notes and definitions.National StatisticsThese statistics were designated as National Statistics in April 2012. There are a few exceptionslisted on the collection page.National Statistics are produced to the high professional standards set out in the Code of Practicefor Statistics. They undergo regular quality assurance reviews to ensure that they meet customerneeds. They are produced free from any political interference.Vehicle Licensing Statistics: Annual 2019 - Page 11
Details of ministers and officials who receive pre-release access to these statistics up to 24 hoursbefore release can be found in the pre-release access list.Measuring CO2 emissions in new vehicles since 2018Cars registered for the first time from September 2018 onwards were mandated to be testedunder WLTP, resulting in a WLTP-CO2 emissions figure. In 2019, this additional figure wascollected (for the vast majority of cars) at point of first registration using DVLA’s new Register aVehicle (RaV) service.Using this 2019 RaV data, the average WLTP-CO2 emissions for cars registered for the firsttime in the UK was provisionally around 153 g/km, which is around 20% higher than the “NEDCcorrelated”-CO2 figure of 128 g/km.From April 2020 onwards, the WLTP-CO2 figure will be used to determine the VED band for acar, so it is expected that a noticeable change in these figures from 2020 Q2 onwards will beobserved due to the new methodology alone.In addition, the majority of light goods vehicles registered for the first time from September 2019onwards are also mandated to be tested under WLTP rather than NEDC.Recent trendsThere are more recent data than published here available from SMMT on the majority of vehiclesales.SMMT data are published monthly for cars and vans shortly after the month-end, in advance ofthe publication of DfT’s detailed official statistics. This can be useful to look at the most recenttrends in vehicle registrations.Although there are slight differences in coverage of the SMMT data, the volumes and trendspublished by SMMT are generally consistent with DfT published data.More information about the data published by SMMT can be found on their website.Request for feedbackWe welcome any feedback on these statistics, to ensure future releases best meet user needs.Feedback can be provided by email to vehicles.stats@dft.gov.uk.Next releaseVehicle Licensing Statistics are published quarterly. The next release is due in June 2020, whichwill cover the period up to the end of March 2020. The quarterly releases (published June,September, December) have a reduced number of tables and commentary compared to theannual publication (April).Any updates to these plans, including the exact publication date when known, will be advertisedvia the DfT statistical publications schedule.Release of DfT Statistics publicationsTo hear more about DfT statistics publications as they are released, please follow us on Twittervia our @DfTstats account: https://www.twitter.com/DfTstats. T
Vehicle Licensing Statistics: Annual 2019 2.9 million vehicles were registered for % [VEH0153] 0.0 0.5 1.0 1.5 2.0 2.5 3.0 3.5 1979 1984 1989 1994 1999 2004 2009 2014 2019. Millions of vehicles registered for the first time - *% Year. Recession Recession Recession. During 2019, 79,747 . vehicles (ULEVs) were registered for the rst time in Great .