Transcription
International Journal ofEnvironmental Researchand Public HealthArticleAcute Effects of a Speed Training Program onSprinting Step Kinematics and PerformanceKrzysztof Mackala 1, *, Marek Fostiak 2 , Brian Schweyen 3 , Tadeusz Osik 4 and Milan Coch 512345*Department of Track and Field University School of Physical Education in Wroclaw, Poland, Ul.Paderewskiego 35, 51-612 Wrocław, PolandDepartment of Track and Field, Gdansk University of Physical Education and Sport, ul. KazimierzaGórskiego 1, 80-336 Gdansk, PolandPZLA (Polish Track and Field Association), Mysłowicka 4, 01-612 Warszawa, PolandAthletics Department, University of Montana, Adams Center 32 Campus Drive, Missoula, MT 59812, USAFaculty of Sport, University of Ljubljana, Gortanova ulica 22, 1000 Ljubljana, SloveniaCorrespondence: krzysztof.mackala@awf.wroc.pl; Tel.: 48-605-272-433Received: 4 July 2019; Accepted: 24 August 2019; Published: 28 August 2019 Abstract: The purpose of this study was to examine the effects of speed training on sprint stepkinematics and performance in male sprinters. Two groups of seven elite (best 100-m time:10.37 0.04 s) and seven sub-elite (best 100-m time: 10.71 0.15 s) sprinters were recruited.Sprint performance was assessed in the 20 m (flying start), 40 m (standing start), and 60 m (startingblock start). Step kinematics were extracted from the first nine running steps of the 20-m sprintusing the Opto-Jump–Microgate system. Explosive power was quantified by performing the CMJ,standing long jump, standing triple jump, and standing five jumps. Significant post-test improvements(p 0.05) were observed in both groups of sprinters. Performance improved by 0.11 s (elite) and0.06 s (sub-elite) in the 20-m flying start and by 0.06 s (elite) and 0.08 s (sub-elite) in the 60-m startblock start. Strong post-test correlations were observed between 60-m block start performance andstanding five jumps (SFJ) in the elite group and between 20-m flying start and 40-m standing startperformance and standing long jump (SLJ) and standing triple jump (STJ) in the sub-elite group.Speed training (ST) shows potential in the reduction of step variability and as an effective short-termintervention program in the improvement of sprint performance.Keywords: sprinting; speed; sprint exercises; step variability; kinematics1. IntroductionPast investigations have indicated a significant commonality between sprinting performance(across distances from 20 to 100 m) and explosive power [1–5]. As the largest inhibitor in the sprintingmovement is gravity, sprinters must produce large vertical ground reaction force during step take-offto achieve maximal velocity [6]. This is achieved via application of plyometric training as it usesjump-based movements to train and improve explosive power. However, this training modality doesnot involve a running component.A mixture of plyometric characters exercises (skips and bounds) and some speed running drillscreated an alternative sprint-specific running methodology, which represents a high-intensity speedtraining (ST). ST is treated as a low-volume training strategy and credited with producing significantgains in maximal running velocity [7]. This form of training is based on short bouts of all-out sprintsseparated by rest periods from 90 s to 5–6 min to enhance post-exercise recovery and avoid fatigue,including central nervous system fatigue [8–10]. Similar in one regard to plyometrics, sprint-specificrunning also involves a rapid eccentric movement followed by a short amortization phase that isInt. J. Environ. Res. Public Health 2019, 16, 3138; rph
Int. J. Environ. Res. Public Health 2019, 16, 31382 of 13then followed by an explosive concentric movement [6]. This enables the synergistic muscles toengage the myotatic-stretch reflex during the stretch-shortening cycle [11]. Such a training stimulusactivates the elastic properties of the muscle fibers and connective tissue, allowing the muscles tostore more elastic energy [11–13]. This then enhances the release of the accumulated mechanicalenergy during step take-off, a process which is easily visible during skipping and speed bounding.Hence, improvements in elastic energy storage via ST could be interrelated with improvements insingle sprint step performance and, therefore, maximal velocity.Running velocity is a product of step frequency (SF) and step length (SL) [3,14,15] in whicha step defines half a running cycle or the interval between ground contact of one foot to the momentwhen contact is made by the opposing foot [16]. SF and SL are mutually interdependent in whichan increase in SL results in a decrease in SF and vice versa [17–21]. Both variables are determinedby anthropometric characteristics, movement regulation processes, motor abilities, and energeticprocesses [16,22]. Hence, the relationship between SF and SL is unique for each sprinter [19,23].Previous research investigating the interaction between SL and SF in running has generally beeninconclusive. There is much debate as to whether sprinters achieve greater benefits from increased SLor SF. Nonetheless, the strong interdependency between SL and SF and performance at sub-maximaland maximal velocities posits that these are important outcome measures when assessing variability insprinting technique [3,24]. In addition, little is known on how other kinematic variables such as flightphase time, ground contact time, and step velocity interact and influence maximal running velocity.The fundamental goal of this study was to investigate the potential effects of acute ST on sprintsteps kinematics—how these spatial-temporal characteristics can influence sprint running. A secondarygoal was to examine performance including maximal running velocity and power of lower extremity.Sprinters of different competitive levels were recruited to better generalize the results of the study.To mitigate the effects of overtraining, only eight sessions were administered in two 10- and 12-daymodules separated with 10 days of recovery. Furthermore, the intervention was administered duringthe pre-season period to avoid additional confounding variables. A pre-test/post-test design wasadopted and included a wide battery of tests and exercises commonly applied in sprint training.Based on this consideration, it was hypothesized that the information of selecting the relevantbiomechanical parameters obtained after high-speed training, may indicate the elite of the sprinters(seniors and 100 m 10.50 s) will show less variability of the sprinting step in the 20-m sprint froma flying start than the sub-elite sprinters (juniors and 100 m 10.50 s).2. Materials and Methods2.1. ParticipantsSeven elite and seven sub-elite healthy male sprinters with a minimum of four to five years ofregular sprint training were recruited. Sprinters participating in the experiment were members ofthe national team. For the purposes of the experiment, they were divided into two groups: Elite andsub-elite. The main division criterion was age (juniors up to 19 years, seniors above) and the personalbest times in the 100 m sprint (below 10.50 s—elite). Each participant was medically cleared toparticipate in sprint training and presented no orthopedic or physiological limitation or injury thatcould affect sprint performance. All participants had previous experience (minimum six months)in sprint-related strength, speed, and plyometrics training before enrollment. Written consent wasobtained after the protocol and procedures were explained in full. Parental consent was also obtainedfrom those individuals under 18 years of age. Sprinters were instructed to maintain their normal intakeof food and fluids during the study period. Additionally, they were instructed to avoid any strenuousphysical activity 24 h prior to testing as well as refrain from eating 3 h before test commencement.The study design was approved by the Institutional Ethics Committee.
Int. J. Environ. Res. Public Health 2019, 16, 31383 of 132.2. DesignThe study was performed over a four-week period during the pre-season (April–May) justprior to the outdoor racing season. All participants had been engaged in a standard sprinttraining regimen (five to seven days of a weekly microcycle) from October to November untilinclusion in the study. This training regimen involved general and specialized fitness exercisesdesigned to enhance sprinting technique, increase maximal velocity, and develop strength, power,and endurance. Additionally, many of the participants competed during the indoor competition season(January–February).Eight ST sessions were executed in a 10-day and then 12-day module (Table 1). The moduleswere separated by 10 days of recovery training with minimal load to promote central nervous systemregeneration. ST in the first 10-day module was executed every other day and in the 12-day module everythird day. The days with training involved the main SST workout and one short supplementary workout(general fitness) with the order reversed in each subsequent training session. Post-workout recoverywas also provided and predominately involved massage treatment and low-intensity swimming.Table 1. Training characteristics of the training modules.Training ModuleType of Exercise Modality10-day Module12-day ModuleNumber of Workouts (n)Strength (combined with a shortplyometrics session)PlyometricsSpeedSpeed enduranceTempoGeneral fitness (supplementary session)Recovery (swimming, massage,cryotherapy)Day off (rest)TestingTotal training workouts per module32 41241421455 1136ST focused primarily on developing sprint technique and maximal velocity by various exercisesthat consisted of various skips, bounds, accelerations, starts, and maximal intensity sprints (Table 2).Training duration was approximately 90 min. This included a 20–30 min warm-up of jogging, stretching,light jumping, skipping, and submaximal accelerations and a 10–15 min cooldown. Training loadwas progressively amplified by varying task complexity (running distance or number of foot contactsduring skip and bound exercises) and by increasing running velocity (from 85–90% to 100%).
Int. J. Environ. Res. Public Health 2019, 16, 31384 of 13Table 2. Speed training (ST) characteristics.Module 1ExercisesModule 21stsession2ndsession3rdsession4thsession2 rep.3 rep.2 rep.2 rep.2 rep.3 rep.2 rep.2 rep.3 rep.3 rep.3 rep.4 rep.5thsession6thsession7thsession8thsessionSub maximal speed(85–90%)10 m skip A 20 macceleration10 m skip C 20 macceleration20 m sprint bounding 20m accelerationFalling start 20 mbuild-upBlock starts 20 m build-up40 m acceleration3 rep.2 rep.3 rep.2 rep.4 rep.3 rep.4 rep.4 rep.4 rep.3 rep.4 rep.6 rep.Total distance [m]540600540640Maximal speed (ca. 100%)Falling start 20 m buildupBlock starts 20 build up30 m sprint40 m sprint50 m sprint2 rep.2 rep.2 rep.2 rep.3 rep.3 rep.3 rep.1 rep.4 rep.4 rep.4 rep.0 rep.3 rep.3 rep.3 rep.1 rep.4 rep.4 rep.4 rep.1 repTotal distance [m]3604003604502.3. Testing ProtocolMaximal running velocity and lower extremity explosive power were measured one day beforethe intervention and 48 h after the last training session was completed to ascertain acute trainingeffects. Pre- and post-testing was executed at the same time of the day and under identical conditions.No familiarization was provided as all of the testing protocols were well-known to the participants.A warm-up similar to the one used during the training intervention was administered prior to testing(light jogging, stretching, skipping drills, light jumps and bounds, and 30- to 50-m accelerations).The test battery included the countermovement jump (CMJ), standing long jump (SLJ), standing triplejump (STJ), and standing five jump (SFJ) to assess explosive power. After 60 min of rest, the participantsperformed the 20-m sprint (from the flying start) to evaluate sprint step kinematics and then 40 m(from a standing start) and 60 m (using starting blocks) to determine maximal running velocity.2.4. Assessment of Lower Extremity Explosive PowerThe CMJ was used to determine vertical jumping performance. The OptoJump–Microgate opticalmeasurement system (Optojump, Bolzano, Italy) determined contact and flight times with an accuracyof 0.001 s. No restrictions were placed on knee angle during the eccentric phase and the participantswere instructed to perform a dynamic double arm swing to attain maximal height. Three trials wereseparated by 1 min of rest with the highest jump selected for analysis.Horizontal jump performance was measured in the following order: SLJ, STJ, and SFJ. From anerect position with parallel feet placement, the participant executed the SLJ and was required to landon both feet in the long jump pit without falling backwards. Jumping distance was measured to thenearest 1.0 cm. The starting position for the STJ and SFJ was similar. In these jumps, after one ormore arm and leg swings, the participant performed the required number of forward jumps witheach step on an alternating leg and was required to land on both feet in the half-squat position ona special jumping mattress. Three trials were executed for each jump and the longest distance to thenearest 1.0 cm was recorded. A 2 min rest was provided between each trial and 5–6 min between eachjump modality.The reliability of the vertical and horizontal jumping tests was measured using intraclass correlationcoefficients (ICC). A posteriori analysis obtained correlations of 0.92 for CMJ jump height and 0.93 for
Int. J. Environ. Res. Public Health 2019, 16, 31385 of 13SLJ, 0.93 for STJ, and 0.90 for SFJ jump distances. The large coefficients indicate satisfactory test–retestreliability and may be explained by the extensive familiarization of all participants with executingthese jumps.2.5. Assessment of Sprint PerformanceThe 20-m flying start, 40-m standing start, and 60-m block start were performed on an indoor trackintegrated with the Brower Timing TC-System (Draper, Utah, USA). The photocells were positioned onthe track at the start and finish according to the sprint distance [3]. In the 20-m flying start, the sprinterbegan from a standing start and accelerated as quickly as possible to attain maximal running velocitywithin a 20 m run-up. Upon reaching the 20 m mark, the sprinter continued to sprint for exactly20 m at their maximal velocity. This sprint modality had been previously applied in research and isconsidered sufficient to achieve maximal velocity [3,6,16,25,26]. Two trials were executed and separatedby 2 min of rest. The same OptoJump measuring system was used to measure the spatial-temporalcharacteristics of the first nine running steps at maximal velocity including step length, step frequency,ground contact time, flight time, and step velocity. In a track configuration, the measurement systemuses a series of interconnected rods (100 cm x 4 cm x 3 cm) fitted with optical sensors. Each rod (RX barsand TX bars) is fitted with 32 photocells, arranged 4 cm one from another and 0.2 cm above the ground.The rods were distributed along the length and width of the track (20 m x 1.22 m). The device wasintegrated with a computer for data storage and processing. After completing the 20-m flying startsprint, the participants performed two trials of the 40 m from a standing start and 60 m from a blockstart. Rest intervals of 4 and 6 min were provided between trials, respectively. The fastest time in eachdistance was selected for analysis.2.6. Statistical AnalysisMeans (x) and standard deviations (SD) were calculated for all dependent variables. Student’s t-testwas used to examine pre- and post-test differences in running velocity and jumping performance.Fisher’s least significant difference (LSD) tests were performed post hoc to determine pairwisedifferences when significant F ratios were obtained. Variability in the nine steps was quantifiedby calculating the SD and confidence intervals (95%CI). The associations between the performancevariables (sprint times and jump distance/heights) were determined by Pearson product–momentcorrelations. Additionally, hierarchical cluster analysis using Ward’s method was used to determinethe linkage distances among the kinematic characteristics grouped as elementary determinants ofsprint velocity. A statistical power of 0.90 was determined satisfactory and an alpha level of 0.05 wasaccepted as statistically significant (denoted in bold font).3. ResultsTable 3 provides the anthropometric and personal bests in the 60 m and 100 m of the elite andsub-elite sprinters.Table 3. Descriptive statistics and Student’s t-test results of group age, anthropometric characteristics,and personal best (PB) times.Sub-EliteVariablesAge (years)Height (cm)Body mass (kg)BMI (kg/m2 )60 m PB100 m 33.918.240.740.790.04Bold format: significant differences.tp 6.240.78 0.32 280.000097
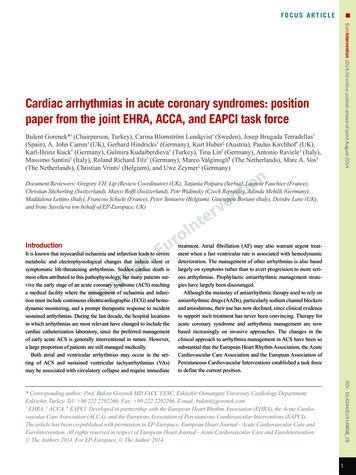
Int. J. Environ. Res. Public Health 2019, 16, 31386 of 13Height, body mass, and BMI were similar between the groups. The differences between the eliteand sub-elite group for age and personal bests were significant (p 0.05).Table 4 presents the pre- and post-test results in sprint and jump performance.Significant differences were observed in all variables in which jumping distances increased andrunning times decreased in both the elite and sub-elite sprinters (p 0.05). Sprint step characteristicsare presented in Figure 1. In the elite sprinters, contact time (CT) decreased post-test in steps fourto seven whereas the lowest value was attained in the ninth step. CT showed a decreasing trendfrom the first to ninth step. Among the sub-elite sprinters at pre-test, a trend towards increased CTbetween the first and ninth steps was observed. At post-test, increased CT was observed in stepsfour to eight. The flight time (FT) in both groups increased post-test from the first to the eighth step.Greater FT was achieved by the sub-elite sprinters at post-test. Step length (SL) in both the elite andsub-elite sprinters showed an upward trend at pre-test, with increased SL from the first to the eighthstep, only to become more linear at post-test. Additionally, post-test SL magnitudes increased inboth groups. Step frequency (SF) showed an irregular pre-test trend in both the elite and sub-elitesprinters. Following the intervention, SF increased in the elite sprinters, particularly in the last threesteps. Changes in step velocity (SV) were more pronounced compared with the other variables in bothgroups particularly at pre-test (an increase in two consecutive steps followed by a decrease in the nexttwo steps).Table 4. Student’s t test results for the dependent variables.VariableSub-elitexSDxPre testSD x xSDtpConfidence 95.00%Confidence 95.0%Post test60m–60m t2 (s)7.100.097.020.050.080.044.770.00300.0380.12120m flying–20mflying 2t (s)2.210.082.130.050.070.053.570.01160.0240.12940m –40m 2t (s)4.370.044.320.030.060.017.940.00000.0400.076 0.039SLJ–SLJ 2t (cm)2.910.062.990.07 0.080.04 4.810.0029 0.120STJ–STJ 2t (m)8.560.168.800.18 0.240.07 8.670.0001 .0313 0.175SFJ–SFJ 2t (m)14.900.6215.560.53 0.660.13 13.660.0000 0.775 0.539CMJ –CMJ 2t(cm)76.434.8982.715.34 6.291.70 9.760.0000 7.862 4.709ElitePre testPost test60m–60m t2 (s)6.790.086.720.080.060.027.170.00030.0400.08220m flying–20mflying 2t (s)2.070.041.970.070.110.074.170.00580.0470.17940m –40m 2t (s)4.120.024.080.010.040.024.580.00370.0180.061SLJ –SLJ 2t (m)3.150.103.230.11 0.070.05 3.920.0078 0.118 0.027STJ–STJ 2t (m)9.390.529.890.48 0.490.21 6.280.0007 0.693 0.304SFJ–SFJ 2t (m)15.810.4416.590.57 0.780.50 4.110.0062 1.244 0.316CMJ –CMJ 2t(cm)81.572.5787.861.07 6.282.06 8.080.0001 8.189 4.3822t—post test results, bold format—significant differences.
Int. J. Environ. Res. Public Health 2019, 16, 31387 of 13Figure 1. Sprint step kinematics characterizing the first nine steps (S) in the 20-m flying start sprint.Post-test variability in the sprint step characteristics was significant for group and step (p 0.05)(Table 5). The interactions ST group, SL group, ST SL, and ST SL group did not show variabilityexcept SV and CT (p 0.05). Consequently, the consistent generation of high horizontal velocity in therun-up resulted in greater running velocity with stable SV when sprinting the 20 m distance.Table 5. ANOVA results of sprint step kinematics.Main EffectFeatureGroupFCTpPT GroupSTFpFpStep GroupStepFpFpST stepST step groupFFpp0.270.6129 4.090.0660 2.790.1206 2.140.0388 0.740.6540 0.190.9918 2.340.0240FT9.050.0109 0.530.4789 0.850.3756 10.580.0000 0.240.9812 0.540.8220 0.570.8016SF4.910.0468 0.330.5763 0.730.4100 0.900.5167 1.680.1121 0.890.5247 1.130.3484SL0.610.4489 0.320.5841 0.080.7828 18.230.0000 0.250.9798 0.500.8503 0.500.8519SV56.640.0000 2.720.1249 0.740.4080 8.220.0000 2.060.0475 0.480.8703 0.800.6012SST—sprint-speed training; bold format—significant differences.Table 6 presents the pre- and post-test correlation coefficients for the performance measures in the20-m flying start, 40-m standing start, and 60-m block start sprints and vertical and horizontal jumpingtests. At pre-test, the only significant correlation in the sub-elite group was between the 60-m blockstart and SLJ (r 0.76) and SFJ (r 0.77). In the elite group, a significant relationship was foundbetween the 60-m block start and the 20-m flying start (r 0.81) and 40 m standing start (r 0.76).No other significant pre-test correlations were found. Post-test analysis revealed correlations betweenthe 20-m flying start and 40-m standing start and SLJ and STJ performance in the sub-elite group.In the elite sprinters, only the correlation between 60-m block start and SFJ performance was significant(r 0.87). Many of the horizontal jump tests (SLJ, STJ, SFJ) were strongly associated with each other,however, no significant pre- and post-test correlations were observed between CMJ with any of thevariables in either group.
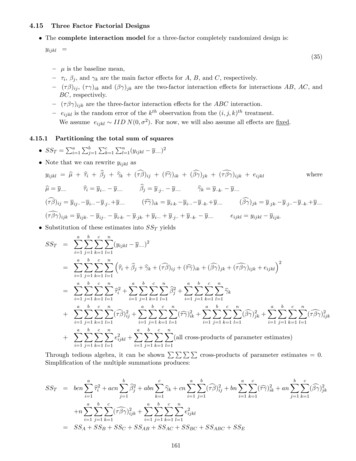
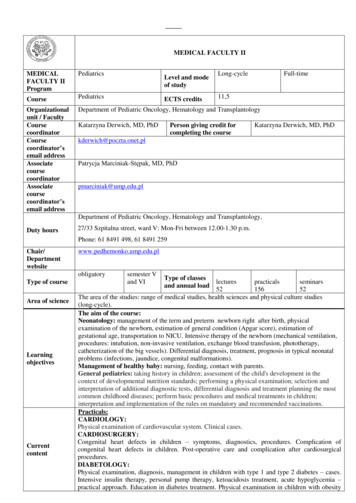
Int. J. Environ. Res. Public Health 2019, 16, 31388 of 13Table 6. Spearman rank correlation coefficients between sprint performance and lower extremityexplosive power [3][4][5][6][7] 0.77 0.760.85---0.81 0.76- 0.87 *---- 0.76 *0.90 *----------- 0.85 *----20 m flyingstart [2]--------- 0.76 *----40 m [3]-------[7][6]-[5] 0.790.82 *0.79 *----- 0.90------0.79 *------------60 m [1]SLJ [4]STJ [5]SFJ [6]-----0.85*-----0.79---------------CMJ [7]Italic means pre-test result, bold with * means post-test result.Hierarchical cluster analysis of the grouped variables is illustrated in Figure 2 (pre-test) andFigure 3 (post-test). Comparison of the two dendrograms did not reveal any differences between theemerging clusters. At both time points, the individual clusters were grouped similarly to form twolarge characteristic aggregations. This suggests a congruency of the kinematic variables and a relativelyloose relationship with no significant effect of one cluster on the other. Additionally, the Euclideandistances of the clusters in the pre-test and post-test clusters were similar.Figure 2. Dendrogram clustering of pre-test sprint step kinematics.
Int. J. Environ. Res. Public Health 2019, 16, 31389 of 13Figure 3. Dendrogram clustering of post-test sprint step kinematics.4. DiscussionSignificant post-test improvements in 60-m block start times were observed in both the elite andsub-elite sprinters by 1.04% and 1.23%, respectively. Improvements were also noted in 20-m flyingstart performance by 4.84% and 3.62% in the elite and sub-elite sprinters, respectively. Only marginalimprovements (not statistically significant) were found for 40-m standing start performance, in whichsprinting time improved by 0.98% in the elite group (Table 5). While indicative that ST has a positiveeffect on sprint performance, the findings are difficult to interpret due to the lack of similar data in theliterature. However, comparisons can be made with studies that examined the effects of plyometricstraining on maximal running velocity. In this context, the results of the present study are comparablewith those reported by Kreamer et al. [27], Hennessy and Kilty [12], and Mackala and Fostiak [3].There is strong evidence that plyometrics training enhances the stretch-shortening cycle of muscleto improve elastic energy storage [28] and generate faster and more powerful movements [29]. ST issimilar in this regard in that it can likewise activate the elastic properties of muscle fibers and connectivetissue to also allow greater elastic energy storage that, after its release, can provide additional impetusduring running [6].An important question in this regard is whether ST is more effective than plyometrics training inenhancing explosive power and maximal running velocity. The data from this study can be comparedwith previous research that used an identical testing protocol to assess the effects of six sessions ofplyometrics training [3]. When compared with this study, ST shows greater improvements in 20- and60-m flying start sprint times (by 0.5% to 2%, respectively) and horizontal jump performance (STL andSTJ). In turn, the plyometrics intervention showed greater increases in standing jump (SJ) and CMJperformance [3]. Some studies reported strong correlations (r) from 0.65 to 0.90 between sprinting
Int. J. Environ. Res. Public Health 2019, 16, 313810 of 13and drop jump (DJ), SJ, CMJ performance, depending on the sprint distance (20–100 m) and type ofjump [12,30,31]. These findings are comparable with the present investigation, in which significantpost-test correlations were observed between 60-m block start times and SLJ in the sub-elite (r 0.76)and STJ in the elite (r 0.85) group. Strong correlations were also observed between 20-m flying starttimes and STJ performance (r 0.85) in the sub-elite group but not in the elite group.The secondary purpose of the study was to examine the effects of ST on sprint step kinematics(SL, SF, FT, CT, and SV). Analysis of SL in both groups of sprinters was compared with other researchwhere high-performance sprinters were investigated [16,22,32–34]. These studies reported that SLincreased with running velocity and with sprint distance. In our study, linear increases in SL (betweensteps two and eight in the elite and steps two and six and also step eight in the sub-elite sprinters) wereobserved in both groups at both time points. SL increased only in the sub-elite group by approximately4 cm at post-test with no changes observed in the elite group. SL was maintained at 228 and 230 cm(sub-elite and elite, respectively) in the last three steps (Figure 1). This may be explained by the factthat the flying start involved a 20-m run-up and, therefore, a combined distance of 40 m. Therefore, it ispossible that SL was still increasing with each step (build-up phase) that only plateaued at the end ofthe 20 m sprint distance when maximal velocity was attained. In turn, the changes in SF were lesspronounced and remained relatively similar in the sub-elite group but slightly decreased from 4.38 to4.33 Hz in the elite group. Post-test SF in the elite group was similar between the second and sixth step(difference of only 0.03 Hz), whereas greater variability was observed between the second and sixthstep in the sub-elite group at pre- and post-test.Considering both SF and SL, the elite sprinters presented greater SF and slightly longer SL thanthe sub-elite sprinters (Figure 1). This result suggests that the improvement in sprint performancevia increased running velocity does not demonstrate the classic dependency between SL and SF.This contradicts the study of Bezodis et al. [19], who reported a weak correlation (r –0.192) betweenSL and running velocity but a strong correlation between SF and running velocity (r 0.886). In turn,Hunter et al. (2004) found a strong correlation between sprint velocity and SL (r 0.73) and onlya weak correlation between sprint velocity and SF (r –0.14). While this contradicts the previousfinding, it does confirm Delecluse et al. [35] who used regression analysis to find that ca. 85% ofvariance in running velocity can be explained by variance in SL. Similarly, Mackala [34] examinedwhether an increase in SF or SL would increase running velocity to find that SL was more stronglyassociated with running velocity than SF.Post-test SV increased from 9.10 m/s to 9.26 m/s in the sub-elite and from 9.93 m/s to 9.98 m/s inthe elite group. Single sprint step execution in the elite sprinters showed a linear increase across stepsone to nine at both pre- and post-test with no changes in SL in step four and seven when comparedwith earlier steps three and six. In turn, the sub-elite sprinters showed more pronounced variation inSV and SL, which, in turn, may have perturbed the sprinting movement and thus explain the slowerrunning velocity (Figure 1). As SV is a product of reduced CT during the support phase, this mayexplain the increased running velocity in the elite sprinters. According to Coh et al. [17], and Alcarazet al. [36] the most important factor in sprint step efficiency is the support phase, especially the ratiobetween the braking and propulsion phases. Therefore, maximal running velocity can be achievedonly if the force impulse is as small as possible during the braking phase and may be possible bypositioning the foot of the push-off leg as close as possible to the vertical projection of the body’s centerof gravity on the surface. Although this was not measured in the present study, this is the most rationalexplanation for the increases in running velocity in the 20-m flying start. Hence, the various sprintdistances involved in the SST intervention may have increased execution economy during the supportphase by positioning the center of gravity closer to the fulcrum
Speed training (ST) shows potential in the reduction of step variability and as an e ective short-term intervention program in the improvement of sprint performance. Keywords: sprinting; speed; sprint exercises; step variability; kinematics 1. Introduction Past investigations have indicated a significant commonality between sprinting performance